The link between coherent burst oscillations, burst spectral evolution and accretion state in 4U 1728–34
Abstract
Coherent oscillations and the evolution of the X-ray spectrum during thermonuclear X-ray bursts in accreting neutron-star X-ray binaries have been studied intensively but separately. We analysed all the X-ray bursts of the source 4U 1728–34 with the Rossi X-ray Timing Explorer. We found that the presence of burst oscillations can be used to predict the behaviour of the blackbody radius during the cooling phase of the bursts. If a burst shows oscillations, during the cooling phase the blackbody radius remains more or less constant for s, whereas in bursts that do not show oscillations the blackbody radius either remains constant for more than s or it shows a rapid (faster than s) decrease and increase. Both the presence of burst oscillations and the time-dependent spectral behaviour of the bursts are affected by accretion rate. We also found that the rise time and convexity of the bursts’ light curve are different in bursts with and without oscillations in 4U 1728–34. Bursts with oscillations have a short rise time ( s) and show both positive and negative convexity, whereas bursts without oscillations have a long rise time ( s) and mostly positive convexity. This is consistent with the idea that burst oscillations are associated with off-equator ignition.
keywords:
stars: neutron — X-rays: binaries — X-rays: bursts — stars: individual: 4U 1728–34Accepted. Received; in original form
1 introduction
Thermonuclear, type-I, X-ray bursts (e.g., Lewin et al., 1993; Strohmayer & Bildsten, 2003; Galloway et al., 2008) are due to unstable burning of accreted H and/or He on the surface of accreting neutron stars (NS) in low-mass X-ray binaries (LMXBs). Typical bursts exhibit rise times of 110 s, durations of a few tens of seconds to a few minutes, and have total energy outputs of erg. Some X-ray bursts are strong enough to reach the Eddington luminosity. In those so-called photospheric radius expansion (PRE) bursts, the radiation pressure is high enough to trigger the expansion of the outer layers of the NS atmosphere (e.g., Basinska et al., 1984; Kuulkers et al., 2002).
The inferred emission area of a NS can be estimated from the fitting of the energy spectra during the decaying phase of type-I X-ray bursts, assuming that the thermonuclear flash expands to cover the entire star during the radius expansion and cooling phases of the burst (van Paradijs, 1978). There are a number of theoretical and observational arguments that support this assumption (see, e.g. Fryxell & Woosley, 1982; Bildsten, 1995; Spitkovsky et al., 2002; Strohmayer & Bildsten, 2003). Recent work has shown that during the cooling phase of the bursts, the relation between the bolometric flux and the temperature is significantly different from the canonical relation that is expected if the apparent emitting area on the surface of the NS remains constant as the flux decreases during the decay of the burst and if the spectrum is blackbody (Zhang et al., 2011; Suleimanov et al., 2011; García et al., 2013). This could be due to either changes in the emitting area of the NS, or to changes in the colour-correction factor, , which accounts for hardening of the spectrum arising from electron scattering in the NS atmosphere, among other factors (van Paradijs, 1982; Suleimanov et al., 2011).
Coherent oscillations during bursts have been detected in many NS-LMXBs; these oscillations likely reflect the spin frequency of the NS (e.g., Strohmayer et al., 1997; Chakrabarty et al., 2003), but the mechanism of burst oscillations is still unclear (e.g., Strohmayer et al., 1996; Muno et al., 2004). Strohmayer & Markwardt (1999) suggested that burst oscillations are caused by asymmetries due to initially localized nuclear burning (the hot spot) that later spreads over the surface of the NS in the rise phase of the burst. This scenario has been supported by Chakraborty & Bhattacharyya (2014) using a large sample of bursts from 10 NS LMXB. This scenario, however, can not explain oscillations that persist for as long as 510 s in the burst decay.
In some well-studied burst-rich accreting NS systems (e.g. 4U 1636–53, 4U 1608–52, KS 1731–260 and Aquila X-1, Muno et al., 2004; Galloway et al., 2008; Zhang et al., 2011), not all the bursts show coherent oscillations. Muno et al. (2004) showed that the appearance of burst oscillations is correlated with the accretion rate onto the NS. By analysing a large number of bursts in 4U 1636–53, Zhang et al. (2013) found that burst oscillations are always associated with an emitting area that remains constant for more than two seconds during the decaying phase of the burst. They suggested that tail oscillations could be due to the spread of a cooling wake, which is formed by vortices during the cooling of the NS atmosphere (Spitkovsky et al., 2002). In this scenario, the speed of the cooling wake depends on the latitude at which the burst ignites, since the speed of the burning front near the equator is higher than that near the poles. Zhang et al. (2013) suggested that in 4U 1636–53 the bursts with tail oscillations ignite at high latitude on the NS surface. Rectntly Kajava et al. (2014) found a correlation between the persistent spectral properties and the time evolution of the blackbody normalization during the burst decay. They suggested that this observed behaviour may be attributed to the accretion flow, which influences the spectrum of the cooling NS. It’s an interesting quesiton whether the link is between burst oscillations and time-resolved spectrum, or between accretion rate and burst oscillations and time-resolved spectrum. We investigate it here in another source 4U 1728–34.

Studying the burst morphologyrise shapecan also help us to understand the ignition latitude and other various processes operating during the burst rise. Maurer & Watts (2008) developed a simple phenomenological model and they simulated burst light curves with ignition at different latitudes on the NS surface. They found that bursts that ignite near the equator always show convex rise shape, whereas bursts that ignite near the pole show either convex or concave rise shape.
The NS LMXB 4U 1728–34 is one of the best studied sources of type-I X-ray bursts (e.g., Forman et al., 1976; Hasinger & van der Klis, 1989; van Straaten et al., 2001, 2002). The distance to the source is between 4 and 6 kpc, based on the Eddington flux of the PRE bursts (e.g., Di Salvo et al., 2000; van Straaten et al., 2001; Galloway et al., 2008). The bursts in 4U 1728–34 have all short rise times and similar duration (van Straaten et al., 2001; Galloway et al., 2008), that is the characteristic behaviour of helium-rich bursts. Using an analytical model of X-ray burst spectral formation, Shaposhnikov et al. (2003) claimed that 4U 1728–34 is an ultra-compact X-ray binary (UCXB) with an evolved, H-poor, donor. Nearly coherent oscillations during X-ray bursts at 363 Hz from this source were first reported by Strohmayer et al. (1996). van Straaten et al. (2001), Muno et al. (2001) and Muno et al. (2004) analysed observations of 4U 1728–34 with Rossi X-ray Timing Explorer (RXTE) and found a relationship between the appearance of burst oscillations and the mass accretion rate.
In this paper we present the X-ray spectral and burst oscillation properties of all the type-I bursts in 4U 1728–34 observed with RXTE. In particular, we investigate the difference between the bursts with and without oscillations. We find strong evidence for a link between coherent oscillations and the evolution of the apparent emission area during the bursts. We also find that the rise time and the shape of the light curve at the beginning of the bursts are different for bursts with and without oscillations in 4U 1728–34. We describe the observations and data analysis in Section 2, and we present our results in Section 3. Finally, in Section 4 we discuss our findings and conclude in Section 5
2 Observation and data reduction
We analysed all available data (411 observations for a total of ks) of 4U 1728–34 from the Proportional Counter Array (PCA) on board RXTE (Jahoda et al., 1996, 2006). Due to the affect by the presence of the nearby transient 4U 1730–335 (the Rapid Burster), 12 observations were not used in this work. The PCA consists of an array of five collimated proportional counter units (PCUs) operating in the 260 keV range. We produced 0.25-s light curves from the Standard-1 data (0.125-s time-resolution with no energy resolution) and searched for X-ray bursts in these light curves following the procedure described in Zhang et al. (2011). We detected a total of 121 type-I X-ray bursts in these data.
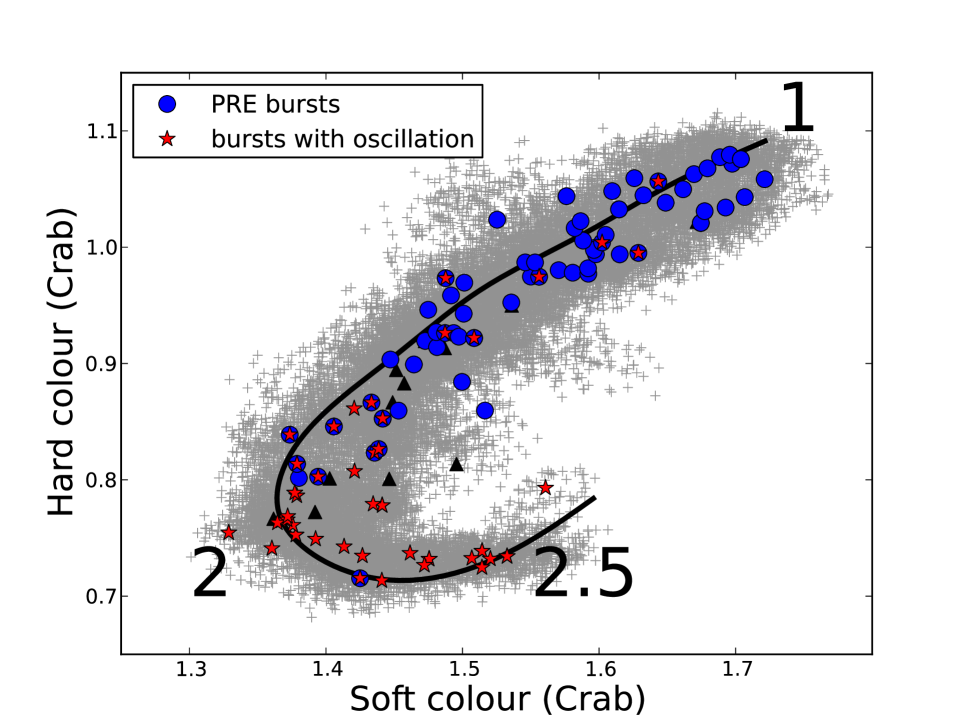
We used the Standard-2 data (16-s time-resolution and 129 channels covering the full keV PCA band) to calculate X-ray colours of the source. We defined hard and soft colours as the keV and keV count rate ratios, respectively (see Zhang et al., 2011, for details). We show the Colour-Colour Diagram (CD) of all observations of 4U 1728–34 in Figure 1. We parametrized the position of the source on the diagram by the length of the solid curve (see, e.g. Méndez et al., 1999; Zhang et al., 2011), fixing the values of and at the top-right and the bottom-left vertex of the CD, respectively.
We used the high-time resolution modes that were available for each observation to produce a spectrum every 0.25 s during the whole duration of each burst. We generated the instrument response matrix for each spectrum with the standard ftools routine pcarsp, and we corrected each spectrum for dead time using the methods supplied by the RXTE team. Due to the short exposure time used to generate each spectrum, statistical errors were dominant, and we did not include any additional systematic error to the spectra. For each burst we extracted the spectrum of the persistent emission just before or after the burst to use as background in our fits.
We fitted the spectra using xspec version 12.8.0 (Arnaud, 1996), restricting the spectral fits to the energy range keV. We fitted the time-resolved net burst spectra with a single-temperature blackbody model (bbodyrad in xspec), as generally burst spectra are well fitted by a blackbody (e.g., van Straaten et al., 2001; Kuulkers et al., 2002; Galloway et al., 2008). We also included the effect of interstellar absorption along the line of sight using the xspec model . During the fitting we kept the hydrogen column density, , fixed at cm-2 (D’Aí et al., 2006), and to calculate the radius of the emitting blackbody area in km, , we assumed a distance of 5.2 kpc (e.g., Di Salvo et al., 2000; van Straaten et al., 2001; Galloway et al., 2008).
For each burst we computed Fourier power density spectra (PDS) from 2-s data segments for the duration of the burst using the 125 s binned data over the full PCA band pass, setting the start time of each segment to 0.125 s after the start time of the previous segment. We used these PDS to produce time-frequency plots (also known as dynamic power spectra; see Berger et al., 1996) for each burst. For coherent oscillations, we only searched the frequency range Hz with a resolution of 0.5 Hz. We considered that a signal was significant if it had a probability of that it was produced by noise accounting for the number of possible independent trials, and if the signal appeared in at least two PDS within the tail of a single burst. (See discussion in Zhang et al., 2013, for details about the detection and measurement of burst oscillations.)
3 Results
3.1 Time-resolved spectra and burst oscillations
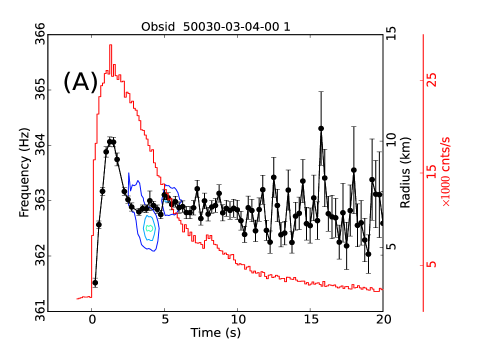
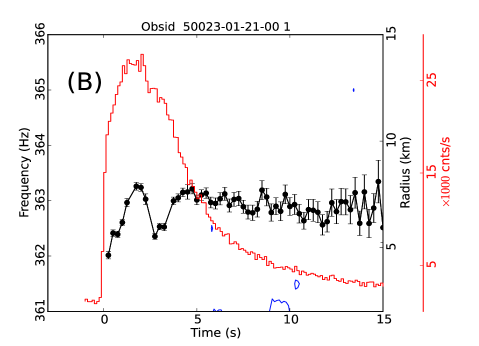
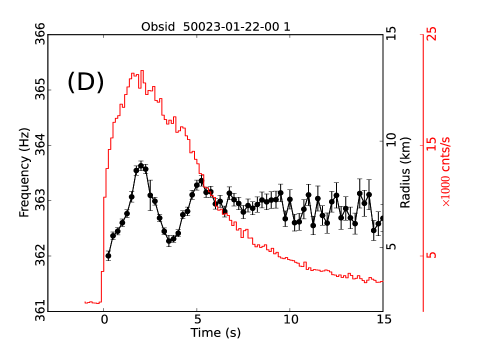
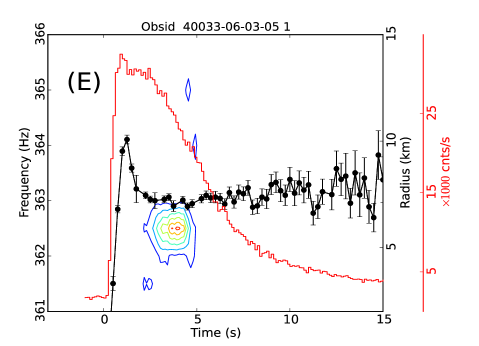
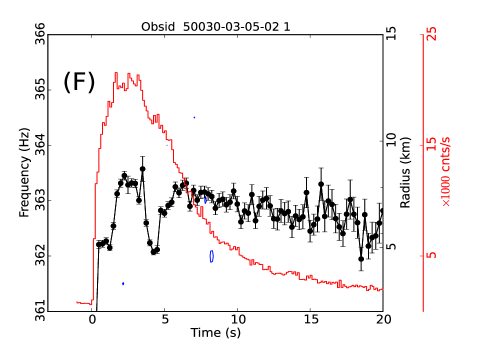
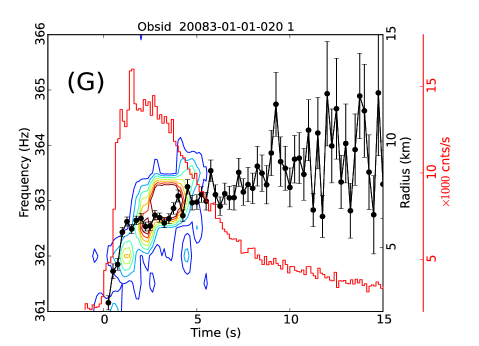
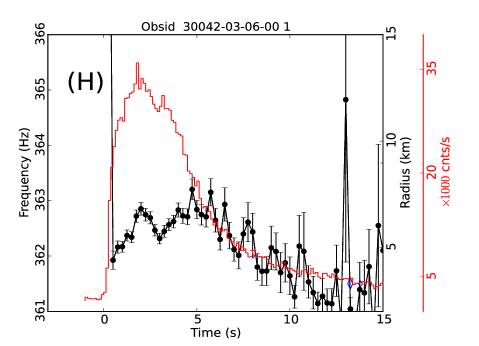
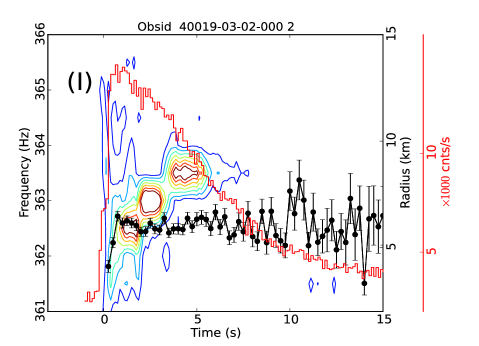
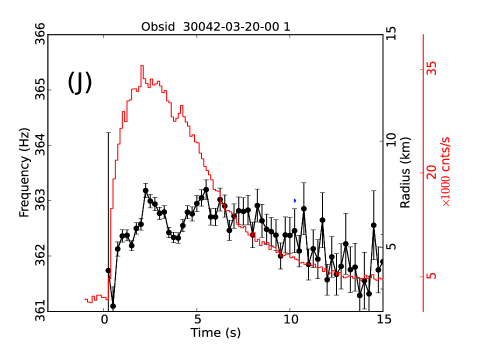
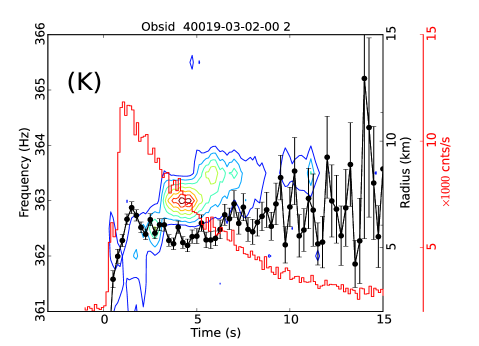
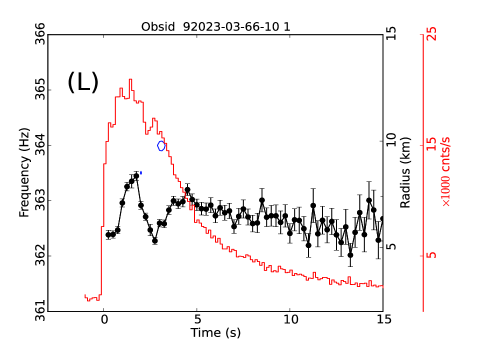
In Figure 2a and 2b we show twelve examples of type-I X-ray bursts of 4U 1728–34. In the left panels of this Figure we show six cases of bursts with oscillations, while in the right panels we show six cases of bursts without oscillations. In each panel the red histogram shows the shape of the light curve of the bursts at a resolution of 0.125 s. The contour lines show constant Fourier power values, increasing from 10 to 80 in steps of 10 (values are in Leahy units), as a function of time (-axis) and frequency (left -axis). Black filled circles connected by a line show the fitted blackbody radius as a function of time at 0.25-s time resolution (see the right -axis). The burst light curve is aligned to the centre of each time interval used to calculate the power and energy spectra.
In the PRE bursts of 4U 1728–34, Figure 2a shows that the behaviour of the blackbody radius during the photospheric radius expansion phase is quite different between bursts with and without oscillations. In the PRE bursts with oscillations the blackbody radius increases very fast ( s) to a maximum value and then decreases, whereas in the PRE bursts without oscillations the blackbody radius increases somewhat slower ( s to reach the maximum value).
We also find that the behaviour of the blackbody radius after the touch down point is not the same for all the PRE bursts in 4U 1728–34. In PRE bursts with oscillations, after the expansion phase the blackbody radius, , first decreases rapidly, it then stays constant for a while, and finally it either increases slightly, or it remains more or less constant towards the tail of the burst (see left panels of Figure 2a). In the PRE bursts without oscillations, after the expansion phase the blackbody radius first decreases rapidly to a minimum, then it immediately increases again very quickly, and finally it either decreases slightly, or it remains more or less constant (see right panel of Figure 2a). This behaviour is similar to the one found in the LMXB 4U 1636–53 by Zhang et al. (2013).
We detected nine non-PRE bursts with tail oscillations in our observations of 4U 1728–34. Similar to the case of PRE bursts in this source, after the peak of the burst these non-PRE bursts show a period in which remains more or less constant during the time in which tail oscillations are present (see the left panels of Figure 2b).
In Zhang et al. (2013) we found that, for PRE bursts, in 4U 1636–53 the presence of burst oscillations is associated with the duration of the post touchdown phase. This distinction, however, only works for PRE bursts, since there is no touch down or post touch down phase in non-PRE bursts. In the following subsections we explore other properties of the bursts that, at least in the case of 4U 1728-34, appear to be associated with the presence of burst oscillations in the tail of the bursts.
3.2 The blackbody normalization as a function of flux
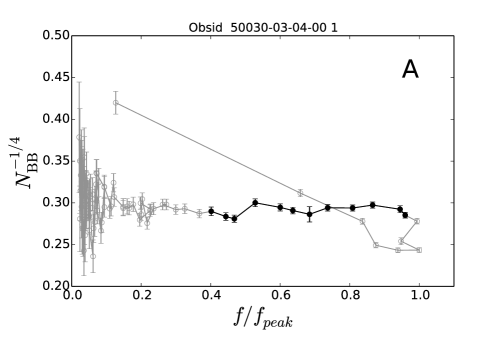
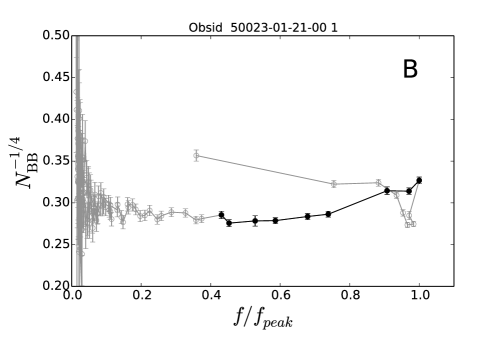
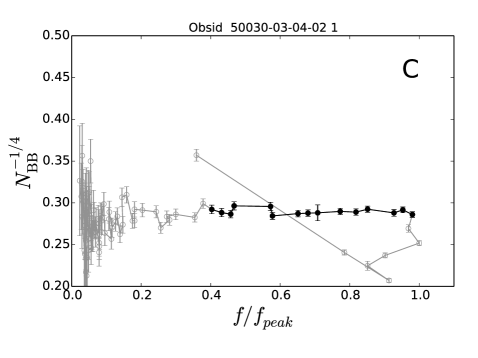
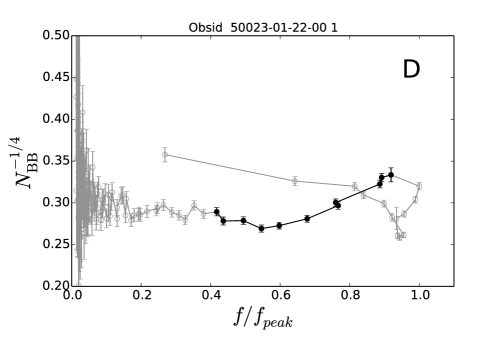
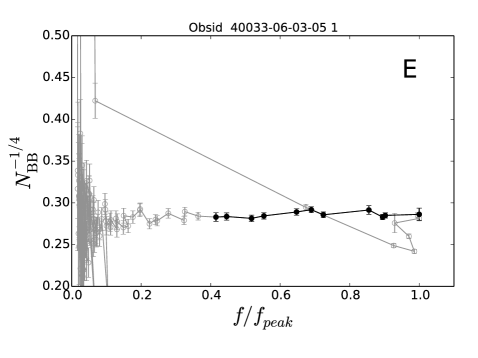
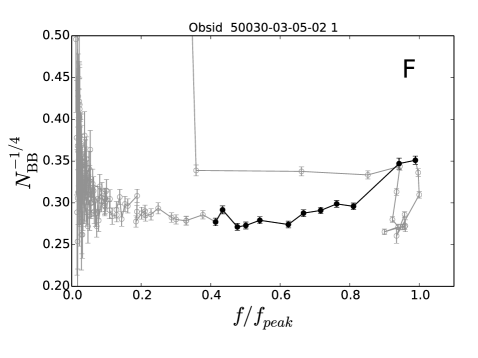
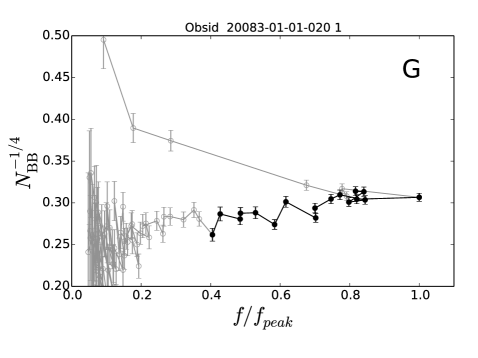
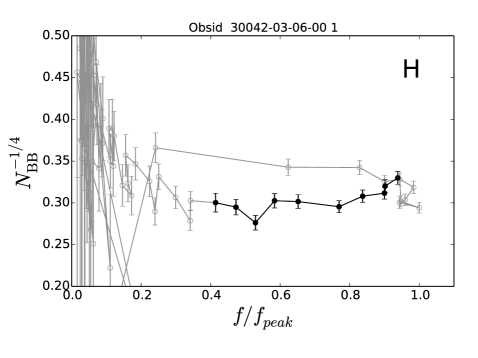
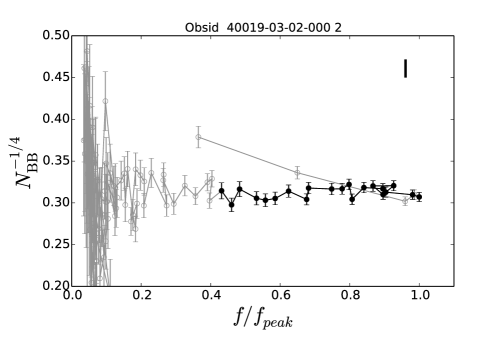
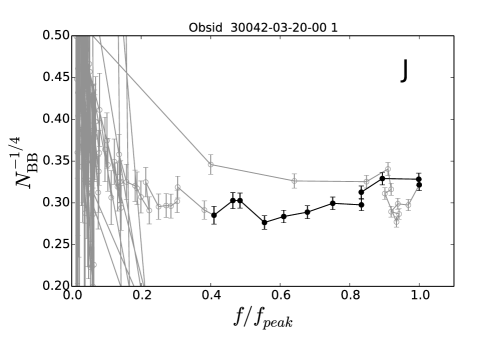
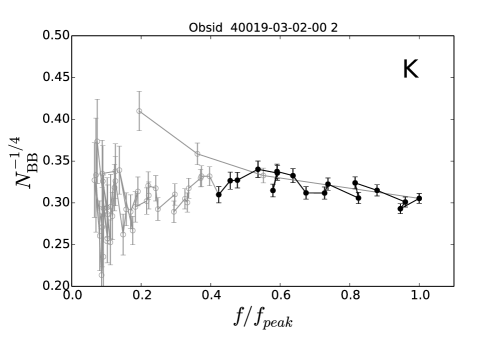
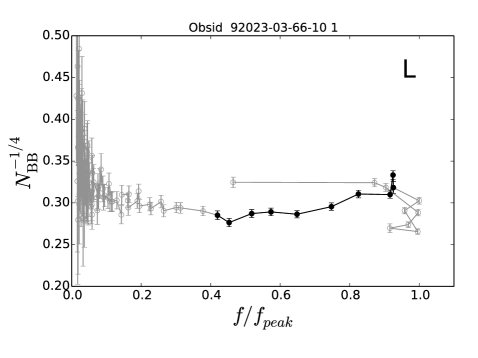
From blackbody fits to the time-resolved spectra of the thermonuclear X-ray bursts we can obtain and , the blackbody radius and colour temperature, respectively, from which we can calculate the bolometric flux of the neutron star. Zhang et al. (2011) and García et al. (2013) found that, in the cooling phase of bursts in 4U 1636–53 and 4U 1820-30, the relation between the bolometric flux and the temperature is very different from the canonical relation which is expected if the apparent emitting area on the surface of the NS remains constant and if the spectrum is blackbody. Departures from the relation have also been reported from other NS-LMXB systems (Suleimanov et al., 2011; Kajava et al., 2014). This could be due to either changes in the emitting area of the neutron star during this phase, or to changes in the colour-correction factor, , where is the NS radius observed at infinity and is the effective surface temperature. If the apparent emitting area on the surface of the NS remains constant as the flux decreases during the decay of the bursts, can be expressed in terms of the blackbody normalization: , where , with the distance to the source in units of 10 kpc (Suleimanov et al., 2011).
In Figures 3a and 3b we show as a function of flux during the same 12 X-ray bursts shown in Figures 2a and 2b. The flux in the axis is normalised by the peak flux of each burst individually. In the left panels of this Figures we show bursts with oscillations, while in the right panels we show bursts without oscillations. We found that in bursts with oscillations, especially in the case of PRE bursts (see Figures 3a), at the beginning of the cooling phase and immediately after the touch down point, the value of remains more or less constant as the flux decreases, whereas in bursts without oscillations the value of decreases when the flux decreases in the decay phase of the bursts.
In order to quantify this, and to see whether the differences appear in all the bursts (including non-PRE) we did the following analysis. We fitted a linear function to the data during the early cooling phase of the bursts in the flux diagram. For the PRE bursts, we defined the early cooling phase of the bursts as the time interval from the touch down point down to the moment when the burst flux returned to 40% of the touch down flux. For the non-PRE bursts we defined the early cooling phase of the bursts as the time interval from the peak of the burst to the moment when the burst flux returned to 40% of the peak flux. The early cooling phase as defined in the plots in black filled circles in Figure 3a and 3b
Since different bursts in 4U 1728–34 have slightly different peak or touch-down flux, we also used the Eddington flux to normalize the bursts flux and repeated the analysis described above. In this case we used an Eddington flux of ergs cm-2 s-1 (e.g., Di Salvo et al., 2000; van Straaten et al., 2001; Galloway et al., 2008).
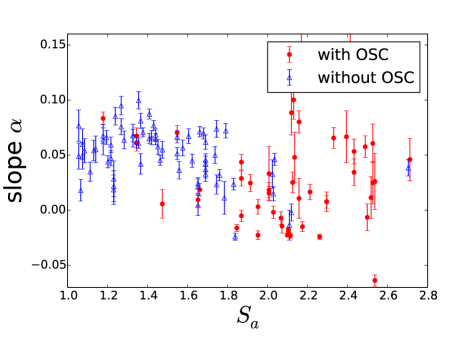
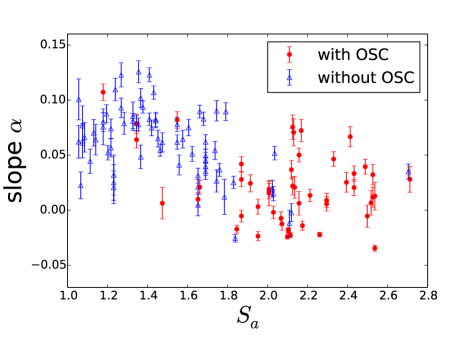
The two different flux normalizations give slightly different slopes in the fits of the flux plots for each burst. In Figure 4 we show the fitted slope of each burst as a function of . In the upper panel, the burst flux is normalized by the Eddington flux, while in the lower panel the burst flux is normalized by the peak flux of each burst. The red filled circles indicate bursts without oscillations, while the blue open triangles indicate bursts without oscillations. The error bars represent the 1- confidence level.
Most of the bursts without oscillations take place at low values in the CD, and have a positive slope in the flux diagram. On the contrary, most bursts with oscillations take place at high values of , and the slope in the flux diagram shows both positive and negative values.
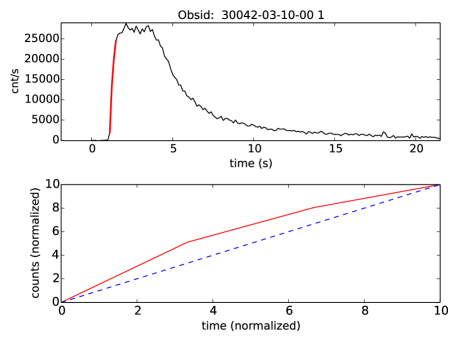
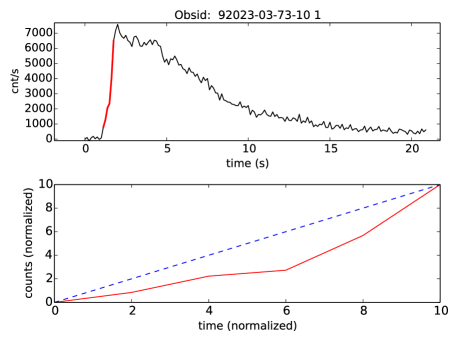
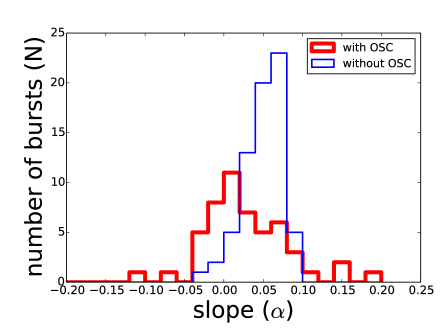
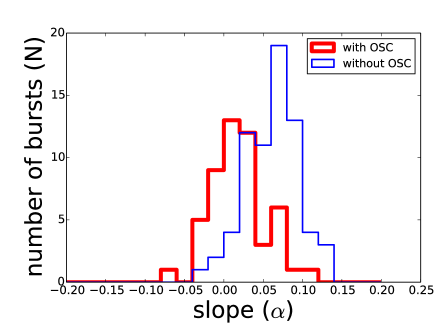
Figure 5 shows the distribution of the slopes of the linear fit to the flux plots, both for bursts with and without oscillations. The burst fluxes are normalized by the Eddington flux in the upper panel and by the peak (touch-down) flux in the lower panel. It is apparent in Figure 5 that in bursts without oscillations the slope values are generally above zero, whereas in bursts with oscillations the slopes are generally around zero. A Kolmogorov–Smirnov (KS) test gives a probability of (burst fluxes normalized by Eddington flux) and (burst fluxes normalized by the peak flux) that the two samples come from the same parent population.
3.3 X-ray bursts’ light curves
3.3.1 The bursts rise phase–Convexity
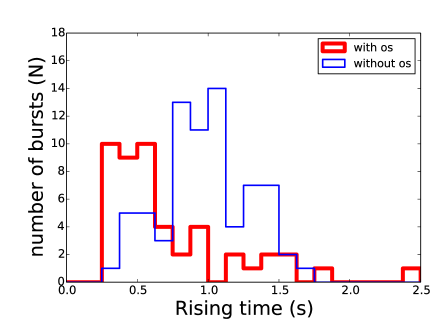
We found that the shape of the burst light curve is also different in bursts with and without oscillations. In bursts with oscillations the flux increases very sharply before it reaches the maximum, and the rise time in these bursts is very short. On the contrary, in burst without oscillations the flux increases very sharply until about half of the peak flux, and from that point onwards the rate of increase of the flux slows down. To quantify this behaviour we used data between 10% and 90% of the burst peak flux to measure the burst rise time. As shown in the upper panel of Figure 7, most of the bursts with oscillations have rise times around s (red histogram), whereas the rise time in bursts without oscillations is around s (blue histogram). The KS probability that the two sample distributions come from the same parent population is
In order to describe the shape of the burst rise phase quantitatively, we used the convexity () parameter in our analysis (Maurer & Watts, 2008). We used the same method in (Maurer & Watts, 2008) to calculate the convexity. We used the data where the count rate rises from 10 to 90 percent of the maximum count rate (after subtracting the pre-burst emission). In order to compare the shape of bursts of different durations and peak count rates we normalised the count-rate and time axes so that the burst rises from 0 to 10 normalised count-rate units within 10 normalised time units.
| (1) |
In equation 1, is the re-normalized count rate in each bin, and is the identity function (shown as a diagonal dashed line in the lower pannels of (a) and (b) in Figure 6), N is the number of re-normalized time bins and is the re-normalized time bin size. Convexity is effectively the integrated area of the curve above or below the diagonal line - areas above the line being positive and areas below negative. The convexity describes the curvature in the light curve rise and quantify whether the curve is convex (convexity ) or concave (convexity ). In Figure 6 we show two examples of bursts with positive and negative convexity.
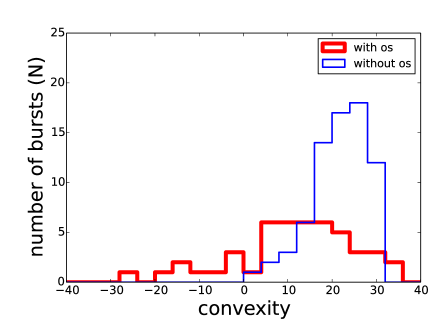
We calculated the convexity of the light curves of all X-ray bursts in 4U 1728–34. In the lower panel of Figure 7 we show the distribution of convexity both for bursts with and without oscillations. It is apparent that bursts without oscillations always have positive convexity, whereas bursts with oscillations show both positive and negative convexity. The KS probability that the two sample distributions come from the same parent population is
3.3.2 The bursts peaking phase
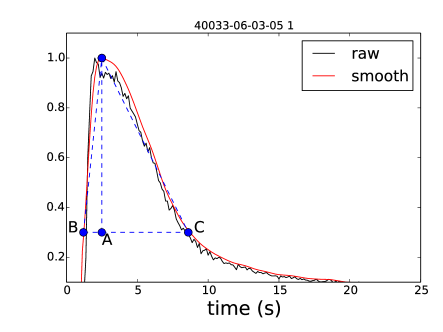
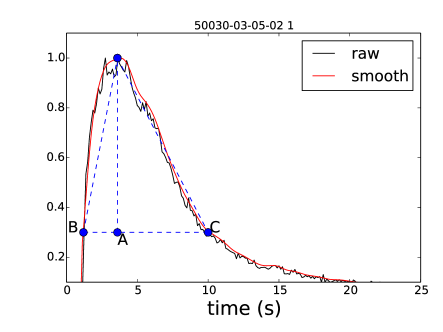
In the Figure 8 we show two burst light curves. The light curves are normalised by the count rate at the peak of the burst. Since it is clear that there are many fluctuations during the bursting time, in order to study the bursts profile we smoothed these light curves; we show two examples of this in Figure 8 with red colour. We choose three points to characterize the burst profile around the peak: Point A indicates the time of the maximum of the burst light curve, and points B and C indicate the time at which the light curve of the burst is at 30% of the maximum during the rise and the decay of the burst, respectively. With these definitions, we call burst duration to the time intervalBC, rise time to the time intervalBA, and decaying time to the time intervalAC.
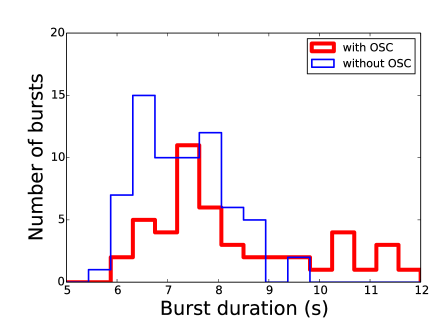
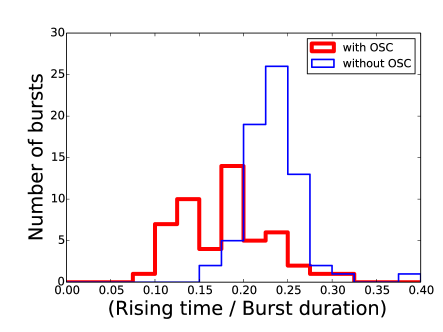
In the upper panel of Figure 9 we show the distribution of the burst durations. From a KS test (KS probability 0.18) we cannot discard the hypothesis that the two types of bursts have the same burst duration. In the lower panel of Figure 9 we show the distribution of the rise time divided by the burst duration for bursts with (red) and without (blue) oscillations in 4U 1728–34. The KS probability that the two samples come from the same parent population is . The distribution of the ratio of rise time to the burst duration of bursts with and without oscillations are significantly different. This indicates that the light-curve profiles of bursts with and without oscillations are significantly different, bursts with oscillations having a more asymmetric light-curve profile than bursts without oscillations.
4 Discussion
Out of the 121 type-I X-ray bursts from the low-mass X-ray binary 4U 172834 observed with RXTE, 73 are photospheric radius expansion (PRE) bursts and 49 show burst oscillations at 363 Hz. The convexity of the light curve during the early phase of a burst is a good predictor of the presence of oscillations in the tail of the burst, regardless of whether the burst shows PRE or not (see lower panel of Figure 7). The distribution of the convexity for bursts with and without oscillations is significantly different (KS probabilities of ). Similar to what we found in 4U 163653 (Zhang et al., 2013), bursts in which the blackbody radius remains more or less constant for 2 seconds or more during the cooling phase show burst oscillations, whereas those bursts in which the blackbody radius changes quickly do not show burst oscillations.
4.1 Bursts on the colour-colour diagram
Using a sample of 394 bursts in 12 sources, Muno et al. (2004) proposed that there is a relation between the presence of burst oscillations and accretion rate onto the NS. On the other hand, Zhang et al. (2011) and Kajava et al. (2014) studied the relation between source accretion state and burst spectral evolution, while Zhang et al. (2013) found a link between burst oscillations and burst spectral evolution in 4U 1636–53. In this paper we found that this kind of relations are much more clear in 4U 1728–34.
Figure 1 shows the position of the source in the CD at the time when an X-ray bursts took place. Bursts with oscillations are located everywhere along the CD, but appear preferentially in the so-called lower branch, when the source is in a soft state (see also Figure 4). The position of the source along the C-like shape in the CD is influenced by the accretion geometry, which itself may change with accretion rate and inferred mass accretion rate is high in this area of the CD (Hasinger & van der Klis, 1989; Méndez et al., 1999). This suggests that the appearance of burst oscillations is correlated with accretion rate and geometry, however it is not possible to determine whether this is a causal relation.
In 4U 1728–34 most of the PRE bursts occur when the inferred mass accretion rate is low, whereas the PRE bursts in 4U 1636–53 preferentially appear when the inferred mass accretion rate is high (Zhang et al., 2011). Considering the bursts spectral properties in 4U 1728–34, 4U 1636–53 and other X-ray bursters (van Straaten et al., 2001; Muno et al., 2004; Galloway et al., 2008; Zhang et al., 2013), the presence of PRE bursts appears to depend upon mass accretion rate onto the NS surface, but the effect is different in different sources. This is consistent with a difference in the chemical composition of the burst fuel in 4U 1636-53 and 4U 1728-34. In sources accreting helium-rich material, radius expansion happens at lower accretion rates, because then the accumulating fuel layer is colder and builds up to a greater thickness before the burst ignites. In sources accreting hydrogen-rich material, radius expansion is seen at higher accretion rates when the bursts are helium-like (with short durations), whereas it is not seen at lower accretion rates when the bursts show evidence of hydrogen (ie. longer durations).
The fact that in 4U 1728–34 bursts with oscillations happen more often in the high/soft state, while PRE burst happen mostly in the low/hard state, suggests that the oscillations and the PRE phenomenon are both correlated with accretion rate and geometry, as proposed by Franco (2001); van Straaten et al. (2001); Muno et al. (2004); however, the presence of bursts with oscillations in the low/hard state in 4U 1728–34 (and 4U 1636–53; Zhang et al., 2013) indicates that oscillations are not only driven by either mass accretion rate or whether the burst shows PRE or not, although mass accretion rate (and perhaps PRE) has an influence on the presence of oscillations.
4.2 X-ray spectral properties and burst oscillations
We find a strong evidence for a link between burst oscillations and the spectral properties during the burst in 4U 1728–34, more specifically between the presence of burst oscillations and the changes in the apparent emission area during the decay of the burst. The left panels of Figure 2a and 2b, and the discussion in section 3.1, show that oscillations in type-I X-ray bursts in 4U 1728–34 are always associated with a blackbody radius that remains more or less constant for at least 28 s. A similar trend has also been found in the LMXB system 4U 1636–53 (Zhang et al., 2013). The changes of the blackbody radius could be due to either changes in the apparent emitting area of the NS during this phase, or to changes in the colour correction factor, .
In the case of changes of the apparent emitting area of the NS, Spitkovsky et al. (2002) and Zhang et al. (2013) suggested that tail oscillations could be due to the spread of a cooling wake, which is formed by vortices during the cooling of the NS atmosphere. In this scenario, the speed of the cooling wake depends upon the latitude at which the burst ignite, since the speed of the cooling front near the equator is higher than that near the poles (Spitkovsky et al., 2002). If the bursts ignite at high latitude on the NS surface, during the burst decay time the front speed of the cooling wake is slow, the emission area changes slowly, and the asymmetric emission during the burst lasts long. These bursts would have oscillations and the blackbody radius remains constant for a while (see the left panels of Figure 2a). If the bursts ignite at low latitude, during the decay time the front speed of the cooling wake is fast, the emission area, and hence the blackbody radius, changes fast, and the asymmetric emission is short lived. These bursts would not show oscillations and the blackbody radius evolves very fast. We note that this interpretation has not been calculated in detail.
We also note that burst oscillations also appear in the rising phase of the bursts (e.g., left pannels of Figure 2b). The mechanism of burst oscillations might be different between the rising and decaying phase. The burst oscillations in the rising phase may be caused by asymmetries due to initially localized nuclear burning that later spreads over the surface of the NS (e.g., Strohmayer et al., 1996; Chakraborty & Bhattacharyya, 2014).
In the case of changes of the in the NS atmosphere, the NS atmosphere model of Suleimanov et al. (2011) suggests that should decrease as the flux decreases during the burst decay. In section 3.2 we analysed the during the burst decay phase assuming a constant emitting NS surface. We found that in the early decay phase, the evolution of in the bursts without oscillations (see the right panels of Figure 3a and 3b) can be qualitatively well-described by the atmosphere models of Suleimanov et al. (2011). On the other hand, bursts with oscillations always show a roughly constant , which disagrees with the atmosphere models. In particular, these are the hard state bursts that Suleimanov et al. (2011) have pointed to as being more reliable for comparison to spectral models, and thus for use in mass-radius constraints.
In the bursts with oscillations, in order to produce asymmetric emission, only part of the NS surface is burning, which contradicts the assumption in Suleimanov et al. (2011) that the emission should come from the whole surface of the NS. 4U 1728–34 is likely a UCXB (Shaposhnikov et al., 2003; Cumming, 2003; Galloway et al., 2008), so all the bursts should ignite in a NS atmosphere with similar chemical composition and have similar curves in the flux diagram. In Figure 5 we show that bursts with a flat flux relation appear preferentially in the soft state. Kajava et al. (2014) found that the X-ray spectrum in the burst decay can not be described by the model of Suleimanov et al. (2011) when the source is in the soft state. Kajava et al. (2014) suggested that in the soft state the small inner radius of the accretion disc and the high mass accretion rate can affect the emission from the NS atmosphere. Our results indicate that the behaviour of in the bursts with oscillations in 4U 1728–34 cannot be explained by the model of Suleimanov et al. (2011).
4.3 X-ray light curve profiles and burst oscillations
The light curve profiles are also different between the bursts with and without oscillations in 4U 1728–34. In the rise phase of the burst, the light curve of bursts with oscillations increases faster than in bursts without oscillations. Around the peak of the burst (e.g. within 50% of the peak flux) the light curve of the bursts without oscillations show smooth and symmetric profiles (see right panel of Figure 8), whereas, in bursts with oscillations the light curves show sharp and asymmetric profiles (see left panel of Figure 8). The shape of the light curve during the rising phase also shows different behaviours in bursts with and without oscillations. The convexity takes only positive values in bursts without oscillations whereas it shows both positive and negative values in burst with oscillations.
The shape, time scale and peak flux of the light curve of a burst can vary substantially depending on factors such as the igination latitude, rotation rate of the NS, the accretion rate and the composition of the accreted material (e.g., Taam et al., 1993; Woosley et al., 2004; Weinberg et al., 2006). There are no simple analytic models that take into account all of the relevant parameterst yet. Maurer & Watts (2008) developped a phenomenological model of the burst rise process and showed that simple measures of the burst morphology can be robust diagnostics of ignition latitude and burning regime.
They simulated burst light curves with ignition at different latitudes on the NS surface, and they found that bursts that ignite near the equator always show positive convexity, whereas bursts that ignite near the poles show either positive or negative convexity values. They also found that the chemical composition of the burning material has a strong influence on convexity, and the rise times increase as the ignition point moves towards the poles.
4U 1728–34 is an UCXB (H-poor donor), and has only helium-rich bursts with short rise times and similar duration (Franco, 2001; van Straaten et al., 2001; Shaposhnikov et al., 2003; Galloway et al., 2008). Therefore, the chemical composition does not have a big influence on the convexity and rise time of the bursts in 4U 1728–34. Simulations from Maurer & Watts (2008) show that the different inclinations and source rotation rate have a very small effect on convexity. So, only the ignition latitude must have a strong influence on the burst properties in 4U 1729–34. This suggests that bursts with oscillations in 4U 1728–34 ignite at high latitudes, whereas bursts without oscillations ignite at low latitudes on the NS surface. This is consistent with the findings of Zhang et al. (2013) in the case of 4U 1636–53.
5 conclusion
We analysed 121 type-I X-ray bursts in the accreting NS LMXB system 4U 1728–34. We found that:
-
•
The rise time and convexity in bursts with and without oscillations are different. Bursts with oscillations have short rise time and both positive and negative convexity values, whereas bursts without oscillations have long rise time and only positive convexity values.
-
•
Around the peak of the burst, the light curves are more asymmetric in bursts with oscillations than in bursts without oscillations.
-
•
In the early decay phase of the bursts, the energy spectrum is different in bursts with and without oscillations. The spectrum can be explained by the NS atmosphere model only in the bursts without oscillations.
-
•
During the cooling phase, bursts in which the blackbody radius remains more or less constant for s show coherent oscillations, whereas bursts in which the blackbody radius changes rapidly show no coherent oscillations.
-
•
Bursts with oscillations ignite at high latitude when mass accretion rate onto the NS surface is high, whereas burst without oscillations ignite at low latitude when mass accretion rate is low.
6 Appendix
| obsid | MJD | SC | HC | IT | PRE | OS | peak flux | Sa | Trise | convexity |
|---|---|---|---|---|---|---|---|---|---|---|
| 10073-01-01-000 | 50128.74881663 | 1.444 | 0.842 | 0.133 | 1 | 1 | 7.00 | 1.90 | 0.500 | 17.24 |
| 10073-01-01-00 | 50128.88223239 | 1.439 | 0.826 | 0.137 | 1 | 1 | 4.33 | 1.95 | 0.375 | 7.60 |
| 10073-01-02-000 | 50129.16474396 | 1.446 | 0.801 | 0.147 | 0 | 0 | 6.38 | 2.02 | 1.375 | 14.33 |
| 10073-01-02-00 | 50129.28569304 | 1.441 | 0.778 | 0.158 | 0 | 1 | 6.62 | 2.10 | 0.375 | 8.27 |
| 10073-01-02-00 | 50129.41724396 | 1.441 | 0.778 | 0.158 | 0 | 1 | 6.59 | 2.10 | 0.250 | 5.64 |
| 10073-01-03-000 | 50129.81060623 | 1.435 | 0.779 | 0.156 | 0 | 1 | 6.32 | 2.10 | 0.625 | 18.34 |
| 10073-01-04-000 | 50131.73050785 | 1.421 | 0.861 | 0.112 | 0 | 1 | 6.55 | 1.87 | 0.625 | 34.97 |
| 10073-01-04-00 | 50131.89509119 | 1.451 | 0.895 | 0.103 | 0 | 0 | 6.15 | 1.76 | 0.750 | 25.50 |
| 10073-01-06-00 | 50135.96476711 | 1.581 | 0.978 | 0.073 | 1 | 0 | 5.61 | 1.43 | 1.250 | 30.74 |
| 10073-01-07-00 | 50137.24061202 | 1.592 | 0.982 | 0.076 | 1 | 0 | 5.52 | 1.41 | 1.375 | 31.08 |
| 10073-01-08-000 | 50137.74437359 | 1.598 | 0.994 | 0.079 | 1 | 0 | 5.45 | 1.38 | 1.250 | 22.99 |
| 10073-01-09-000 | 50138.97027058 | 1.615 | 0.994 | 0.084 | 1 | 0 | 5.59 | 1.35 | 0.875 | 27.87 |
| 20083-01-01-01 | 50710.52293840 | 1.514 | 0.725 | 0.160 | 0 | 1 | 7.24 | 2.49 | 1.500 | 32.40 |
| 20083-01-01-020 | 50711.42286896 | 1.472 | 0.727 | 0.148 | 0 | 1 | 6.67 | 2.41 | 1.250 | 5.11 |
| 20083-01-02-01 | 50712.65664789 | 1.476 | 0.732 | 0.156 | 0 | 1 | 7.21 | 2.43 | 0.500 | 15.43 |
| 20083-01-02-01 | 50712.75776479 | 1.476 | 0.732 | 0.156 | 0 | 1 | 6.73 | 2.43 | 0.625 | 10.93 |
| 20083-01-02-000 | 50713.27982498 | 1.462 | 0.737 | 0.146 | 0 | 1 | 6.83 | 2.39 | 1.375 | 22.17 |
| 20083-01-04-00 | 50717.61406688 | 1.378 | 0.753 | 0.129 | 0 | 1 | 7.44 | 2.16 | 0.875 | 19.16 |
| 20083-01-04-00 | 50717.72907845 | 1.378 | 0.753 | 0.129 | 0 | 1 | 6.32 | 2.16 | 0.250 | 10.74 |
| 20083-01-04-01 | 50718.47167104 | 1.379 | 0.814 | 0.106 | 1 | 1 | 7.18 | 2.01 | 0.375 | 20.93 |
| 20083-01-04-01 | 50718.66260275 | 1.379 | 0.814 | 0.106 | 1 | 1 | 7.02 | 2.01 | 0.375 | 22.41 |
| 30042-03-01-00 | 51086.42292104 | 1.721 | 1.058 | 0.133 | 1 | 0 | 5.70 | 1.08 | 0.875 | 25.72 |
| 30042-03-03-01 | 51110.10594766 | 1.689 | 1.077 | 0.117 | 1 | 0 | 5.64 | 1.07 | 1.000 | 24.71 |
| 30042-03-06-00 | 51118.15833771 | 1.704 | 1.076 | 0.125 | 1 | 0 | 5.76 | 1.06 | 1.500 | 26.25 |
| 30042-03-06-00 | 51118.29117336 | 1.704 | 1.076 | 0.125 | 1 | 0 | 6.06 | 1.06 | 1.250 | 23.04 |
| 30042-03-07-01 | 51119.94659002 | 1.697 | 1.072 | 0.125 | 1 | 0 | 5.90 | 1.07 | 1.000 | 10.57 |
| 30042-03-07-00 | 51120.08506803 | 1.696 | 1.080 | 0.124 | 1 | 0 | 5.93 | 1.07 | 1.500 | 28.06 |
| 30042-03-10-00 | 51127.81510275 | 1.707 | 1.043 | 0.133 | 1 | 0 | 5.88 | 1.14 | 0.500 | 13.40 |
| 30042-03-11-00 | 51128.02614442 | 1.693 | 1.034 | 0.133 | 1 | 0 | 5.60 | 1.18 | 1.000 | 26.63 |
| 30042-03-12-00 | 51128.68105183 | 1.674 | 1.021 | 0.134 | 1 | 0 | 5.90 | 1.23 | 0.500 | 16.79 |
| 30042-03-12-00 | 51128.81400322 | 1.674 | 1.021 | 0.134 | 1 | 0 | 6.12 | 1.23 | 0.750 | 20.02 |
| 30042-03-13-00 | 51129.01389326 | 1.672 | 1.022 | 0.134 | 0 | 0 | 6.42 | 1.23 | 0.875 | 29.16 |
| 30042-03-14-00 | 51133.42397428 | 1.453 | 0.859 | 0.164 | 1 | 0 | 6.71 | 1.84 | 0.250 | 0.00 |
| 30042-03-15-00 | 51133.67302521 | 1.457 | 0.883 | 0.155 | 0 | 0 | 6.31 | 1.78 | 0.375 | 17.85 |
| 30042-03-17-00 | 51134.57236549 | 1.556 | 0.975 | 0.124 | 1 | 1 | 6.49 | 1.47 | 0.250 | 8.79 |
| 30042-03-20-00 | 51196.99073354 | 1.670 | 1.063 | 0.100 | 1 | 0 | 5.82 | 1.13 | 1.375 | 17.00 |
| 40033-06-01-00 | 51198.14346502 | 1.679 | 1.068 | 0.105 | 1 | 0 | 5.49 | 1.11 | 1.000 | 21.20 |
| 40033-06-02-00 | 51200.26718609 | 1.677 | 1.031 | 0.115 | 1 | 0 | 6.09 | 1.20 | 0.875 | 24.86 |
| 40033-06-02-01 | 51201.99242914 | 1.629 | 0.995 | 0.123 | 1 | 1 | 6.23 | 1.34 | 0.875 | 26.11 |
| 40033-06-02-03 | 51204.00120229 | 1.509 | 0.922 | 0.138 | 1 | 0 | 3.68 | 1.65 | 0.750 | 27.00 |
| 40033-06-02-03 | 51204.12994072 | 1.509 | 0.922 | 0.138 | 1 | 1 | 6.96 | 1.65 | 0.375 | 16.00 |
| 40033-06-02-04 | 51205.98997544 | 1.497 | 0.923 | 0.130 | 1 | 0 | 6.50 | 1.65 | 0.375 | 14.14 |
| 40033-06-02-05 | 51206.14071618 | 1.487 | 0.926 | 0.129 | 1 | 1 | 7.08 | 1.66 | 0.250 | 8.48 |
| 40033-06-03-01 | 51208.98528215 | 1.494 | 0.926 | 0.116 | 1 | 0 | 7.75 | 1.65 | 0.750 | 21.48 |
| 40033-06-03-020 | 51209.91810044 | 1.442 | 0.853 | 0.131 | 1 | 1 | 6.83 | 1.87 | 0.250 | 4.02 |
| 40033-06-03-020 | 51210.08248701 | 1.442 | 0.853 | 0.131 | 1 | 1 | 6.94 | 1.87 | 0.250 | 14.21 |
| 40033-06-03-05 | 51213.93852289 | 1.436 | 0.823 | 0.124 | 1 | 1 | 7.19 | 1.95 | 0.250 | 10.13 |
| 40027-06-01-00 | 51236.79212243 | 1.536 | 0.952 | 0.077 | 1 | 0 | 6.00 | 1.55 | 1.000 | 22.08 |
| 40027-06-01-02 | 51237.20253331 | 1.536 | 0.950 | 0.078 | 0 | 0 | 6.53 | 1.56 | 1.125 | 30.75 |
| 40027-06-01-03 | 51238.79158424 | 1.570 | 0.980 | 0.079 | 1 | 0 | 5.90 | 1.44 | 1.375 | 23.95 |
| 40027-06-01-08 | 51240.04664211 | 1.592 | 0.977 | 0.083 | 1 | 0 | 5.91 | 1.42 | 0.750 | 19.92 |
| 40027-08-01-01 | 51359.82659581 | 1.475 | 0.946 | 0.085 | 1 | 0 | 6.42 | 1.62 | 1.250 | 30.84 |
| 40027-08-03-00 | 51369.42190252 | 1.582 | 1.016 | 0.081 | 1 | 0 | 5.66 | 1.34 | 1.000 | 13.63 |
| 40019-03-02-000 | 51409.39851711 | 1.514 | 0.739 | 0.242 | 0 | 1 | 6.51 | 2.53 | 2.375 | 27.45 |
| 40019-03-02-000 | 51409.50654951 | 1.514 | 0.739 | 0.242 | 0 | 1 | 6.02 | 2.53 | 0.500 | -16.71 |
| 40019-03-02-00 | 51409.58388748 | 1.533 | 0.734 | 0.250 | 0 | 1 | 6.39 | 2.54 | 0.375 | 5.54 |
| 40019-03-02-00 | 51409.65764905 | 1.533 | 0.734 | 0.250 | 0 | 1 | 5.71 | 2.54 | 0.500 | -27.08 |
| 40019-03-01-06 | 51443.21822775 | 1.449 | 0.867 | 0.097 | 0 | 0 | 6.95 | 1.83 | 0.375 | 9.25 |
| 50023-01-07-00 | 51628.86897428 | 1.496 | 0.814 | 0.123 | 0 | 0 | 5.92 | 2.70 | 0.750 | 12.11 |
-1
| obsid | MJD | SC | HC | IT | PRE | OS | peak flux | Sa | Trise | convexity |
|---|---|---|---|---|---|---|---|---|---|---|
| 50029-23-02-01 | 51657.20330299 | 1.553 | 0.987 | 0.070 | 1 | 0 | 6.16 | 1.44 | 1.250 | 21.60 |
| 50029-23-02-02 | 51657.67851132 | 1.555 | 0.978 | 0.072 | 0 | 0 | 6.69 | 1.46 | 1.000 | 21.89 |
| 50023-01-21-00 | 51691.71255646 | 1.605 | 1.011 | 0.079 | 1 | 0 | 5.87 | 1.33 | 1.125 | 25.10 |
| 50023-01-22-00 | 51695.33975553 | 1.596 | 0.998 | 0.084 | 1 | 0 | 5.62 | 1.37 | 1.375 | 24.12 |
| 50023-01-23-00 | 51697.47930414 | 1.588 | 1.006 | 0.085 | 1 | 0 | 5.54 | 1.35 | 1.000 | 22.84 |
| 50030-03-02-000 | 51942.94612127 | 1.380 | 0.802 | 0.060 | 1 | 0 | 6.26 | 2.04 | 0.500 | 23.77 |
| 50030-03-03-02 | 51949.12603447 | 1.525 | 1.024 | 0.050 | 1 | 0 | 5.66 | 1.41 | 1.375 | 29.22 |
| 50030-03-04-00 | 52007.61316410 | 1.433 | 0.866 | 0.124 | 1 | 1 | 6.91 | 1.85 | 1.125 | 28.34 |
| 50030-03-04-02 | 52008.08734234 | 1.394 | 0.803 | 0.142 | 1 | 1 | 7.08 | 2.03 | 0.500 | 15.23 |
| 50030-03-05-03 | 52024.43797313 | 1.626 | 1.059 | 0.079 | 1 | 0 | 5.69 | 1.20 | 1.125 | 17.63 |
| 50030-03-05-02 | 52024.69547313 | 1.643 | 1.057 | 0.079 | 1 | 0 | 5.27 | 1.18 | 1.375 | 23.81 |
| 60029-02-01-00 | 52056.40803678 | 1.516 | 0.860 | 0.137 | 1 | 0 | 5.95 | 1.79 | 1.125 | 18.50 |
| 50030-03-06-00 | 52112.25357498 | 1.481 | 0.927 | 0.050 | 1 | 0 | 5.51 | 1.66 | 1.625 | 24.46 |
| 50030-03-06-02 | 52112.58463400 | 1.475 | 0.920 | 0.052 | 0 | 0 | 6.01 | 1.68 | 1.000 | 16.85 |
| 50030-03-08-02 | 52200.14829720 | 1.392 | 0.749 | 0.087 | 0 | 1 | 6.86 | 2.17 | 0.250 | 1.45 |
| 50030-03-08-00 | 52200.39319882 | 1.413 | 0.743 | 0.090 | 0 | 1 | 6.82 | 2.21 | 0.500 | 15.00 |
| 50030-03-09-01 | 52209.99568725 | 1.441 | 0.713 | 0.091 | 0 | 1 | 7.61 | 2.33 | 1.500 | 18.86 |
| 70028-01-01-070 | 52336.21127174 | 1.473 | 0.919 | 0.093 | 1 | 0 | 6.74 | 1.69 | 0.875 | 22.83 |
| 70028-01-01-070 | 52336.35301942 | 1.473 | 0.919 | 0.093 | 0 | 0 | 6.39 | 1.69 | 0.875 | 16.87 |
| 70028-01-01-070 | 52336.49959928 | 1.473 | 0.919 | 0.093 | 0 | 0 | 6.40 | 1.69 | 0.875 | 27.85 |
| 70028-01-01-02 | 52337.09745229 | 1.481 | 0.914 | 0.090 | 1 | 0 | 6.55 | 1.69 | 0.750 | 29.73 |
| 70028-01-01-00 | 52337.94569303 | 1.464 | 0.899 | 0.090 | 1 | 0 | 6.35 | 1.74 | 0.750 | 30.13 |
| 70028-01-01-10 | 52338.26090137 | 1.487 | 0.913 | 0.087 | 0 | 0 | 6.48 | 1.69 | 0.625 | 12.28 |
| 70028-01-01-12 | 52338.41596502 | 1.501 | 0.943 | 0.084 | 1 | 0 | 6.08 | 1.60 | 0.625 | 26.34 |
| 90406-01-01-00 | 53076.07050785 | 1.376 | 0.761 | 0.212 | 0 | 1 | 6.14 | 2.13 | 0.500 | -1.54 |
| 91023-01-02-00 | 53465.26385854 | 1.364 | 0.763 | 0.189 | 0 | 1 | 7.13 | 2.12 | 0.375 | -0.75 |
| 92023-03-03-00 | 53802.03840137 | 1.492 | 0.959 | 0.097 | 1 | 0 | 6.28 | 1.58 | 0.750 | 25.20 |
| 92023-03-23-00 | 53842.51789211 | 1.372 | 0.766 | 0.142 | 0 | 1 | 6.43 | 2.12 | 0.625 | -8.40 |
| 92023-03-35-00 | 53866.02735970 | 1.488 | 0.973 | 0.096 | 1 | 0 | 5.87 | 1.55 | 0.750 | 24.25 |
| 92023-03-41-00 | 53878.55446039 | 1.372 | 0.769 | 0.176 | 1 | 1 | 6.85 | 2.11 | 0.250 | 7.33 |
| 92023-03-52-00 | 53900.74835507 | 1.427 | 0.735 | 0.163 | 0 | 1 | 6.72 | 2.26 | 1.125 | 30.51 |
| 92023-03-76-00 | 53948.69922313 | 1.379 | 0.786 | 0.188 | 0 | 1 | 6.99 | 2.07 | 1.750 | 22.11 |
| 92023-03-83-00 | 53962.32031109 | 1.360 | 0.741 | 0.145 | 0 | 1 | 6.48 | 2.17 | 0.375 | -6.70 |
| 92023-03-87-01 | 53970.37473817 | 1.377 | 0.789 | 0.138 | 0 | 1 | 7.24 | 2.07 | 0.875 | 13.34 |
| 92023-03-95-00 | 53986.15183308 | 1.421 | 0.807 | 0.183 | 0 | 1 | 6.55 | 2.01 | 0.875 | -2.07 |
| 92023-03-02-10 | 53996.50301363 | 1.576 | 1.044 | 0.099 | 1 | 0 | 6.13 | 1.28 | 1.000 | 25.42 |
| 92023-03-06-10 | 54004.54995808 | 1.447 | 0.903 | 0.186 | 1 | 0 | 7.10 | 1.75 | 0.375 | 16.81 |
| 92023-03-08-10 | 54008.62108655 | 1.392 | 0.772 | 0.236 | 0 | 0 | 6.85 | 2.11 | 0.875 | 19.45 |
| 92023-03-10-10 | 54012.41419998 | 1.561 | 0.793 | 0.286 | 0 | 1 | 6.39 | 2.71 | 0.750 | 24.97 |
| 92023-03-16-10 | 54024.20448354 | 1.374 | 0.839 | 0.116 | 1 | 1 | 7.17 | 1.95 | 0.375 | 14.29 |
| 92023-03-20-10 | 54032.06032845 | 1.362 | 0.767 | 0.154 | 0 | 0 | 7.42 | 2.12 | 0.500 | 4.97 |
| 92023-03-27-10 | 54046.46863863 | 1.406 | 0.846 | 0.195 | 1 | 0 | 7.09 | 1.91 | 0.625 | 8.62 |
| 92023-03-34-10 | 54120.25891063 | 1.501 | 0.970 | 0.072 | 1 | 0 | 5.93 | 1.55 | 0.875 | 17.72 |
| 92023-03-44-10 | 54140.74365600 | 1.546 | 0.987 | 0.111 | 1 | 0 | 6.44 | 1.45 | 0.750 | 21.67 |
| 92023-03-44-00 | 54166.21890484 | 1.610 | 1.048 | 0.093 | 1 | 0 | 5.91 | 1.24 | 1.250 | 25.71 |
| 92023-03-64-00 | 54212.89935623 | 1.520 | 0.732 | 0.208 | 0 | 1 | 6.59 | 2.52 | 0.500 | -14.72 |
| 92023-03-64-10 | 54214.99848817 | 1.329 | 0.755 | 0.119 | 0 | 1 | 6.60 | 2.13 | 0.750 | 21.76 |
| 92023-03-70-00 | 54226.78303678 | 1.602 | 1.004 | 0.103 | 1 | 1 | 5.82 | 1.34 | 1.000 | 29.37 |
| 92023-03-71-00 | 54228.07044998 | 1.550 | 0.975 | 0.119 | 1 | 0 | 6.19 | 1.47 | 0.750 | 20.82 |
| 92023-03-73-00 | 54230.48778215 | 1.597 | 0.999 | 0.126 | 1 | 0 | 6.34 | 1.37 | 0.500 | 18.05 |
| 92023-03-65-10 | 54232.71368493 | 1.649 | 1.038 | 0.127 | 0 | 0 | 6.04 | 1.22 | 1.000 | 23.96 |
| 92023-03-66-10 | 54234.89705877 | 1.662 | 1.050 | 0.129 | 1 | 0 | 6.00 | 1.18 | 0.875 | 16.59 |
| 92023-03-73-10 | 54248.43857498 | 1.367 | 0.765 | 0.172 | 0 | 1 | 6.22 | 2.12 | 0.500 | -15.38 |
| 92023-03-76-10 | 54254.84918840 | 1.507 | 0.733 | 0.216 | 0 | 1 | 7.39 | 2.50 | 1.375 | 42.73 |
| 92023-03-83-10 | 54268.40871965 | 1.500 | 0.884 | 0.131 | 1 | 0 | 6.14 | 1.75 | 1.250 | 27.70 |
| 95337-01-02-000 | 55473.92615600 | 1.425 | 0.715 | 0.087 | 1 | 1 | 7.57 | 2.29 | 0.500 | 28.74 |
| 95337-01-02-000 | 55474.17558308 | 1.425 | 0.715 | 0.087 | 0 | 1 | 6.75 | 2.29 | 0.250 | 19.04 |
| 95337-01-03-000 | 55474.92021850 | 1.403 | 0.801 | 0.067 | 0 | 0 | 7.02 | 2.03 | 0.375 | 7.67 |
| 96322-01-05-02 | 55840.95671155 | 1.586 | 1.022 | 0.092 | 1 | 0 | 5.93 | 1.33 | 0.750 | 22.59 |
| 96322-01-05-000 | 55841.14026479 | 1.615 | 1.033 | 0.093 | 1 | 0 | 5.86 | 1.27 | 1.000 | 31.31 |
| 96322-01-05-000 | 55841.30065252 | 1.615 | 1.033 | 0.093 | 1 | 0 | 5.49 | 1.27 | 1.000 | 30.74 |
| 96322-01-05-00 | 55841.47716873 | 1.633 | 1.045 | 0.093 | 1 | 0 | 5.84 | 1.22 | 0.875 | 17.19 |
Acknowledgements
This research has made use of data obtained from the High Energy Astrophysics Science Archive Research Center (HEASARC), provided by NASA’s Goddard Space Flight Center. We thank Duncan Galloway and Yuri Cavecchi for useful comments and discussions. G.Z., M.Z. and A.C. are members of an International Team in Space Science on thermonuclear bursts sponsored by the International Space Science Institute in Bern, Switzerland. A.C. is supported by an NSERC Discovery Grant.
References
- Arnaud (1996) Arnaud K. A., 1996, in G. H. Jacoby & J. Barnes ed., Astronomical Data Analysis Software and Systems V Vol. 101 of Astronomical Society of the Pacific Conference Series, XSPEC: The First Ten Years. p. 17
- Basinska et al. (1984) Basinska E. M., Lewin W. H. G., Sztajno M., Cominsky L. R., Marshall F. J., 1984, ApJ, 281, 337
- Berger et al. (1996) Berger M., van der Klis M., van Paradijs J., Lewin W. H. G., Lamb F., Vaughan B., Kuulkers E., Augusteijn T., Zhang W., Marshall F. E., Swank J. H., Lapidus I., Lochner J. C., Strohmayer T. E., 1996, ApJ, 469, L13
- Bildsten (1995) Bildsten L., 1995, ApJ, 438, 852
- Chakrabarty et al. (2003) Chakrabarty D., Morgan E. H., Muno M. P., Galloway D. K., Wijnands R., van der Klis M., Markwardt C. B., 2003, Nature, 424, 42
- Chakraborty & Bhattacharyya (2014) Chakraborty M., Bhattacharyya S., 2014, ApJ, 792, 4
- Cumming (2003) Cumming A., 2003, ApJ, 595, 1077
- D’Aí et al. (2006) D’Aí A., di Salvo T., Iaria R., Méndez M., Burderi L., Lavagetto G., Lewin W. H. G., Robba N. R., Stella L., van der Klis M., 2006, A&A, 448, 817
- Di Salvo et al. (2000) Di Salvo T., Iaria R., Burderi L., Robba N. R., 2000, ApJ, 542, 1034
- Forman et al. (1976) Forman W., Tananbaum H., Jones C., 1976, ApJ, 206, L29
- Franco (2001) Franco L. M., 2001, ApJ, 554, 340
- Fryxell & Woosley (1982) Fryxell B. A., Woosley S. E., 1982, ApJ, 261, 332
- Galloway et al. (2008) Galloway D. K., Muno M. P., Hartman J. M., Psaltis D., Chakrabarty D., 2008, ApJS, 179, 360
- García et al. (2013) García F., Zhang G., Méndez M., 2013, MNRAS, 429, 3266
- Hasinger & van der Klis (1989) Hasinger G., van der Klis M., 1989, A&A, 225, 79
- Jahoda et al. (2006) Jahoda K., Markwardt C. B., Radeva Y., Rots A. H., Stark M. J., Swank J. H., Strohmayer T. E., Zhang W., 2006, ApJS, 163, 401
- Jahoda et al. (1996) Jahoda K., Swank J. H., Giles A. B., Stark M. J., Strohmayer T., Zhang W.; Morgan E. H., 1996, SPIE, 2808, 59
- Kajava et al. (2014) Kajava J. J. E., Nättilä J., Latvala O.-M., Pursiainen M., Poutanen J., Suleimanov V. F., Revnivtsev M. G., Kuulkers E., Galloway D. K., 2014, ArXiv e-prints
- Kuulkers et al. (2002) Kuulkers E., Homan J., van der Klis M., Lewin W. H. G., Méndez M., 2002, A&A, 382, L947
- Lewin et al. (1993) Lewin W. H. G., van Paradijs J., Taam R. E., 1993, Space Sci. Rev., 62, 223
- Maurer & Watts (2008) Maurer I., Watts A. L., 2008, MNRAS, 383, L387
- Méndez et al. (1999) Méndez M., van der Klis M., Ford E. C., Wijnands R., van Paradijs J., 1999, ApJ, 511, L49
- Muno et al. (2001) Muno M. P., Chakrabarty D., Galloway D. K., Savov P., 2001, ApJ, 553, L157
- Muno et al. (2004) Muno M. P., Galloway D. K., Chakrabarty D., 2004, ApJ, 608, 930
- Shaposhnikov et al. (2003) Shaposhnikov N., Titarchuk L., Haberl F., 2003, ApJ, 593, L35
- Spitkovsky et al. (2002) Spitkovsky A., Levin Y., Ushomirsky G., 2002, ApJ, 566, 1018
- Strohmayer & Bildsten (2003) Strohmayer T., Bildsten L., 2003, ArXiv Astrophysics e-prints
- Strohmayer & Markwardt (1999) Strohmayer T. E., Markwardt C. B., 1999, ApJ, 516, L81
- Strohmayer et al. (1997) Strohmayer T. E., Zhang W., Swank J. H., 1997, ApJ, 487, L77
- Strohmayer et al. (1996) Strohmayer T. E., Zhang W., Swank J. H., Smale A., Titarchuk L., Day C., Lee U., 1996, ApJ, 469, L9
- Suleimanov et al. (2011) Suleimanov V., Poutanen J., Werner K., 2011, A&A, 527, A139
- Taam et al. (1993) Taam R. E., Woosley S. E., Weaver T. A., Lamb D. Q., 1993, ApJ, 413, 324
- van Paradijs (1978) van Paradijs J., 1978, Nature, 274, 650
- van Paradijs (1982) van Paradijs J., 1982, A&A, 107, 51
- van Straaten et al. (2002) van Straaten S., van der Klis M., di Salvo T., Belloni T., 2002, ApJ, 568, 912
- van Straaten et al. (2001) van Straaten S., van der Klis M., Kuulkers E., Méndez M., 2001, ApJ, 551, 907
- Weinberg et al. (2006) Weinberg N. N., Bildsten L., Schatz H., 2006, ApJ, 639, 1018
- Woosley et al. (2004) Woosley S. E., Heger A., Cumming A., Hoffman R. D., Pruet J., Rauscher T., Fisker J. L., Schatz H., Brown B. A., Wiescher M., 2004, ApJS, 151, 75
- Zhang et al. (2011) Zhang G., Méndez M., Altamirano D., 2011, MNRAS, 413, 1913
- Zhang et al. (2013) Zhang G., Méndez M., Belloni T. M., Homan J., 2013, MNRAS, 436, 2276