M dwarfs and the fraction of high carbon-to-oxygen stars in the solar neighbourhood
Abstract
We investigate the frequency of high carbon-to-oxygen (C/O ) M dwarf stars in the solar neighbourhood. Using synthetic spectra, we find that such M dwarfs would have weaker TiO bands relative to hydride features. Similar weakening has already been detected in M-subdwarf (sdM) stars. By comparing to existing spectroscopic surveys of nearby stars, we show that less than one percent of nearby stars have high carbon-to-oxygen ratios. This limit does not include stars with C/O, [m/H], and [C/Fe], which we predict to have low-resolution optical spectra similar to solar metallicity M dwarfs.
keywords:
stars: low-mass, stars: abundances, stars: carbon1 Introduction
The carbon-to-oxygen ratio plays a key role in chemistry at low temperatures. In the Sun, there are approximately two oxygen atoms for every carbon atom (Grevesse et al., 2005; Asplund et al., 2009; Caffau et al., 2010), but the measurement of carbon and oxygen abundances remains difficult in the Sun and in other stars. There has been considerable interest in the existence of high carbon-to-oxygen ratio planets (Kuchner & Seager, 2005; Madhusudhan, 2012; Moses et al., 2013), which would form more easily if carbon is enhanced relative to oxygen in the original nebula, and hence host star. Even if carbon atoms do not outnumber oxygen atoms, the mineralogy of planets formed from C/O gas will be distinct from siliicate-dominated planets (Bond et al., 2010).
Some recent determinations of the carbon-to-oxygen ratio in G dwarfs find that of nearby stars have C/O (Bond et al., 2010; Delgado Mena et al., 2010; Petigura & Marcy, 2011) and have C/O , although it should be noted that some of these have C/O for the Sun rather than the more recent C/O, and therefore those reported C/O ratios are shifted towards higher values. Fortney (2012) has suggested that the frequency of carbon-rich solar-type stars in these studies are over-estimated, pointing to the difficulty of measuring oxygen and the low observed frequency of dwarf carbon stars. The latter is a significant constraint on the existence of low-mass stars with C/O. Most of the oxygen in the atmospheres of cool (K) stars would be locked up in CO, and the emergent spectra would be dominated by carbon molecules instead of the usual oxygen molecules (TiO, H2O). As a result, they would not be classified as M dwarfs even in low-resolution optical spectra. Fortney (2012) concludes that only 10% of stars have C/O and % have C/O, and cautions that this is likely an overestimate. Nissen (2013) measures 33 G dwarfs using high resolution spectra including a different oxygen line, and concludes that the claims of high C/O are “spurious.” On the other hand,Teske et al. (2013) present a case study of the 55 Cnc (G8V) planetary system and conclude that C/O .
In this study, we investigate the possibility that of M dwarfs have C/O. In Section 2, we show that high carbon-to-oxygen ratios produce dramatic effects on synthetic spectra that would easily be detected at low spectral resolution. In Section 3, we use this result to show that a high C/O ratio is very rare () amongst solar neighbourhood M dwarfs. We discuss our results in Section 4.
2 Model Results
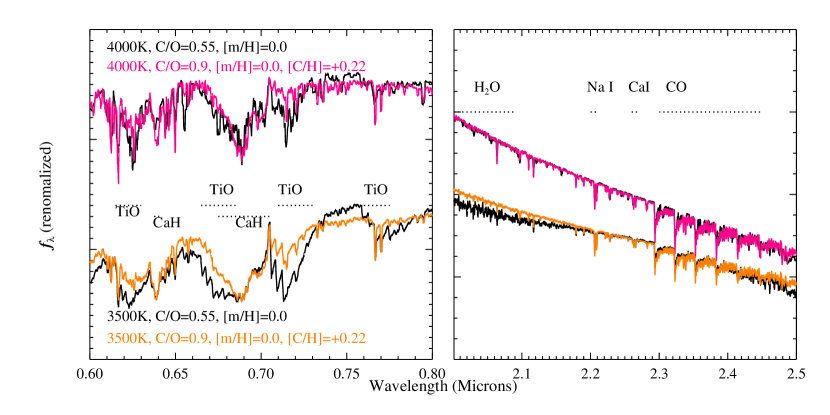
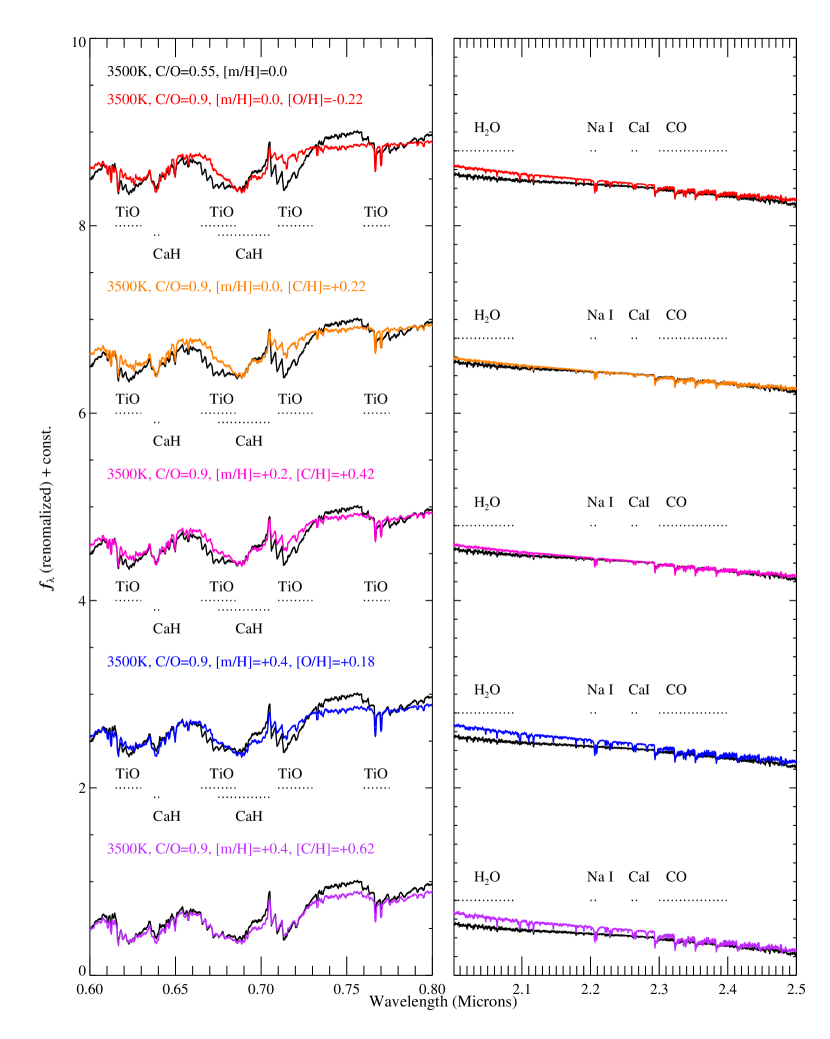
M dwarf spectra are dominated by simple molecules, making them sensitive to carbon/oxygen chemistry. Indeed, Allard et al. (2012, 2013) have shown that the new, lower solar oxygen abundance (Asplund et al., 2009) improves the agreement between synthetic and observed spectra of typical disk M dwarfs. Tsuji & Nakajima (2014) discuss the measurement of [C/Fe] in M dwarfs. We are interested in the possibility of a spread in the carbon-to-oxygen ratio in nearby disk stars, and particularly in the fraction of carbon-rich (C/O ) stars. Synthetic spectra were computed using the PHOENIX code, which has a long history of successful applications to M dwarf spectra (Hauschildt et al., 1999). Our version is very close to the code used for the model library presented by Husser et al. (2013). The carbon-rich models have less oxygen or additional carbon such that the carbon-to-oxygen ratio is 0.9. Figure 1 shows the results for 4000K and 3500K models. Because many of the G dwarfs with reported high C/O ratio also have higher than average overall metallicity (see the Hinkel et al. 2014 compilation), we also computed metal-rich models in which all metals are increased to [m/H] or [m/H], and then additional carbon is added, or oxygen is removed, to make C/O. High metallicity and high C/O G dwarfs typically have lower oxygen than other metals, so the [m/H], [O/H] are more relevant than the [m/H], [C/H] models. These 3500K models are shown in Figure 2. The models are internally consistent, with the model structure iterated to be consistent with the C/O ratio.
Although real stars will have a variety of abundance anomalies, these simple models are sufficient to demonstrate the importance of enhanced carbon. As one would expect, the carbon-rich models have a stronger CO band head at 2.3 microns and weaker H2O bands, because more of the oxygen can be locked up in CO by carbon. Rojas-Ayala et al. (2010) showed that metal-rich, scaled solar abundance stars have enhanced Na and Ca atomic lines in the K-band, and we observe the same trend in our metal-rich models. The effects in the red part of the spectrum are even more dramatic. TiO is much weakened while the depth of other molecular features, particularly those due to CaH, are practically unchanged. Even in low-resolution spectra, the changes in the TiO bands at 0.66-0.68 m and 0.71-0.72 m should be very noticeable. The effect is strongest when oxygen is reduced, but even in the high metallicity models with enhanced carbon the hydrides are considerably stronger relative to TiO. However, for the very highest metallicities ([m/H]), the effect is strong only for the reduced oxygen ([O/H], [C/H]) model. For [m/H] with enhanced carbon ([O/H], [C/H]), the changes are subtle and probably not obvious at low resolution, but this composition is probably not realistic. In the Hypatia catalog (Hinkel et al., 2014), 48% of the stars with C/O have [Fe/H] and [O/Fe], but only 0.4% of stars with C/O have [Fe/H] and [C/Fe].
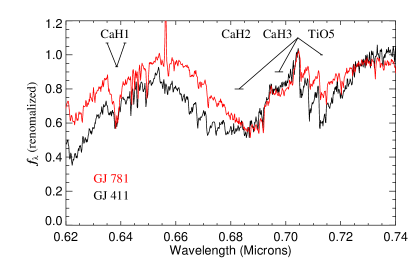
Qualitatively, in the optical these differences from solar-metallicity are similar to those seen in metal-poor stars, particularly the sdM class (Gizis, 1997) of M subdwarfs. Figure 3 compares a typical disk M dwarf, the M2 V standard GJ 411, with the sdM1.5 GJ 781. The TiO is weaker relative to the CaH, with an offset similar to that predicted for our carbon-rich models. We can therefore leverage the existing studies of the space density of optically-classified M dwarfs and M subdwarfs to constrain the fraction of M dwarfs that may be carbon rich.
3 Observational Constraints
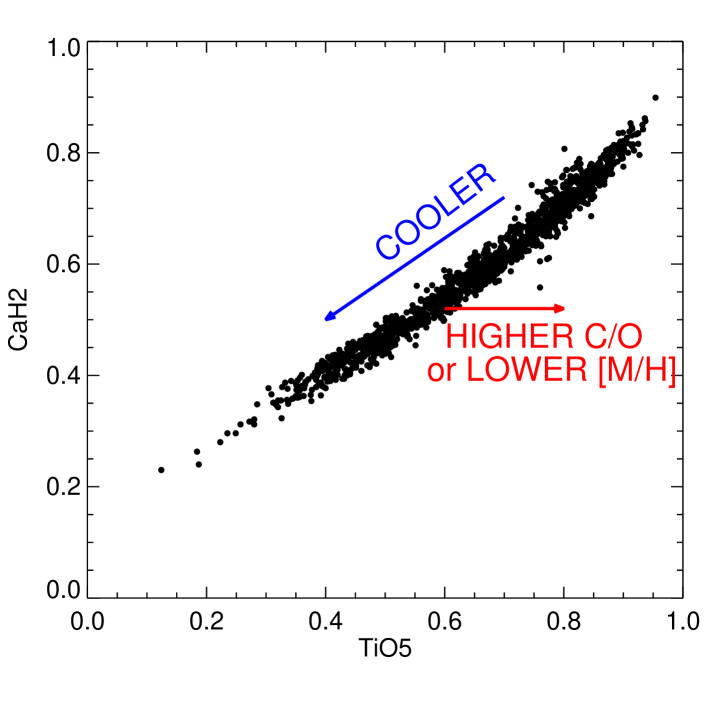
Band indices measuring the TiO and CaH feature have been the basis of modern M subdwarf classification systems (Gizis, 1997; Lépine et al., 2007) and have been used by many different groups, though Jao et al. (2008) have criticized the method for also being sensitive to surface gravity. The TiO5 index measures the feature at 0.704-0.714 m and the CaH2 index measures the m feature (Reid et al., 1995), with smaller values indicating more absorption. The parameter uses these indices to construct a metallicity indicator independent of temperature (Lépine et al., 2007). The carbon-rich models shown in Figure 2 predicted a numerically larger TiO5 index at a given CaH2 (or , which is less easily measured). This would also be characteristic of a moderately metal-poor M subdwarf (the sdM class), and would appear as a small parameter in the system. We do not consider the models accurate enough to precisely compare values, but we can use the observed frequency of M dwarfs/subdwarfs with weak TiO to set limits on the fraction of carbon-rich M dwarfs; that is, we assume that the qualitative model result is correct. We approximate by computing the band indices for each model in Figure 2, adopting TiO5⊙ from the solar metallicity model, so that . All the models have approximately the same CaH2 and CaH3 indices, but TiO5 has larger values, leading to for each model, except the metal-rich, carbon-enhanced model which has . The exact values should be viewed with caution, but the trend is clear.
Most important for our purposes is the complete, well-defined spectroscopic survey of the 1,405 brightest () northern hemisphere M dwarfs (Lépine et al., 2013), which provides TiO5, CaH2, and (Figure 4). The brightest sdM star in that sample is GJ 781. GJ 781 has a high space velocity and lies in the subdwarf region of the H-R diagram (Gizis, 1997); it has an unseen white dwarf companion (Gizis, 1998) and a metal-poor T8 brown dwarf companion (Mace et al., 2013). Another small parameter star is LSPM J2319+7900S. This star is a common proper motion companion to HD 220140 (Gould & Chanamé, 2004), which is a mildly metal-poor G dwarf (, , Casagrande et al. 2011). Overall, 29 of 1399 objects have , suggesting that only 2% of this sample could be high C/O ratio M dwarfs, but many (if not all) are metal-poor. A more heterogenous, and partially overlapping, sample is the two thousand late-K and M dwarfs within 25 parsecs observed by the PMSU survey (Reid et al., 1995; Hawley et al., 1996), which approximates a volume-limited sample. Of these stars, less than one percent show the sdM type (including Kapteyn’s Star, GJ 191), and these are consistent with the expected numbers of kinematics of the metal-poor (thick-disk/halo) population. Many of these objects were studied by Woolf et al. (2009), who measured Fe and Ti atomic lines to demonstrate that the sdM’s are metal-poor; Neves et al. (2014) also confirm GJ 191 and other sdM stars are metal poor. (GJ 191 is also the only M subdwarf within the the nearest one hundred star systems (www.recons.org; see Henry et al. 2006). A third important sample is the SDSS stars with spectroscopy, although some subdwarfs were deliberately targeted and the sample includes color selections that may be biased for or against subdwarfs. West et al. (2004) noted 60 SDSS M subdwarfs of all types compared to M dwarfs. West et al. (2011) identified spectroscopically confirmed M dwarfs in SDSS data, of which only are M subdwarfs even including more extreme ones (Bochanski et al., 2013). We take the low percentage of sdM’s in these samples to support the magnitude-limited and volume-limited samples. Bochanski et al. (2013)’s statistical parallax analysis showed that the SDSS sdM have kinematics associated with the thick disk and inner halo. Savcheva et al. (2014) have expanded the sample of the SDSS subdwarfs but reach similar conclusions. It is notable that X-ray or UV-selected samples of M dwarfs (Fleming, 1998; Riaz et al., 2006; Shkolnik et al., 2011) do not select many sdMs, again consistent with the old, metal-poor interpretation and not with a young, high C/O population. Proper-motion samples such as those of Lépine et al. (2007) and Boyd et al. (2011) do show a much higher percentage (%) of M subdwarfs, but this is due to the bias towards the inclusion of high-velocity halo stars (Schmidt, 1975). To be sure, all available samples are potentially biased, and a detailed accounting of selection effects and the (unknown) relative brightness of high C/O M dwarfs compared to ordinary M dwarfs would be needed for a precise percentage, but all available evidence shows that than less than 2% of M dwarfs could possibly be high C/O even if all sdM’s are such. Conservatively estimating at least half of sdM are metal-poor, we conclude that less than 1% of local M dwarfs have C/O. However, we caution that if high metallicity, carbon enhanced stars exist, they would not be included in these limits.
4 Discussion
Our model spectra show that a high carbon-to-oxygen ratio produces dramatic effects in the optical spectra of M dwarfs. While sdM stars with weak TiO relative to CaH which appear similar to the high C/O models are known in the solar neighbourhood, the vast majority of them are associated with the high-velocity, metal-poor population. M dwarfs with C/O and either [m/H] or [m/H] and [O/Fe] are apparently rare, , and certainly not 10% of the local population. However, we can place no limits on metal-rich, carbon-enhanced M dwarfs with C/O, [m/H], and [C/Fe], but these objects are very rare in the G dwarf surveys. M dwarfs and G dwarfs result from the same star formation events, so there no obvious reason why G dwarf compositions would be dramatically different than that of M dwarfs. Our results support the view (Fortney, 2012; Nissen, 2013) that the percentage of high C/O G dwarfs was greatly overestimated.
Although not a significant population, some high C/O M dwarfs may exist, and would be of great interest for studies of stellar and exoplanet properties. Our work suggests these objects will appear as sdM’s with disk-like kinematics. We cannot point to any definitive examples, but Lépine et al. (2007) note that some of their sdM’s have disk-like kinematics, although they believe these were misclassified due to low signal-to-noise. The new large sample of SDSS sdM’s (Savcheva et al., 2014) with spectroscopy, including chromospheric age indicators, and kinematics may be the most promising avenue to demonstrate whether or not these stars exist. Some variation in C/O must exist, and smaller variations in C/O may contribute to scatter in the CaH/TiO indices relative to other metallicity indicators discussed by Rojas-Ayala et al. (2012). Future work should also explore the variation of other elements, such as Ti, which might also affect M dwarf spectra.
Acknowledgments
We thank the anonymous referee for very helpful comments that improved this paper. JEG acknowledges the Annie Jump Cannon fund at the University of Delaware. PHH was supported in part by DFG grants GrK 1351 and SFB 676 C5. The calculations presented here were performed partially at the Höchstleistungs Rechenzentrum Nord (HLRN) and at the National Energy Research Supercomputer Center (NERSC), which is supported by the Office of Science of the U.S. Department of Energy under Contract No. DE-AC03-76SF00098. PHH gratefully acknowledges the Gauss Centre for Supercomputing (GCS) for providing computing time through the John von Neumann Institute for Computing (NIC) on the GCS share of the supercomputer JUQUEEN at Jülich Supercomputing Centre (JSC). GCS is the alliance of the three national supercomputing centres HLRS (Universität Stuttgart), JSC (Forschungszentrum Jülich), and LRZ (Bayerische Akademie der Wissenschaften), funded by the German Federal Ministry of Education and Research (BMBF) and the German State Ministries for Research of Baden-Württemberg (MWK), Bayern (StMWFK) and Nordrhein-Westfalen (MIWF).
References
- Allard et al. (2012) Allard F., Homeier D., Freytag B., 2012, Royal Society of London Philosophical Transactions Series A, 370, 2765
- Allard et al. (2013) Allard F., Homeier D., Freytag B., Schaffenberger W., Rajpurohit A. S., 2013, Memorie della Societa Astronomica Italiana Supplementi, 24, 128
- Asplund et al. (2009) Asplund M., Grevesse N., Sauval A. J., Scott P., 2009, ARAA, 47, 481
- Bochanski et al. (2013) Bochanski J. J., Savcheva A., West A. A., Hawley S. L., 2013, AJ, 145, 40
- Bond et al. (2010) Bond J. C., O’Brien D. P., Lauretta D. S., 2010, ApJ, 715, 1050
- Boyd et al. (2011) Boyd M. R., Henry T. J., Jao W.-C., Subasavage J. P., Hambly N. C., 2011, AJ, 142, 92
- Caffau et al. (2010) Caffau E., Ludwig H.-G., Bonifacio P., Faraggiana R., Steffen M., Freytag B., Kamp I., Ayres T. R., 2010, A&A, 514, A92
- Casagrande et al. (2011) Casagrande L., Schönrich R., Asplund M., Cassisi S., Ramírez I., Meléndez J., Bensby T., Feltzing S., 2011, A&A, 530, A138
- Delgado Mena et al. (2010) Delgado Mena E., Israelian G., González Hernández J. I., Bond J. C., Santos N. C., Udry S., Mayor M., 2010, ApJ, 725, 2349
- Fleming (1998) Fleming T. A., 1998, ApJ, 504, 461
- Fortney (2012) Fortney J. J., 2012, ApJ Letters, 747, L27
- Gizis (1997) Gizis J. E., 1997, AJ, 113, 806
- Gizis (1998) Gizis J. E., 1998, AJ, 115, 2053
- Gould & Chanamé (2004) Gould A., Chanamé J., 2004, ApJ, 150, 455
- Grevesse et al. (2005) Grevesse N., Asplund M., Sauval A. J., 2005, in Alecian G., Richard O., Vauclair S., eds, EAS Publications Series Vol. 17 of EAS Publications Series, The New Solar Chemical Composition. pp 21–30
- Hauschildt et al. (1999) Hauschildt P. H., Allard F., Baron E., 1999, ApJ, 512, 377
- Hawley et al. (1996) Hawley S. L., Gizis J. E., Reid I. N., 1996, AJ, 112, 2799
- Henry et al. (2006) Henry T. J., Jao W., Subasavage J. P., Beaulieu T. D., Ianna P. A., Costa E., Méndez R. A., 2006, AJ, 132, 2360
- Hinkel et al. (2014) Hinkel N. R., Timmes F. X., Young P. A., Pagano M. D., Turnbull M. C., 2014, AJ, 148, 54
- Husser et al. (2013) Husser T.-O., Wende-von Berg S., Dreizler S., Homeier D., Reiners A., Barman T., Hauschildt P. H., 2013, A&A, 553, A6
- Jao et al. (2008) Jao W., Henry T. J., Beaulieu T. D., Subasavage J. P., 2008, AJ, 136, 840
- Kuchner & Seager (2005) Kuchner M. J., Seager S., 2005, ArXiv astro-ph/0504214
- Lépine et al. (2013) Lépine S., Hilton E. J., Mann A. W., Wilde M., Rojas-Ayala B., Cruz K. L., Gaidos E., 2013, AJ, 145, 102
- Lépine et al. (2007) Lépine S., Rich R. M., Shara M. M., 2007, ApJ, 669, 1235
- Mace et al. (2013) Mace G. N., Kirkpatrick J. D., Cushing M. C., Gelino C. R., McLean I. S., Logsdon S. E., Wright E. L., Skrutskie M. F., Beichman C. A., Eisenhardt P. R., Kulas K. R., 2013, ApJ, 777, 36
- Madhusudhan (2012) Madhusudhan N., 2012, ApJ, 758, 36
- Moses et al. (2013) Moses J. I., Madhusudhan N., Visscher C., Freedman R. S., 2013, ApJ, 763, 25
- Neves et al. (2014) Neves V., Bonfils X., Santos N. C., Delfosse X., Forveille T., Allard F., Udry S., 2014, A&A, 568, A121
- Nissen (2013) Nissen P. E., 2013, A&A, 552, A73
- Petigura & Marcy (2011) Petigura E. A., Marcy G. W., 2011, ApJ, 735, 41
- Reid et al. (1995) Reid I. N., Hawley S. L., Gizis J. E., 1995, AJ, 110, 1838
- Riaz et al. (2006) Riaz B., Gizis J. E., Harvin J., 2006, AJ, 132, 866
- Rojas-Ayala et al. (2010) Rojas-Ayala B., Covey K. R., Muirhead P. S., Lloyd J. P., 2010, ApJ Letters, 720, L113
- Rojas-Ayala et al. (2012) Rojas-Ayala B., Covey K. R., Muirhead P. S., Lloyd J. P., 2012, ApJ, 748, 93
- Savcheva et al. (2014) Savcheva A. S., West A. A., Bochanski J. J., 2014, ApJ, 794, 145
- Schmidt (1975) Schmidt M., 1975, ApJ, 202, 22
- Shkolnik et al. (2011) Shkolnik E. L., Liu M. C., Reid I. N., Dupuy T., Weinberger A. J., 2011, ApJ, 727, 6
- Teske et al. (2013) Teske J. K., Cunha K., Schuler S. C., Griffith C. A., Smith V. V., 2013, ApJ, 778, 132
- Tsuji & Nakajima (2014) Tsuji T., Nakajima T., 2014, PASJ, 66, 98
- West et al. (2004) West A. A., Hawley S. L., Walkowicz L. M., Covey K. R., Silvestri N. M., Raymond S. N., Harris H. C., Munn J. A., McGehee P. M., Ivezić Ž., Brinkmann J., 2004, AJ, 128, 426
- West et al. (2011) West A. A., Morgan D. P., Bochanski J. J., Andersen J. M., Bell K. J., Kowalski A. F., Davenport J. R. A., Hawley S. L., Schmidt S. J., Bernat D., Hilton E. J., Muirhead P., Covey K. R., Rojas-Ayala B., Schlawin E., Gooding M., 2011, AJ, 141, 97
- Woolf et al. (2009) Woolf V. M., Lépine S., Wallerstein G., 2009, PASP, 121, 117