New Ultraviolet Extinction Curves for Interstellar Dust in M31**affiliation: Based on observations made with the NASA/ESA Hubble Space Telescope, obtained by the Space Telescope Science Institute, and from the data archive at STScI. STScI is operated by the Association of Universities for Research in Astronomy, Inc., under NASA contract NAS5-26555.
Abstract
New low-resolution UV spectra of a sample of reddened OB stars in M31 were obtained with HST/STIS to study the wavelength dependence of interstellar extinction and the nature of the underlying dust grain populations. Extinction curves were constructed for four reddened sightlines in M31 paired with closely matching stellar atmosphere models. The new curves have a much higher S/N than previous studies. Direct measurements of N(H I) were made using the Ly absorption lines enabling gas-to-dust ratios to be calculated. The sightlines have a range in galactocentric distance of 5 to 14 kpc and represent dust from regions of different metallicities and gas-to-dust ratios. The metallicities sampled range from Solar to 1.5 Solar. The measured curves show similarity to those seen in the Milky Way and the Large Magellanic Cloud. The Maximum Entropy Method was used to investigate the dust composition and size distribution for the sightlines observed in this program finding that the extinction curves can be produced with the available carbon and silicon abundances if the metallicity is super-Solar.
Subject headings:
dust, extinction — ISM: abundances — ISM: molecules — ultraviolet: ISM1. Introduction
Cardelli et al. (1989, CCM) found that the wavelength dependence of extinction in the Galaxy was a function of one parameter, RV (=AV/E(B-V)), the ratio of total to selective extinction. This work was extended to over 400 sightlines in the Galaxy of which only 4 differed significantly from CCM (Valencic et al., 2004). However, it has become increasingly apparent that “standard” Milky Way (MW) type dust extinction does not generally apply to interstellar dust in other galaxies. It has been known for a long time that the UV extinction properties in the Magellanic Clouds are different from the MW and from each other. In particular, sightlines near 30 Dor in the Large Magellanic Cloud (LMC) (Clayton & Martin, 1985; Fitzpatrick, 1985) and in the star-forming Bar of the SMC (Prevot et al., 1984) show very un-MW extinction curves, especially in their weak 2175 Å bumps and steep far-UV rises. The variations seen in dust properties extend beyond that of the extinction curve shape, including e.g., the gas-to-dust ratio, indicating that there may be a wide range of underlying grain populations. In addition, many starburst galaxies seem to manifest dust properties similar to those associated with the Small Magellanic Cloud (SMC) (Gordon & Clayton, 1998).
The CCM study only probed a limited set of dust environments in the MW. All of the sightlines were within 1 kpc of the Sun, so it is not surprising that extinction in other galaxies has different properties than the MW. The observed variations from galaxy to galaxy are an indication of the complexity of dust properties and demonstrate the need for direct studies of dust for environments more representative of the current sample of extragalactic SEDs (e.g., Calzetti et al., 1994; Gordon et al., 1997).
The wavelength dependence of UV extinction due to dust can only be directly measured along sightlines where the spectra of individual stars can be obtained. Otherwise, the dust extinction characteristics must be inferred through radiative transfer modeling (Calzetti et al., 1994; Gordon et al., 1997). This technique is therefore limited to galaxies in the Local Group. Almost all of the studies of UV extinction have been limited to stars in three galaxies, the MW (Witt et al., 1984; Aiello et al., 1988; Fitzpatrick & Massa, 1990; Clayton et al., 2000; Valencic et al., 2004; Fitzpatrick & Massa, 2007), the LMC (Clayton & Martin, 1985; Fitzpatrick, 1985; Misselt et al., 1999; Gordon et al., 2003; De Marchi & Panagia, 2014) and the SMC (Lequeux et al., 1982; Prevot et al., 1984; Gordon & Clayton, 1998; Gordon et al., 2003; Maíz Apellániz & Rubio, 2012; Gordon et al., 2015).
Beyond the MW and the Magellanic Clouds, there isn’t much information on the extinction properties in other Local Group galaxies. Radiative transfer modeling of the emission from the starburst nucleus of M33 indicates the presence of a strong 2175 Å bump unlike other starbursts which show more SMC-like extinction having little or no evidence for a bump (Gordon et al., 1999). A recent Swift and HST photometric study of dust clumps in the bulge of M31 suggests that the UV extinction is generally steeper than the CCM, RV=3.1 curve (Dong et al., 2014). Analysis of interstellar polarization along four sightlines in M31 suggests significant differences in the size distribution of silicate grains compared with those studied elsewhere in the Local Group (Clayton et al., 2004).
2. Dust and Gas in M31
Almost 20 years ago, Bianchi et al. (1996) did a “pilot study” using HST/FOS of UV extinction toward a very small sample of OB stars in M31. They derived an average M31 extinction curve from only three sightlines that has an overall wavelength dependence similar to that of the average Galactic extinction curve, but potentially possessing a weaker 2175 Å bump. While the extinction curves calculated from these data provided a proof-of-concept, the study suffered several drawbacks that made interpretation of the extinction difficult: the UV spectra had very low S/N and the stars observed were only lightly reddened.
The metallicity of M31 has been determined to be about two times Solar by Zaritsky et al. (1994) based on H II regions. Studies of some A and B supergiants in M31 suggested that the metallicity was close to Solar (Venn et al., 2000; Smartt et al., 2001) but a large, recent study by Sanders et al. (2012) has reconfirmed the super-Solar abundances.
In this paper, we present new high S/N HST/STIS spectra of a small number of significantly reddened stars in M31 and construct extinction curves for those sightlines to study the nature of its interstellar dust.
3. Observations
| Star | MAC86a | RA | Dec | Date | Exp. (s) | Dataset | STIS Grating |
|---|---|---|---|---|---|---|---|
| J003733.35+400036.6 | 00 37 33.340 | +40 00 36.70 | 2012-10-05 | 2423 | OBPX01010 | G230L | |
| 2000-07-07 | 2323 | O56R12010 | G140Lb | ||||
| 2000-07-07 | 2323 | O56R12020 | G140Lb | ||||
| J003944.71+402056.2 | 00 39 44.710 | +40 20 56.20 | 2013-01-27 | 2423 | OBPX02010 | G230L | |
| 2013-01-27 | 2908 | OBPX02020 | G140Lc | ||||
| 2013-07-13 | 2494 | OBPX52010 | G140L | ||||
| J003958.22+402329.0 | 00 39 58.220 | +40 23 29.00 | 2013-02-03 | 2423 | OBPX03010 | G230L | |
| 2013-02-03 | 3077 | OBPX03020 | G140L | ||||
| J004029.71+404429.8d | OB 78-231 | 00 40 29.700 | +40 44 28.40 | 2012-10-04 | 2423 | OBPX04010 | G230L |
| 2004-01-22 | 1820 | O8MG01010 | G140Le | ||||
| 2004-01-22 | 2840 | O8MG01020 | G140Le | ||||
| 2004-01-22 | 2800 | O8MG01030 | G140Le | ||||
| 2004-01-22 | 2800 | O8MG01040 | G140Le | ||||
| 2004-01-22 | 2800 | O8MG01050 | G140Le | ||||
| J004030.94+404246.9 | OB 78-347 | 00 40 30.940 | +40 42 46.90 | 2013-02-11 | 2423 | OBPX05010 | G230L |
| 2013-02-11 | 3077 | OBPX05020 | G140L | ||||
| J004031.52+404501.9 | OB 78-376 | 00 40 31.520 | +40 45 01.90 | 2012-12-19 | 2423 | OBPX06010 | G230L |
| 2012-12-19 | 3077 | OBPX06020 | G140L | ||||
| J004034.61+404326.1 | OB 78-550 | 00 40 34.610 | +40 43 26.10 | 2013-02-09 | 2423 | OBPX07010 | G230L |
| 2013-02-09 | 3077 | OBPX07020 | G140L | ||||
| J004037.92+404333.3 | 00 40 37.920 | +40 43 33.30 | 2013-02-10 | 2423 | OBPX08010 | G230L | |
| 2013-02-10 | 3077 | OBPX08020 | G140L | ||||
| J004412.17+413324.2 | 00 44 12.170 | +41 33 24.20 | 2012-06-28 | 2423 | OBPX09010 | G230L | |
| 2012-06-28 | 3077 | OBPX09020 | G140L | ||||
| J004412.97+413328.8 | OB 10-150 | 00 44 12.970 | +41 33 28.80 | 2012-10-03 | 2423 | OBPX10010 | G230L |
| 2003-09-27 | 2200 | O8MG07010 | G140Le | ||||
| 2003-09-27 | 2840 | O8MG07020 | G140Le | ||||
| 2003-09-27 | 2800 | O8MG07030 | G140Le | ||||
| 2003-09-27 | 2800 | O8MG07040 | G140Le | ||||
| 2003-09-27 | 2800 | O8MG07050 | G140Le | ||||
| 2003-09-27 | 2840 | O8MG08010 | G140Le | ||||
| 2003-09-27 | 2840 | O8MG08020 | G140Le | ||||
| 2003-09-27 | 2800 | O8MG08030 | G140Le | ||||
| 2003-09-27 | 2800 | O8MG08040 | G140Le | ||||
| 2003-09-27 | 2800 | O8MG08050 | G140Le | ||||
| J004515.27+413747.9e | OB 48-444 | 00 45 15.270 | +41 37 47.90 | 2012-12-16 | 2423 | OBPX11010 | G230L |
| 2012-12-16 | 0 | OBPX11020 | G140Lf | ||||
| 2013-01-21 | 2494 | OBPX13010 | G140L |
| Star | V | B-V | Sp.T. | E(B-V)a | Refb |
|---|---|---|---|---|---|
| J003733.35+400036.6 | 18.16 | -0.21 | B2 Ia | -0.04 | 2 |
| J003944.71+402056.2 | 18.2 | 0.15 | O9.7 Ib | 0.42 | 1 |
| J003958.22+402329.0 | 18.97 | 0.09 | B0.7 Ia | 0.30 | 1 |
| J004029.71+404429.8 | 18.56 | -0.23 | O7-7.5 Iaf | 0.05 | 1,3 |
| J004030.94+404246.9 | 18.87 | -0.15 | O9.5 Ib | 0.12 | 1 |
| J004031.52+404501.9 | 18.92 | -0.15 | B0.5 Ia | 0.07 | 1 |
| J004034.61+404326.1 | 18.67 | 0.15 | B1 Ia | 0.34 | 1 |
| J004037.92+404333.3 | 18.66 | 0.06 | B1.5 Ia | 0.23 | 1 |
| J004412.17+413324.2 | 17.33 | 0.34 | B2.5 Ia | 0.49 | 1 |
| J004412.97+413328.8 | 19.18 | -0.04 | O8.5 Ia(f) | 0.24 | 3 |
| J004515.27+413747.9 | 19.10 | -0.02 | O8 I | 0.26 | 3 |
Eleven early-type M31 supergiants were observed by HST/STIS using the G140L and G230L gratings. The sample was selected from stars known to be members of M31 for which spectral types are available (Massey et al., 1995; Bresolin et al., 2002; Cordiner et al., 2011). Two of the G140L observations, marked in Table 1, failed and were redone. Also, three stars in the sample already had existing G140L observations. These were retrieved from the Mikulski Archive for Space Telescopes (MAST) and were used in this study. The new and archival observational data are summarized in Table 1. Table 2 lists the stellar parameters for the sample. The new UV spectra have been combined with existing ground-based UBVRI photometry (Massey et al., 2006) to create an SED for each star.
The sample of stars, for which new and archival HST/STIS spectra have been obtained, consists of seven significantly reddened stars (E(B-V)= 0.3-0.5) and four lightly reddened stars (E(B-V)0.1) of similar spectral types. These stars are all members of M31 (Massey et al., 2006). The sample is limited to spectral types ranging from O7 to B2.5 supergiants (Massey et al., 1995; Bresolin et al., 2002; Cordiner et al., 2011).
Our most reddened star, J004412.17+413324.2, is very bright (V=17.33 and B-V = 0.34 (Massey et al., 2006)). If it is an early B supergiant then the expected MV -6.5. With a calculated reddening E(B-V)=0.49 and assuming a distance modulus to M31 of 24.4 (e.g., Riess et al., 2012), then MV = 17.34 - 3.1 x (0.49) -24.4 = -8.6 mag. This is consistent with a bright blue supergiant and it has been confirmed as a member of M31 (Massey et al., 2006). Bonanos et al. (2003) found J004412.17+413324.2 to be a variable star.
Only one reddened star in our sample, J003944.71+402056.2, has near-IR photometry (J=17.83, K=17.68) (Sick et al., 2014). For this star, E(V-K) = 1.25 assuming it is an O9.7 Ib star (Cox, 2000). Then, A(V) can be estimated by E(V-K)1.1 = 1.37 mag (Whittet & van Breda, 1978), and RV= A(V)/E(B-V) = 1.37/0.42 = 3.3.
4. Extinction Curves
Traditionally, extinction curves are calculated using the standard pair method (Massa et al., 1983; Cardelli et al., 1992), which requires a reddened star and a lightly reddened comparison star having the same or similar spectral type. However, finding a a good spectral match is not easy especially when a limited sample of lightly reddened stars is available, so stellar atmosphere models are now being extensively used as pair stars. The use of spectra from stellar atmosphere models as comparison “stars” is at least as accurate as using actual stellar spectra (Fitzpatrick & Massa, 2005). Extinction curves were attempted using the reddened and lightly reddened stars in the sample but the spectral type matches were not satisfactory. Extinction curve matches were made with stellar atmosphere models with better success.
| Parameter | Description | Min | Max |
|---|---|---|---|
| M31 Components | |||
| effective temperature | 4.18 | 4.74 | |
| surface gravity | 1.75 | 4.75 | |
| metallicity | -0.3 | 0.3 | |
| V band extinction | 0.0 | 4.0 | |
| 1.0 | 7.0 | ||
| UV slope | -0.5 | 1.5 | |
| 2175 Å bump height | 0.0 | 6.0 | |
| FUV curvature | -0.2 | 2.0 | |
| 2175 Å bump centroid | 4.55 | 4.65 | |
| 2175 Å bump width | 0. | 2.5 | |
| M31 HI column | 19.0 | 24.0 | |
| MW Components | |||
| MW HI column | 18.0 | 22.0 | |
| MW dust column | 0.06 | ||
| MW | 3.1 | ||
| velocity [km s-1] | 0 | ||
The extinction curves were calculated by forward modeling of the spectrum of each star to determine the correct model atmosphere to use as the unreddened comparison star. The model we adopt for the M31 stars is a combination of a TLusty stellar model atmosphere (Lanz & Hubeny, 2003, 2007) extinguished by an -dependent extinction curve (Fitzpatrick, 1999) in the optical and NIR, combined with a Fitzpatrick & Massa (1990, FM) parametrization in the UV, updated by Fitzpatrick & Massa (2007). The assumed model fit parameters are given in Table 3. Some of the model parameters are fixed at single values as our observations are not sensitive to these parameters. The M31 components of the model have radial velocities calculated using the method of Rubin & Ford (1970) and Drout et al. (2009). These velocities are listed in Table 4. The MW components of the model have a fixed radial velocity of 0 km s-1.
We fit this model to the observed data using the EMCEE fitting code (Foreman-Mackey et al., 2013). The observed and model spectra were normalized by the average of the optical photometry prior to fitting. We imposed flat priors on most of the fit parameters with the min and max values given in Table 3. The min and max values were set to reasonable limits on fit parameters and were generally based on expected ranges from MW measurements of extinction curves (Valencic et al., 2004). The min and max values for were set to be between -0.3 and 0.3 solar metallicity as a reasonable range given the galactocentric distances of the reddened stars in our sample. For the stellar parameters, , , and , the base priors are given by the allowed model space as defined by the TLusty stellar atmosphere grid. For , we add an additional multiplicative Gaussian prior based on the literature spectral type (Table 2) and assuming an uncertainty of one subclass in spectral type. We use the Conti et al. (2008) calibration of spectral type to . The results of the fitting have been used to calculate uncertainties on all the fit parameters. These uncertainties include a full accounting of the sources of noise, including spectral mismatch illustrating one of the strengths of the method.
| Prior | Fit Parameters | ||||
|---|---|---|---|---|---|
| Star | ) | RV | ) | ||
| (km s-1) | |||||
| J003944.71+402056.2 | -511 | ||||
| J003958.22+402329.0 | -505 | ||||
| J004034.61+404326.1 | -536 | ||||
| J004412.17+413324.2 | -76 | ||||
| Star | |||||||
|---|---|---|---|---|---|---|---|
| J003944.71+402056.2 | |||||||
| 0.37 | 0.33 | 0.62 | 3.05 | 0.38 | 4.57 | 0.99 | |
| J003958.22+402329.0 | |||||||
| 0.24 | -0.41 | 0.88 | 3.95 | -0.01 | 4.65 | 1.15 | |
| J004034.61+404326.1 | |||||||
| 0.25 | -0.86 | 1.04 | 5.16 | -0.16 | 4.65 | 1.25 | |
| J004412.17+413324.2 | |||||||
| 0.39 | -1.57 | 1.29 | 3.16 | -0.17 | 4.64 | 1.06 |
| Fit Results | 21 cm Results | |||||
|---|---|---|---|---|---|---|
| Star | GC Dist. | |||||
| J003944.71+402056.2 | 14.0 | 4.5 | 6.4 | |||
| J003958.22+402329.0 | 13.3 | 4.0 | 8.0 | |||
| J004034.61+404326.1 | 8.8 | 2.3 | 4.4 | |||
| J004412.17+413324.2 | 5.2 | 2.0 | 2.5 | |||

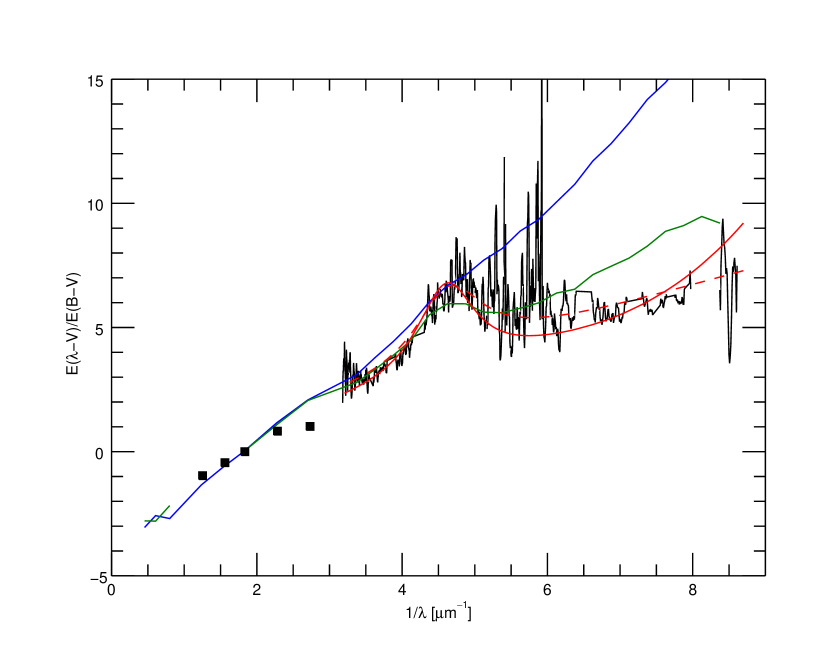
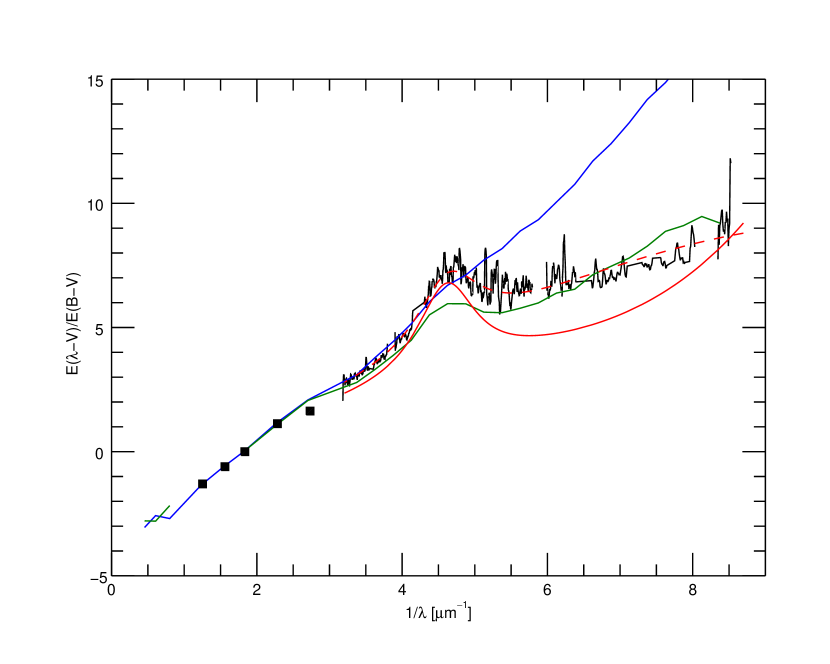
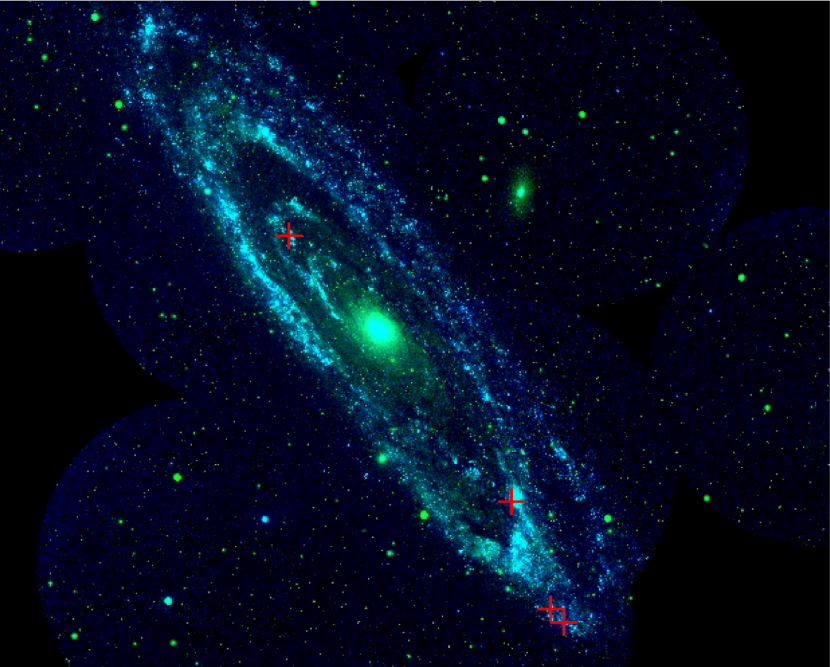
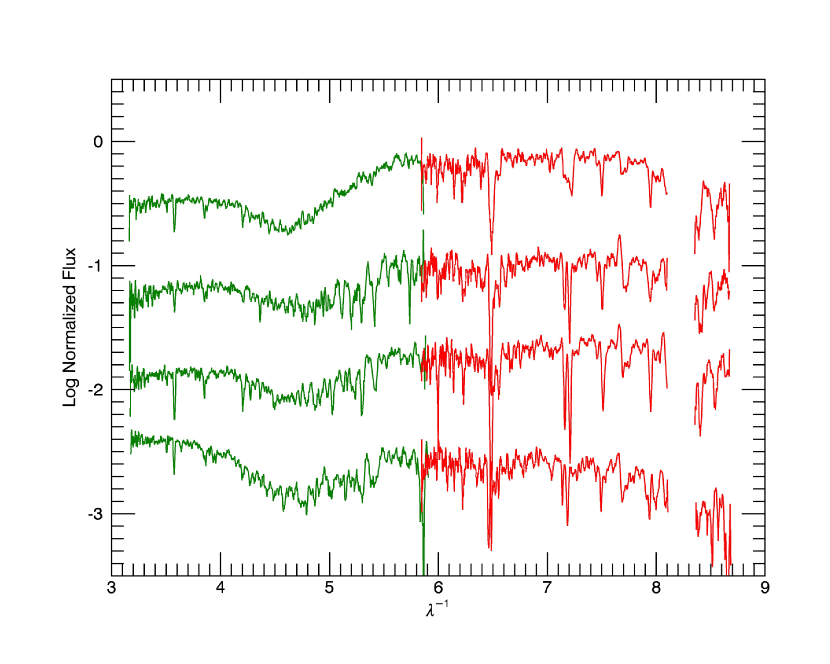
Since the stars in M31 are being paired with unreddened stellar models, the foreground MW dust extinction must be removed explicitly. Older estimates of the M31 foreground ( mag) are discussed in Bianchi et al. (1996). Newer estimates including Schlegel et al. (1998) and Schlafly & Finkbeiner (2011) give an average mag (Cordiner et al., 2011). This estimate for the MW foreground has been confirmed by a survey of M31 star-forming regions (Bianchi et al., 2012). So, a MW foreground extinction component of , assuming CCM dust, is included as part of the fitting process described above. Three of the seven “reddened” stars in the sample had small E(B-V) values between 0.09 and 0.16 so these curves are not used in the analysis presented here. The positions of the four remaining stars are plotted on a GALEX image of M31 in Figure 1 and their HST/STIS spectra are plotted in Figure 2. The extinction curves for these four significantly reddened sightlines are shown in Figure 3 with a 5-point smoothing. The model fit parameter results for each star are given in Tables 4, 5, and 6. The extinction curves are fit with the Fitzpatrick & Massa (1990, FM) parameters. The fit parameters and 1 uncertainties are tabulated based on the 17%, 50%, and 83% values of the marginalized 1D posterior probability distribution functions generated from the EMCEE results. Table 5 gives the best fit and the 50% (median probability) fit for each extinction curve. We give the dust column results using as this measurement was well behaved (small uncertainties) whereas the measurements of and have very large uncertainties. The parameter is not fit. We include it here assuming that (Fitzpatrick & Massa, 2007).
The column density of H I along each sightline in the sample was estimated by measuring Ly absorption lines in the HST/STIS spectra (Diplas & Savage, 1994). This was done simultaneously as part of the model fitting. The estimates for N(H I) are given in Table 6. Also calculated and listed in Table 6 are the gas-to-dust ratios, . There are also 21 cm observations of H I for the four sightlines (Cordiner et al., 2011). Unlike the Ly column densities which just measure the H I in front of the star, the 21 cm column densities are for the entire sightline. So the best estimate of the gas-to-dust ratio is 0.5 N(H I)/E(B-V) for the 21 cm observations. These are also listed in Table 6. Because the fraction of the H I column density that is along the sightline to the star in unknown, the uncertainties are assumed to be 100%.
5. Discussion
The calculated extinction curves for the four new sightlines in M31 are shown in Figure 3. These curves have been corrected for MW foreground so should reflect the extinction properties of interstellar dust in M31. These curves are a great improvement on the data presented in Figure 5 of Bianchi et al. (1996) which is an average of several low-reddening sightlines. That curve seemed to show a weak bump along with a MW-like FUV extinction.
The new curves sample dust in M31 at a range of galactocentric distances and in different regions of M31 as shown in Figure 1. We are sampling sightlines separated by kiloparsecs, much further apart than any sampled in our own Galaxy. The extinction curve for J003944.71+402056.2 is the only sightline in the sample with an estimated value of . This value is consistent with its measured extinction curve shown in Figure 3 which looks very similar to the average MW (CCM ) extinction curve overplotted in red. This star appears to be associated with an H II region, and shows strong diffuse interstellar band (DIB) features (Baade & Arp, 1964; Cordiner et al., 2011). J003944.71+402056.2 lies very close in projection to J003958.22+402329.0 but may not be very close in three dimensions. The curve for J003958.22+402329.0 is significantly different than J003944.71+402056.2 with a smaller FUV curvature parameter () and a weaker bump as measured by (Fitzpatrick & Massa, 1990). The extinction curve for J004034.61+404326.1 is similar to J003958.22+402329.0 but with a stronger bump. This sightline shows weak DIB features (Cordiner et al., 2011).
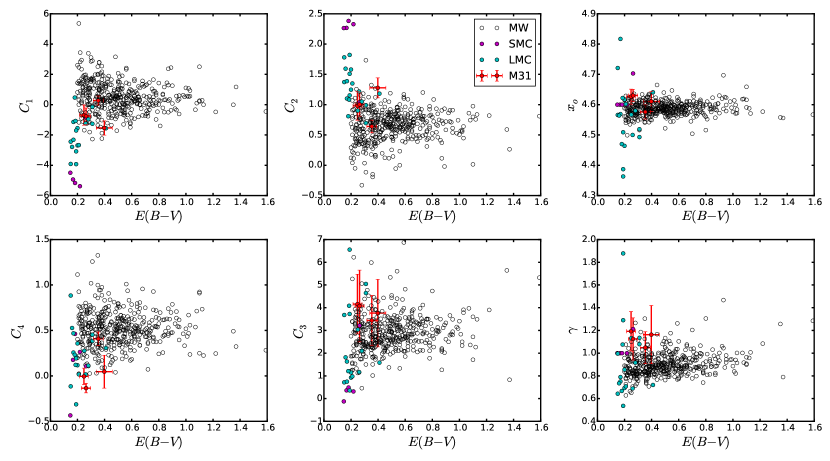
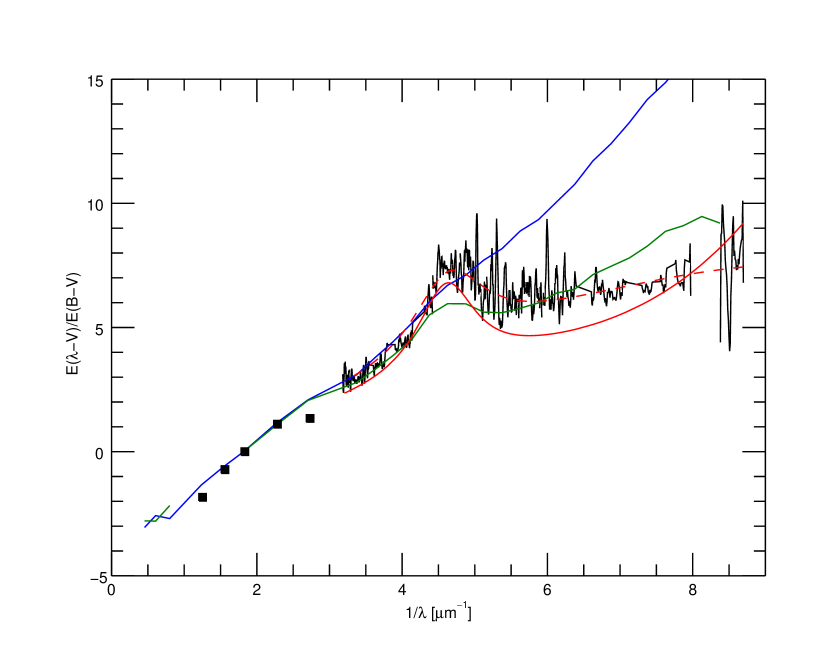
The most reddened sightline, J004412.17+413324.2, shows a curve reminiscent of the 30-Dor region of the LMC or a MW CCM curve (Misselt et al., 1999). But the lack of FUV curvature () makes it even flatter than the LMC-30-Dor curves. It is also associated with an H II region (Baade & Arp, 1964; Cordiner et al., 2011). The J004034.61+404326.1 and J003958.22+402329.0 extinction curves show a similar wavelength dependence. This can be seen in Figure 4 where the FM parameters for MW, LMC, SMC and the new M31 sightlines are plotted against . The Spitzer 8 µm intensity is relatively strong close to J004412.17+413324.2 possibly indicating the presence of a dense dust cloud (Cordiner et al., 2011). It also shows weak DIB features for its reddening as do sightlines in the LMC (Cox et al., 2006). The UV extinction observed through five dusty clumps in the bulge of M31 has been measured using filter photometry with HST and Swift (Dong et al., 2014). They suggest that the curves are steeper than the average MW extinction, perhaps with but there is a lot of scatter in their curves. Their result supports that of Melchior et al. (2000) which implied using only BVRI photometry for one sightline in the bulge of M31. The extinction curve for J004412.17+413324.2, which is the closest of the stars in our sample to the M31 bulge, at a projected galactocentric distance of 5 kpc, resembles a MW curve with an but is closer to an LMC 30-Dor curve. These extinction measurements all show evidence for low , and small average grain sizes in the highest metallicity regions of M31.
The gas-to-dust ratios measured here using Ly absorption lines for J003944.71+402056.2, J003958.22+402329.0, and J004034.61+404326.1 may be higher than the average MW value ( atoms cm-2 mag-1) (Bohlin et al., 1978) although these values are quite uncertain. The projected galactocentric distance from the center of M31 for these stars is between 8.8 and 14.0 kpc where the metallicity is approximately Solar (Sanders et al., 2012). J004412.17+413324.2, the most reddened star, has the lowest N(H I) column density and therefore the lowest gas-to-dust ratio in the sample, significantly lower than the average MW value. It is at a projected galactocentric distance of only 5.2 kpc which corresponds to a metallicity about 1.6 Solar, so a low gas-to-dust ratio would be expected (Sanders et al., 2012). Unfortunately, the measured Ly N(H I) is very uncertain for this sightline. But, the 21 cm data for the same sightline, listed in Table 6, also indicate that the gas-to-dust ratio is low. The 21cm N(H I) estimates for the four stars imply lower gas-to-dust ratios than the Ly estimates, more in line with the average MW value, but since the fraction of the N(H I) along the line of sight to each star is uncertain, the column densities could be higher or even lower. (Cordiner et al., 2011). Taking an average of the four sightlines using the 21 cm data, we get a gas-to-dust ratio of atoms cm-2 mag-1, close to the MW value.
The measured extinction curves for the four M31 sightlines have been used as inputs for Maximum Entropy Method (MEM) modeling of the underlying dust grain populations. This analysis is similar to that applied previously to extinction curves in the MW and the Magellanic clouds (Clayton et al., 2003). We use a version of the MEM extinction-fitting algorithm similar to that developed by Kim et al. (1994). MEM uses the mass distribution in which is the mass of dust grains per H atom in the size interval from a to a + da rather than using the number of grains as a constraint. A Mathis et al. (1977) (MRN-type) model becomes a-0.5. The total mass of dust is constrained using both the gas-to-dust ratio and the available abundances of iron, carbon and silicon. The fraction of the available silicon and carbon used in the MEM fits covers a very wide range. For example, the MW, which has a relatively low gas-to-dust ratio and high metal abundances, also requires almost 100% of the available silicon and and 80% of the carbon (Clayton et al., 2003). The LMC (30-Dor) and the SMC Bar regions both have low metal abundances and high gas-to-dust ratios. Both use 50% or less of the available silicon and 60-80% of the carbon. Three general factors determine the fraction of silicon and carbon that any individual sight line will use. First, the higher the gas-to-dust ratio is, the more metals are available in the gas phase. Second, the higher the abundances of metals are, the more material is available to make grains. Finally, high values of the ratio of total-to-selective extinction, , imply a greater than average mass fraction in larger grains.


The MEM fit results are shown in Figure 5. The fits were made using three interstellar dust components, Fe-silicate, graphite, and amorphous carbon (Jaeger et al., 1994; Dorschner et al., 1995; Clayton et al., 2003). We have adopted the following MW abundances for the MEM fitting, Si/H = , C/H = , and Fe/H = (Clayton et al., 2003). As described above, the measured gas-to-dust ratios may be higher than the MW for three of the sightlines and lower for J004412.17+413324.2 but have large uncertainties. Also, based on their projected positions in M31, the abundances should be near Solar for J003944.71+402056.2, J003958.22+402329.0, and J004034.61+404326.1 and super-Solar for J004412.17+413324.2. The latter sightline has the lowest gas-to-dust ratio as expected. Therefore, three MEM fitting runs were performed for the four M31 sightlines, assuming Solar abundances along with three different gas-to-dust ratios, MW ( atoms cm-2 mag-1), 1/2MW, and 2MW. The results for the run with Solar abundances and the 2MW gas-to-dust ratio are shown in Figure 5. Also shown in Figure 5 are the values for the MW CCM average extinction curve.
Of the three MEM runs, in the first two, with Solar abundances, and MW and 1/2MW gas-to-dust ratios, there is not enough Si and C available to make the dust grains required to fit the observed extinction. In the last case, shown in Figure 5, the available abundances are enough to make the grains needed. The four M31 sightlines modeled here use 53-74% of the Si, 11-15% of the Fe, 13-16% of the graphite, and 38-41% of the amorphous carbon available. The results show that the M31 extinction curves can only be fit where the abundances are greater than Solar, the gas-to-dust ratio is greater than the average MW ratio or a combination of both. The large measured gas-to-dust ratios for J003944.71+402056.2, J003958.22+402329.0, and J004034.61+404326.1 and Solar abundances are needed to fit those sightlines. The most reddened sightline, J004412.17+413324.2, which lies closest to the center of M31 is problematic. The abundances for this sightline would need to be very super-Solar if the small measured gas-to-dust ratio is correct. Unfortunately, there is not much information on for these sightlines, only J003944.71+402056.2 with has an estimate which seems reasonable for its observed extinction curve.
6. Summary
The new UV extinction curves presented here provide a tantalizing glimpse into the interstellar dust properties in M31. Unlike the MW, the dust in M31 can be sampled across the whole galactic disk. These results are a significant improvement on previous M31 extinction curves (Bianchi et al., 1996). The sample is small but the extinction properties range from a curve very similar to CCM seen toward J003944.71+402056.2 which is at a projected distance from the galactic center of 14 kpc to a curve similar to LMC (30-Dor) extinction seen toward J004412.17+413324.2 which is at a projected distance of 5 kpc.
The new extinction curves show similarities to those seen the MW and the LMC. The highest metallicity sightline which is closest to the M31 bulge, and has the lowest gas-to-dust ratio shows an extinction curve consistent a low value of or possibly with the LMC 30-Dor region. Many more sightlines need to be studied to map out the extinction properties of M31 and to investigate the link between UV extinction properties and global characteristics such as metallicity and star formation activity.
This study was supported by grant HST-GO-12562.01 from NASA/STScI. Some of the data presented in this paper were obtained from the Mikulski Archive for Space Telescopes (MAST). STScI is operated by the Association of Universities for Research in Astronomy, Inc., under NASA contract NAS5-26555. We would like to thank Jonathan Sick for providing JK photometry for this study.
References
- Aiello et al. (1988) Aiello, S., Barsella, B., Chlewicki, G., et al. 1988, A&AS, 73, 195
- Baade & Arp (1964) Baade, W., & Arp, H. 1964, ApJ, 139, 1027
- Bianchi et al. (1996) Bianchi, L., Clayton, G. C., Bohlin, R. C., Hutchings, J. B., & Massey, P. 1996, ApJ, 471, 203
- Bianchi et al. (2012) Bianchi, L., Efremova, B., Hodge, P., & Kang, Y. 2012, AJ, 144, 142
- Bohlin et al. (1978) Bohlin, R. C., Savage, B. D., & Drake, J. F. 1978, ApJ, 224, 132
- Bonanos et al. (2003) Bonanos, A. Z., Stanek, K. Z., Sasselov, D. D., et al. 2003, AJ, 126, 175
- Bresolin et al. (2002) Bresolin, F., Kudritzki, R.-P., Lennon, D. J., et al. 2002, ApJ, 580, 213
- Calzetti et al. (1994) Calzetti, D., Kinney, A. L., & Storchi-Bergmann, T. 1994, ApJ, 429, 582
- Cardelli et al. (1989) Cardelli, J. A., Clayton, G. C., & Mathis, J. S. 1989, ApJ, 345, 245
- Cardelli et al. (1992) Cardelli, J. A., Sembach, K. R., & Mathis, J. S. 1992, AJ, 104, 1916
- Clayton et al. (2000) Clayton, G. C., Gordon, K. D., & Wolff, M. J. 2000, ApJS, 129, 147
- Clayton & Martin (1985) Clayton, G. C., & Martin, P. G. 1985, ApJ, 288, 558
- Clayton et al. (2004) Clayton, G. C., Wolff, M. J., Gordon, K. D., et al. 2004, AJ, 127, 3382
- Clayton et al. (2003) Clayton, G. C., Wolff, M. J., Sofia, U. J., Gordon, K. D., & Misselt, K. A. 2003, ApJ, 588, 871
- Conti et al. (2008) Conti, P. S., Crowther, P. A., & Leitherer, C. 2008, From Luminous Hot Stars to Starburst Galaxies (Cambridge University Press)
- Cordiner et al. (2011) Cordiner, M. A., Cox, N. L. J., Evans, C. J., et al. 2011, ApJ, 726, 39
- Cox (2000) Cox, A. N. 2000, Allen’s Astrophysical Quantities
- Cox et al. (2006) Cox, N. L. J., Cordiner, M. A., Cami, J., et al. 2006, A&A, 447, 991
- De Marchi & Panagia (2014) De Marchi, G., & Panagia, N. 2014, MNRAS, 445, 93
- Diplas & Savage (1994) Diplas, A., & Savage, B. D. 1994, ApJ, 427, 274
- Dong et al. (2014) Dong, H., Li, Z., Wang, Q. D., et al. 2014, ApJ, 785, 136
- Dorschner et al. (1995) Dorschner, J., Begemann, B., Henning, T., Jaeger, C., & Mutschke, H. 1995, A&A, 300, 503
- Drout et al. (2009) Drout, M. R., Massey, P., Meynet, G., Tokarz, S., & Caldwell, N. 2009, ApJ, 703, 441
- Fitzgerald (1970) Fitzgerald, M. P. 1970, A&A, 4, 234
- Fitzpatrick (1985) Fitzpatrick, E. L. 1985, ApJ, 299, 219
- Fitzpatrick (1999) —. 1999, PASP, 111, 63
- Fitzpatrick & Massa (1990) Fitzpatrick, E. L., & Massa, D. 1990, ApJS, 72, 163
- Fitzpatrick & Massa (2005) —. 2005, AJ, 130, 1127
- Fitzpatrick & Massa (2007) —. 2007, ApJ, 663, 320
- Foreman-Mackey et al. (2013) Foreman-Mackey, D., Hogg, D. W., Lang, D., & Goodman, J. 2013, PASP, 125, 306
- Gordon et al. (1997) Gordon, K. D., Calzetti, D., & Witt, A. N. 1997, ApJ, 487, 625
- Gordon & Clayton (1998) Gordon, K. D., & Clayton, G. C. 1998, ApJ, 500, 816
- Gordon et al. (2003) Gordon, K. D., Clayton, G. C., Misselt, K. A., Landolt, A. U., & Wolff, M. J. 2003, ApJ, 594, 279
- Gordon et al. (1999) Gordon, K. D., Hanson, M. M., Clayton, G. C., Rieke, G. H., & Misselt, K. A. 1999, ApJ, 519, 165
- Gordon et al. (2015) Gordon et al., K. D. 2015, ApJ, Submitted
- Jaeger et al. (1994) Jaeger, C., Mutschke, H., Begemann, B., Dorschner, J., & Henning, T. 1994, A&A, 292, 641
- Kim et al. (1994) Kim, S.-H., Martin, P. G., & Hendry, P. D. 1994, ApJ, 422, 164
- Lanz & Hubeny (2003) Lanz, T., & Hubeny, I. 2003, ApJS, 146, 417
- Lanz & Hubeny (2007) —. 2007, ApJS, 169, 83
- Lequeux et al. (1982) Lequeux, J., Maurice, E., Prevot-Burnichon, M.-L., Prevot, L., & Rocca-Volmerange, B. 1982, A&A, 113, L15
- Maíz Apellániz & Rubio (2012) Maíz Apellániz, J., & Rubio, M. 2012, A&A, 541, A54
- Massa et al. (1983) Massa, D., Savage, B. D., & Fitzpatrick, E. L. 1983, ApJ, 266, 662
- Massey et al. (1995) Massey, P., Armandroff, T. E., Pyke, R., Patel, K., & Wilson, C. D. 1995, AJ, 110, 2715
- Massey et al. (2006) Massey, P., Olsen, K. A. G., Hodge, P. W., et al. 2006, AJ, 131, 2478
- Mathis et al. (1977) Mathis, J. S., Rumpl, W., & Nordsieck, K. H. 1977, ApJ, 217, 425
- Melchior et al. (2000) Melchior, A.-L., Viallefond, F., Guélin, M., & Neininger, N. 2000, MNRAS, 312, L29
- Misselt et al. (1999) Misselt, K. A., Clayton, G. C., & Gordon, K. D. 1999, ApJ, 515, 128
- Prevot et al. (1984) Prevot, M. L., Lequeux, J., Prevot, L., Maurice, E., & Rocca-Volmerange, B. 1984, A&A, 132, 389
- Riess et al. (2012) Riess, A. G., Fliri, J., & Valls-Gabaud, D. 2012, ApJ, 745, 156
- Rubin & Ford (1970) Rubin, V. C., & Ford, Jr., W. K. 1970, ApJ, 159, 379
- Sanders et al. (2012) Sanders, N. E., Caldwell, N., McDowell, J., & Harding, P. 2012, ApJ, 758, 133
- Schlafly & Finkbeiner (2011) Schlafly, E. F., & Finkbeiner, D. P. 2011, ApJ, 737, 103
- Schlegel et al. (1998) Schlegel, D. J., Finkbeiner, D. P., & Davis, M. 1998, ApJ, 500, 525
- Sick et al. (2014) Sick, J., Courteau, S., Cuillandre, J.-C., et al. 2014, AJ, 147, 109
- Smartt et al. (2001) Smartt, S. J., Crowther, P. A., Dufton, P. L., et al. 2001, MNRAS, 325, 257
- Valencic et al. (2004) Valencic, L. A., Clayton, G. C., & Gordon, K. D. 2004, ApJ, 616, 912
- Venn et al. (2000) Venn, K. A., McCarthy, J. K., Lennon, D. J., et al. 2000, ApJ, 541, 610
- Whittet & van Breda (1978) Whittet, D. C. B., & van Breda, I. G. 1978, A&A, 66, 57
- Witt et al. (1984) Witt, A. N., Bohlin, R. C., & Stecher, T. P. 1984, ApJ, 279, 698
- Zaritsky et al. (1994) Zaritsky, D., Kennicutt, Jr., R. C., & Huchra, J. P. 1994, ApJ, 420, 87