Robust luminescence of the silicon-vacancy center in diamond at high temperatures
Abstract
We performed high-temperature luminescence studies of silicon-vacancy color centers obtained by ion implantation in single crystal diamond. We observed reduction of the integrated fluorescence upon increasing temperature, ascribable to a transition channel with an activation energy of 180 meV that populates a shelving state. Nonetheless, the signal decreased only 50% and 75% with respect to room temperature at 500 K and 700 K, respectively. In addition, the color center is found highly photostable at temperatures exceeding 800 K. The luminescence of this color center is thus extremely robust even at large temperatures and it holds promise for novel diamond-based light-emitting devices.
Diamond and silicon carbide are well known for their potential in electronics, especially for high-speed, high-frequency, high-temperature, and high-power applications.Willander et al. (2006) Recent developments in the electroluminescence of color centers in diamondLohrmann et al. (2011); Mizuochi et al. (2012); Berhane et al. (2015) and silicon carbideLohrmann et al. (2015) make the assessment of their luminescence properties above room temperature particularly interesting. In fact, at relatively high temperatures the populations of the valence and conduction bands, which are typically quite small due to the large activation energy of n- and p-type dopants in diamond, should significantly increaseGabrysch et al. (2008); Stenger et al. (2013) and thus potentially lead to much higher electroluminescent rates.
The temperature dependence of the luminescence peaked at 738 nm of the negatively-charged silicon-vacancy (SiV-) center in diamond has long been studied in the range between cryogenic and room temperatures.Pezzagna et al. (2011); Feng and Schwartz (1993); Gorokhovsky et al. (1995); Neu et al. (2013) Those measurements revealed, along with a red shift and a widening of the zero-phonon line (ZPL) with increasing temperatures, a quenching of the luminescence presumably due to the thermal activation of a non-radiative decay mode with an activation energy evaluated in Ref. Feng and Schwartz, 1993 of about 70 meV. The integrated signal seemed to reach a plateau beyond 250 K, placed at about 10%Feng and Schwartz (1993) or 20%Pezzagna et al. (2011) of the low temperature limit.
In this Letter, we report on the luminescence properties of SiV- color centers in diamond at temperatures from 293 K to 861 K. In this range, we observed a further reduction of the integrated luminescence ascribable to population transfer into a shelving state,Neu, Agio, and Becher (2012) facilitated by a transition channel with an activation energy of 180 meV. Nonetheless, the decrease of the signal is only 50% of the room-temperature level at about 500 K and at about 700 K it reaches a value corresponding to 25% of that at 293 K. The intensity is still decreasing at further higher temperatures, although at a reduced rate. The quenching takes place along with a red-shift of the 738 nm peak up to 751 nm at 861 K, and with an increase of the Full Width at Half Maximum (FWHM) from less than 6 nm at 293 K to more than 80 nm at 861 K, while the phonon side-band becomes progressively less important down to complete quenching at about 600 K.
We implanted 8 MeV Si-ions in an optical grade single crystal diamond of mm3 (ElementSix (R)). Sample irradiation was carried out at the electrostatic deflector facility (DEFEL) of the LABEC accelerator laboratory in Florence. The ultrafast voltage transitions of the deflector allow ions to be transmitted downstream and implanted in the sample. The mean number of ions per bunch can be very small, even less than one particle per bunch. Targets are mounted inside a vacuum chamber on a frame, where step motors drive their displacements ( 20 cm) with a reproducibility within few microns.Palla et al. (2015)
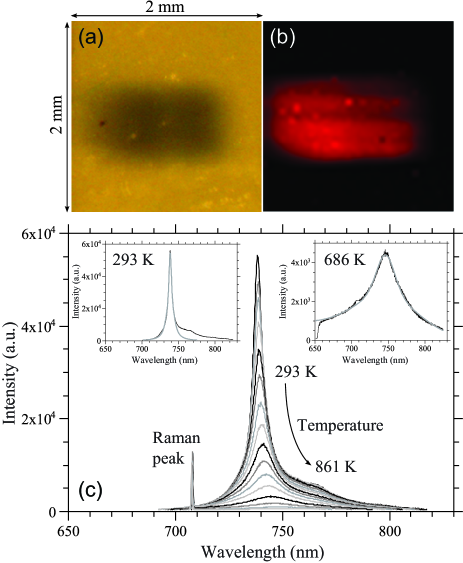
The size of the implanted area, defined by means of two pairs of slits placed about 50 cm before the sample along the ion beam line, is about mm2, with an uncertainty due mainly to the divergence of the beam, which is about 0.3 mrad. The irradiation fluence was evaluated to be cm-2. The implantation depth distribution, calculated with the Monte Carlo SRIM code,Ziegler, Biersack, and Littmark (1985) is peaked at 2.1 m, with a FWHM of 100 nm, thus the average volumetric density around the Bragg peak is around cm-3. After irradiation, the sample presents a strong darkening due to the high density of defects induced by irradiation (a photographic image of the implanted sample taken before annealing is shown in Fig. 1a).
In order to obtain optical activation of the SiV- centers, the sample was annealed for 1 h at 1100∘ C in reducing atmosphere (Ar + 2% H2). After annealing an almost complete recovery of the transparency of the sample was obtained, due to high temperature mobility of the defects, which favors both the recombination of the Frenkel couples and the formation of the SiV- color centers.Pezzagna et al. (2011) A fluorescence map acquired at 293 K is shown in Fig. 1b.
The luminescence properties of the SiV- centers were studied by excitation with the 647 nm line of a Kr ion laser, collecting the back-diffused luminescent signal in confocal configuration through a micro-objective with NA=0.28 and analyzing it by means of a single monocromator equipped with a notch filter and with a 300 lines/mm grating followed by a charge-coupled device (CCD) detector. The instrumental resolution of the system is 0.3 nm in the range from 650 to 820 nm. The transversal spatial resolution is 2 m and the depth of field is about 15 m, which makes possible collecting luminescence maps with micrometric resolution.
The sample was placed in a water-cooled high-vacuum chamber and heated by a helicoidal heater wound around a copper holder to probe temperatures up to 861 K. The temperature of the sample was measured by a thermocouple placed on the holder a few millimeters apart. A fused silica window allows both excitation and observation of the sample. In all the measurements, the power of the excitation beam was kept constant to 36 1 mW, estimated taking into account the losses for reflection both on the fused silica window and on the diamond surface.111Some percent of variation of the integrated signal was observed for movements along the sample of the order of a few micrometers. Consequently, since during the temperature ramp a slight displacement due to the thermal expansion of the holder takes place, at each change of temperature great attention was devoted to the maximization of the luminescent signal in the direction of the optical axis () and to the tracking of the position of the measurement point in the plane. Moreover, measurements were taken and averaged on a matrix of points with a pitch of 2 m, to make sure that the center of the original measurement point was included in the measurement area. A series of data at room temperature were also obtained at different power levels, in order to evaluate the saturation power.
Figure 1c shows the spectra acquired at different temperatures from 293 to 861 K. We observed a main peak centered between 738 and 751 nm, which can be ascribed to the luminescent of the SiV- center, and the diamond Raman signal. The central frequency, FWHM and amplitude of the signal show modifications as temperature changes. A significant broadening of the luminescence curve occurs with the temperature increase, so that the long-wavelength tail of the spectrum exceeds the limit of the observation window, especially at high temperatures. In order to take into account the tails, the fluorescence peaks were fitted with a pseudo-Voigt distribution added to a linear background. The overall luminescent signal has been evaluated as the sum of the the area of the fitted pseudo-Voigt and of the phonon sideband contribution. It has been found that beyond about 700 K the pseudo-Voigt distribution fits quite well the spectrum in all the range (excluding the Raman peak of diamond, see also the insets of Fig. 1c).
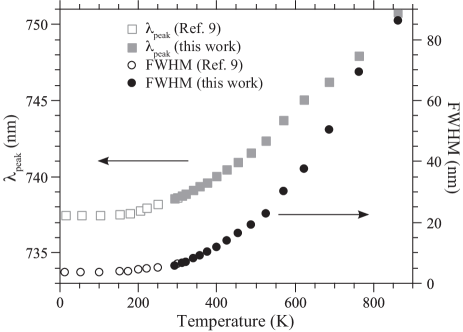
Figure 2 shows the temperature dependence of the central wavelength of the luminescence peak and the FWHM of the fitted pseudo-Voigt distribution. These are in excellent agreement with those observed by Feng and Schwartz,Feng and Schwartz (1993) confirmed also by Neu et al.Neu et al. (2013) from cryogenic to room temperatures. The red shift, in particular, seems to be related to the shrink of the diamond band-gap,Liu et al. (2000) which is likely to determine a change in the transition frequency of the deep levels inside the band-gap.
Figure 3 shows the behaviour of the integrated luminescence signal with temperature (dots) along with the fit obtained with a model described below. The quenching of the luminescence with increasing temperatures can be explained assuming that a transition from the excited state occurs with an activation energy . A large ensemble of different mechanisms leads to a same functional dependence on temperature of the fluorescence , so that the quenching at high temperatures can be expressed asFeng and Schwartz (1993)
| (1) |
where is the fluorescence at 0 K, is a factor that depends on the model and is the Boltzmann konstant. Figure 3 compares the experimental dependence on temperature of the integrated luminescence with Eq. (1), showing very good agreement.
In order to better understand the photophysics of the SiV- center, we explicitly take into account saturation effects within a four-level scheme that will be introduced later in more details (see the inset of Fig. 3 and Appendix A). From the solution of the rate equations at equilibrium combined we obtain the following expressions for and in Eq. (1)
| (2) |
Here, is a constant, is the saturation intensity at low temperatures, is the saturation power and is an onset excitation power corresponding to the quenching at low-excitation levels (see Appendix A for details). All these parameters depend both on the rate constants of the system and on the coupling efficiency between the individual center and the exciting radiation.
Experimental investigations performed on individual SiV- centers,Neu, Agio, and Becher (2012) in order to evaluate the characteristic rate constants of radiative and non-radiative transitions, show that these are subject to considerable variations, presumably due to different local environmental conditions. Nevertheless, the comparison of Eq. (1) with our experimental data, obtained from a large number of centers, can lead to useful considerations about the average signal.
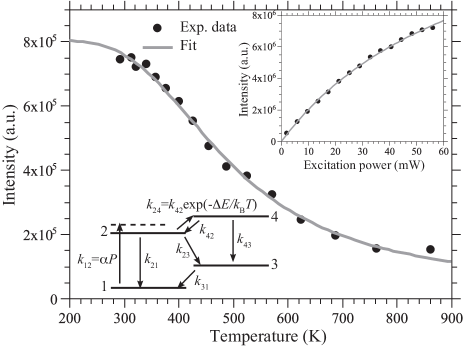
The inset in Fig. 3 shows the observed behavior of the integrated luminescence as a function of the excitation power at 293 K. The sublinear behavior of the luminescence with increasing power can be accounted for assuming at room temperature. From the fit of the data it results that mW. Moreover, the fluorescence intensity versus temperature is well fitted by Eq. (1) with and free parameters, which result to be meV and (at the power mW). Such a high value of can serve as a discriminator between different alternative models of the quenching mechanism.
For instance, if one assumes the simplest possible mechanism based on three levels (see Appendix B): the ground (1) and the excited level (2) at 1.68 eV, plus a third level (3) decaying to the ground state and placed 0.18 eV above the excited level, the results are not compatible with the experimental numerical values. Indeed, the form of the constant becomes , were is the rate constant between the and the state. Here, the ratio would be comprised between 1 and , which is unlikely exceeding 1, given the strength of the radiative transition . Thus, is hardly exceeding 1 in this scheme, to be compared with of our fit.
On the other hand, a shelving state (3) placed below the level 2 is assumed to explain the bounching behavior for large correlation times of SiV- centers as single photon emitters,Neu, Agio, and Becher (2012) and a higher energy state radiatively bounded to the shelving state is invoked to give account of the de-shelving observed at high excitation powers.
It is then more conceivable a scheme with a shelving state (3) and a fourth level (4), radiatively connected with the shelving state, placed at 0.18 eV above the state (2), as shown in the inset of Fig. 3, being the transitions , and optically forbidden. The inversion symmetry of the D3d point group implies indeed that the state functions of the SiV- have definite parity, giving a whole set of forbidden transitions of this kind.Gali and Maze (2013) In this case, the constant assumes a quite complicated form, which simplifies, in the case that the rates and are much smaller than (as in Ref. Neu, Agio, and Becher, 2012) in the following one: .
Assuming that and referring to the average values of , , reported in Ref. Neu, Agio, and Becher, 2012 (see table in the Appendix A.1), we obtain . Since the ratio is small compared with unity and given the fitted value of mW, the factor is approximately 0.32 and the product results , which has the correct order of magnitude.
The possible emission corresponding to the transition is governed by an equation of the kind
| (3) |
which gives a negligible signal at room temperature and also at 800 K does not exceed 1% of the at room temperature.
In conclusion, we discovered that the integrated luminescence of the SiV- color center is still strong at temperatures as high as 500 K, with a FWHM which remains lower than 20 nm. We attributed such a relatively weak decrease of the fluorescence signal with increasing temperature to population transfer to a shelving state, enhanced by a transition channel with an activation energy of 180 meV. Our findings provide distinct information on the optical properties of the SiV-, which may be relevant for developing light-emitting devices that operate at high temperatures, and encourage further investigations of color centers in diamond under such experimental conditions.
Financial support from the EC Seventh Framework Programme (248855), the Helmoltz Association (283286) and the Ministry of Education and Science of the Russian Federation (16.19.2014/K) is gratefully acknowledged. The authors would like to thank K. De Hanstetters and S. Orlanducci for helpful conversations and for providing diamond samples, L. Ulivi for the use of the annealing chamber.
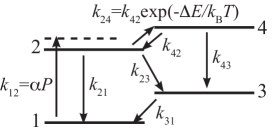
Appendix A Four-level scheme
The model referred to in the main text is described by the following four-level scheme
The rate equations, at equilibrium, read
| (4) | |||||
| (5) | |||||
| (6) | |||||
| (7) |
The first three equations describe the stationary populations of the levels 2, 3 and 4, the last one normalizes the sum of the occupation probability of the four levels.
We assume , because the vibrationally excited states populated by the exciting radiation are kept weakly populated by fast thermal de-excitation to the level 2, avoiding stimulated emission and saturation on the pumping transition. The ratio of the two thermal transition rates and is fixed to the Boltzmann factor by detailed balance consideration, giving where is the activation energy of the transition and is the Boltzmann constant.
Solving the system of rate equations we found that the occupation of the level 2, proportional to the luminescence intensity, is given by
| (8) |
which corresponds to Eq. (1) of the main text. The constants , , e are bounded to the rate constants by the following relations
| (9) | |||||
| (10) | |||||
| (11) | |||||
| (12) |
The transition energy ( meV) has the same order of magnitude of the diamond optical phonon energy (165 meV),Schwoerer-Böhning, Macrander, and Arms (1998) which makes plausible the inequality . The transition , on the other hand, is optically forbidden, thus . As a consequence , which is the approximation referred to in the main text.
Another constant referred to in the main text is the ratio
| (13) |
Under the above mentioned hypothesis, , and considering , which results from the data reported in Ref. Neu, Agio, and Becher, 2012 and reproduced in Tab. 1, this ratio reduces to , given in the main text.
If the transition is optical, which could be the case if the levels 1 and 3 had opposed parity with respect to the levels 2 and 4, one can wonder if a thermally enhanced luminescent signal from transition could be detected. This is probably not the case, inasmuch the population of the level 4 (according to the third rate equation) is proportional to according to the constant . Consequently, considering the signal at the zero-phonon line (ZPL) of the 738 nm transition to be proportional to and the hypothetical signal from the transition to be proportional to , one finds that the two signals should be in the ratio
| (14) |
The Boltzman factor in the previous equation is negligible at room temperature and at the highest temperatures experimented, when it reaches the value 0.085, the 738 nm luminescence is so low to make unlikely the detection of a signal more than 10 times lower.
One can extend the calculations above to the case in which the transition is permitted (as assumed, for example, in Ref. Neu, Agio, and Becher, 2012) adding a finite transition rate and writing the third rate equation of the system as
| (15) |
In this case, the constant is written in the following way:
| (16) |
If the thermal transition rate is much greater not only than (as assumed earlier) but also of , we will have as in the previous case. The ratio on the other hand, is now given by
| (17) |
giving again .
A.1 Experimental rate constants
| 4408 | 137 | 0.27 | 32.1 |
| 3424 | 24.6 | 1.7 | 130.2 |
| 771 | 23.6 | 0.35 | 32.2 |
| 1084 | 31.7 | 0.12 | 34.1 |
| 1545.1 | 17.4 | 1 | 84.0 |
| 770.1 | 11.1 | 0.81 | 64.7 |
| 1053.6 | 21.7 | 0.13 | 48.3 |
| 3479 | 92.6 | 0.82 | 37.2 |
| 161 | 7.3 | 0.24 | 21.4 |
| 1638 | 1.5 | 0.16 | 986.7 |
| 2487 | 12.5 | 0.15 | 196.6 |
| 1181.7 | 1.8 | 0.23 | 582.1 |
| 798.8 | 34.6 | 0.24 | 22.9 |
| 1076 | 13.3 | 0.32 | 79.0 |
Appendix B Three-level scheme
A much simpler model referred to in the main text is given by the two levels 1 and 2 plus a third one decaying to the ground state and populated by thermal stimulation from the level 2 (see Fig. 5).
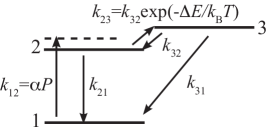
The solution of the rate equations gives a dependence of the population on temperature and power of the same kind described by Eq. (8), but with the following parameters ; ; and . As already mentioned in the main text, the value of , which cannot exceed unity, is hardly compatible with the values suggested by the fit of the experimental data.
References
- Willander et al. (2006) M. Willander, M. Friesel, Q.-U. Wahab, and B. Straumal, J. Mater. Science: Materials in Electronics 17, 1 (2006).
- Lohrmann et al. (2011) A. Lohrmann, S. Pezzagna, I. Dobrinets, P. Spinicelli, V. Jacques, J.-F. Roch, J. Meijer, and A. M. Zaitsev, Appl. Phys. Lett. 99, 251106 (2011).
- Mizuochi et al. (2012) N. Mizuochi, T. Makino, H. Kato, D. Takeuchi, M. Ogura, H. Okushi, M. Nothaft, P. Neumann, A. Gali, F. Jelezko, J. Wrachtrup, and S. Yamasaki, Nat. Photon. 6, 299 (2012).
- Berhane et al. (2015) A. M. Berhane, S. Choi, H. Kato, T. Makino, N. Mizuochi, S. Yamasaki, and I. Aharonovich, Appl. Phys. Lett. 106, 171102 (2015).
- Lohrmann et al. (2015) A. Lohrmann, N. Iwamoto, Z. Bodrog, S. Castelletto, T. Ohshima, T. Karle, A. Gali, S. Prawer, J. McCallum, and B. Johnson, Nat. Commun. 6, 7783 (2015).
- Gabrysch et al. (2008) M. Gabrysch, S. Majdi, A. Hallén, M. Linnarsson, A. Schöner, D. Twitchen, and J. Isberg, Phys. Stat. Sol. (a) 205, 2190 (2008).
- Stenger et al. (2013) I. Stenger, M.-A. Pinault-Thaury, T. Kociniewski, A. Lusson, E. Chikoidze, F. Jomard, Y. Dumont, J. Chevallier, and J. Barjon, J. Appl. Phys. 114, 073711 (2013).
- Pezzagna et al. (2011) S. Pezzagna, D. Rogalla, D. Wildanger, J. Meijer, and A. Zaitsev, New J. Phys. 13, 035024 (2011).
- Feng and Schwartz (1993) T. Feng and B. D. Schwartz, J. Appl. Phys. 73, 1415 (1993).
- Gorokhovsky et al. (1995) A. A. Gorokhovsky, A. V. Turukhin, R. R. Alfano, and W. Phillips, Appl. Phys. Lett. 66, 43 (1995).
- Neu et al. (2013) E. Neu, C. Hepp, M. Hauschild, S. Gsell, M. Fischer, H. Sternschulte, D. Steinmüller-Nethl, M. Schreck, and C. Becher, New J. Phys. 15, 043005 (2013).
- Neu, Agio, and Becher (2012) E. Neu, M. Agio, and C. Becher, Opt. Express 20, 19956 (2012).
- Palla et al. (2015) L. Palla, C. Czelusniak, F. Taccetti, L. Carraresi, L. Castelli, M. Fedi, L. Giuntini, P. Maurenzig, L. Sottili, and N. Taccetti, European Phys. J. Plus 130, 39 (2015), 10.1140/epjp/i2015-15039-y.
- Ziegler, Biersack, and Littmark (1985) J. Ziegler, J. Biersack, and U. Littmark, The Stopping and Range of Ions in Solids, Stopping and ranges of ions in matter (Pergamon, 1985).
- Note (1) Some percent of variation of the integrated signal was observed for movements along the sample of the order of a few micrometers. Consequently, since during the temperature ramp a slight displacement due to the thermal expansion of the holder takes place, at each change of temperature great attention was devoted to the maximization of the luminescent signal in the direction of the optical axis () and to the tracking of the position of the measurement point in the plane. Moreover, measurements were taken and averaged on a matrix of points with a pitch of 2 m, to make sure that the center of the original measurement point was included in the measurement area.
- Liu et al. (2000) M. S. Liu, L. A. Bursill, S. Prawer, and R. Beserman, Phys. Rev. B 61, 3391 (2000).
- Gali and Maze (2013) A. Gali and J. R. Maze, Phys. Rev. B 88, 235205 (2013).
- Schwoerer-Böhning, Macrander, and Arms (1998) M. Schwoerer-Böhning, A. T. Macrander, and D. A. Arms, Phys. Rev. Lett. 80, 5572 (1998).