Discovery of Five Candidate Analogs for Carinae in Nearby Galaxies
Abstract
The late-stage evolution of very massive stars such as Carinae may be dominated by episodic mass ejections which may later lead to Type II superluminous supernova (SLSN-II; e.g., SN 2006gy). However, as long as Car is one of a kind, it is nearly impossible to quantitatively evaluate these possibilities. Here we announce the discovery of five objects in the nearby ( Mpc) massive star-forming galaxies M 51, M 83, M 101 and NGC 6946 that have optical through mid-IR photometric properties consistent with the hitherto unique Car. The Spitzer mid-IR spectral energy distributions of these objects rise steeply in the bands, then turn over between and , indicating the presence of warm ( K) circumstellar dust. Their optical counterparts in HST images are dex fainter than their mid-IR peaks and require the presence of of obscuring material. Our finding implies that the rate of Car-like events is a fraction ( at 90% confidence) of the core-collapse supernova (ccSN) rate. If there is only one eruption mechanism and SLSN-II are due to ccSN occurring inside these dense shells, then the ejection mechanism is likely associated with the onset of carbon burning ( years) which is also consistent with the apparent ages of massive Galactic shells.
1 Introduction
The last stages of the evolution of the most massive (M M⊙) stars may be dominated by episodic large mass-ejections (e.g., Humphreys & Davidson 1984; Smith 2014). This leads to dust condensing out of the ejecta, obscuring the star in the optical but revealing it in the mid-infrared (mid-IR) as the absorbed UV and optical photons are re-emitted at longer wavelengths (e.g., Kochanek et al. 2012). The best known example is Carinae ( Car) which contains one of the most massive (100-150 ) and most luminous () stars in our Galaxy (e.g., Robinson et al. 1973). Its Great Eruption in the mid-1800s led to the ejection of of material (Smith et al. 2003) now seen as a dusty nebula around the star. While ongoing studies are helping us further analyze the Great Eruption (see, e.g., Rest et al. 2012; Prieto et al. 2014), deciphering the rate of such events and their consequences is challenging because no analog of this extraordinary laboratory for stellar astrophysics (in terms of stellar mass, luminosity, ejecta mass, time since mass ejection etc.) has previously been found.
A related puzzle is the existence of the Type II superluminous supernovae (SLSN-II) that are plausibly explained by the SN ejecta colliding with a massive shell of previously ejected material (e.g., SN 2006gy; Smith et al. 2007). A number of SNe, such as the Type Ib SN 2006jc (Pastorello et al. 2007) and the Type IIn SN 2009ip (e.g., Mauerhan et al. 2012; Prieto et al. 2012; Pastorello et al. 2013), have also shown transients that could be associated with mass ejections shortly prior to the final explosion. But the relationship between these transients and Car or other LBVs surrounded by still older, massive dusty shells (e.g., Smith & Owocki 2006) is unclear.
There are presently no clear prescriptions for how to include events like the Great Eruption into theoretical models. Even basic assumptions — such as whether the mass loss is triggered by the final post-carbon ignition phase as suggested statistically by Kochanek et al. (2012) or by an opacity phase-transition in the photosphere (e.g., Vink et al. 1999) or by interactions with a binary companion (e.g., Soker 2005) — are uncertain. Studies of possible mass-loss mechanisms (e.g., Shiode & Quataert 2014) are unfortunately non-prescriptive on either rate or outcome. Observationally, we are limited by the small numbers of high mass stars in this short evolutionary phase and searching for them in the Galaxy is complicated by having to look through the crowded, dusty disk and distance uncertainties. Obtaining a better understanding of this phase of evolution requires exploring other galaxies.
We demonstrated in Khan et al. (2010, 2011, 2013) that searching for extragalactic self-obscured stars utilizing Spitzer images is feasible, and in Khan et al. (2015a) we isolated an emerging class of 18 candidate self-obscured stars with (-) in galaxies at Mpc. We have now expanded our search to the large star-forming galaxies M 51, M 83, M 101 and NGC 6946 (distance Mpc). We picked these galaxies because they have high star formation rates (total yr, mainly based on Kennicutt et al. 2008) and hosted significant numbers of core-collapse supernovae (ccSNe) over the past century (total 20, e.g., Botticella et al. 2012), indicating that they are likely to host a significant number of evolved high mass stars.
In this letter, we announce the discovery of five objects in these galaxies that have optical through mid-IR photometric properties consistent with the hitherto unique Car as it is presently observed. In what follows, we describe our search method (Section 2), analyze the physical properties of the five potential Car analogs (Section 3) and consider the implications of our findings (Section 4).
2 The Car Analog Candidates
At extragalactic distances, an Car analog would appear as a bright, red point-source in Spitzer IRAC (Fazio et al. 2004) images, with a fainter optical counterpart due to self-obscuration. Given enough absorption, the optical counterpart could be undetectable. Building on our previous work (Khan et al. 2011, 2013, 2015a, 2015b), we relied on these properties to identify the Car analog candidates. For M 51 (D Mpc, Ferrarese et al. 2000), M 83 (D Mpc, Saha et al. 2006) and M 101 (D Mpc, Shappee & Stanek 2011) we used the full Spitzer mosaics available from the Local Volume Legacy Survey (LVL, Dale et al. 2009), and for NGC 6946 (D Mpc, Sahu et al. 2006) we used those from the Spitzer Infrared Nearby Galaxies Survey (SINGS, Kennicutt et al. 2003).
We built Vega-calibrated IRAC and MIPS (Rieke et al. 2004) point-source catalogs for each galaxy following the procedures described in Khan et al. (2015b). We use PSF photometry at and , a combination of PSF and aperture photometry (preferring PSF) at , and only aperture photometry at and as the PSF size and PAH emission both increase toward longer wavelengths. For all sources, we determine the spectral energy distribution (SED) slope (), the total IRAC luminosity () and the fraction of that is emitted in the first three IRAC bands. Following the selection criteria established in Khan et al. (2013) — L⊙, and — we initially selected sources from our mid-IR point-source catalogs.
We examined the IRAC images to exclude the sources associated with saturated, resolved or foreground objects, and utilized the VizieR111http://vizier.u-strasbg.fr/ web-service to rule out spectroscopically confirmed non-stellar sources and those with high proper motions. We inspected the SEDs of the remaining sources to identify the ones that most closely resemble the SED of Car and then queried the Hubble Source Catalog (HSC222https://archive.stsci.edu/hst/hsc/search.php, Version 1) to exclude those with bright optical counterparts (m mag, implying ). These steps produced a short-list of sources for which we retrieved archival HST images and the associated photometry from the Hubble Legacy Archive (HLA333http://hla.stsci.edu/). Since the HST and Spitzer images sometimes have significant () astrometric mismatches, we utilized the IRAF GEOMAP and GEOXYTRAN tasks to locally align the HST and Spitzer images with uncertainties . We then searched for the closest optical counterpart within a matching radius of .
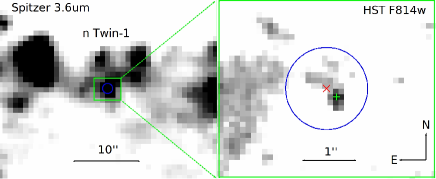
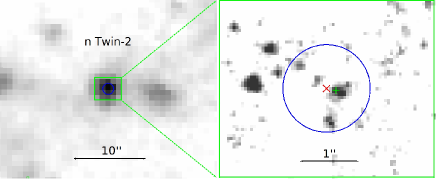
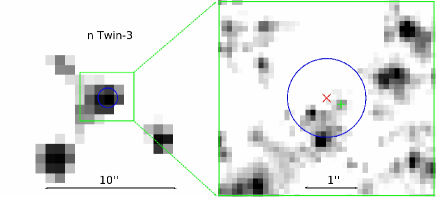
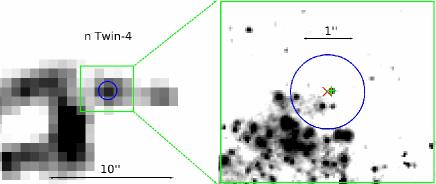
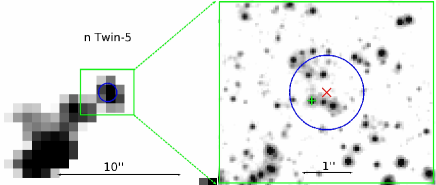
We identified five sources with mid-IR SEDs closely resembling that of Car and optical fluxes or flux limits dex fainter than their mid-IR peaks. We will refer to these sources as Twins-1, 2, 3, 4 and 5. We find one source each in M 51 ( Twin-1), M 101 ( Twin-2) and NGC 6946 ( Twin-3), and two sources in M 83 ( Twins-4, 5). We identified HST counterparts of Twins-1, 2 and 4 within the matching radius. For Twin-3, no HST source is cataloged within the matching radius, so we visually identified the closest location of flux excess at , and used simple aperture photometry techniques to measure the -band flux and the and band flux upper limits. For Twin-5, although a cataloged HST source exists within the matching radius, we selected a different source at as the more likely photometric match because it is also a bright HST -band source. Table 1 lists the photometry of these sources, Figure 1 shows their IRAC and HST -band images, and Figure 2 shows their SEDs. Twins-1, 4 and 5 are H emitters and Twin-2 is a UV source (see Table 1).
We have variability data for M 51, M 101 and NGC 6946 from the LBC survey for failed supernovae (Gerke et al. 2014). We analyzed 21/26/37 epochs of data spanning a 7.1/7.2/8 year period for M 51/M 101/NGC 6946 with the ISIS image subtraction package (Alard & Lupton 1998). We did not detect any significant optical variability at the locations of Twins-1, 2 or 3.
Cutri et al. (2012) identified Twin-2 as a WISE point source and we use their flux measurement as an upper limit for SED models (Section 3). Johnson et al. (2001) reports an optically thick free-free radio source located from Twin-3 and Hadfield et al. (2005) identified a source with Wolf-Rayet spectroscopic signature from Twin-4. We could not confirm if these sources are reasonable astrometric matches to the IRAC locations. Twins-4 and 5 were cataloged by Williams et al. (2015) but not flagged as massive stars.
3 SED Modeling
We fit the SEDs of these five sources using DUSTY (Ivezic & Elitzur 1997) to model radiation transfer through a spherical medium surrounding a blackbody source, which is also a good approximation for a combination of unresolved non-spherical/patchy/multiple circumstellar shells. We considered models with either graphitic or silicate dust (Draine & Lee 1984). The models are defined by the stellar luminosity (), stellar temperature (), -band optical depth (), dust temperature at the inner-edge of the shell () and shell thickness . We embedded DUSTY inside a Markov Chain Monte Carlo (MCMC) driver to fit each SED by varying , , and with determined by a fit for each model. We fix since its exact value has little effect on the results (Khan et al. 2015a), limit to a maximum value of K, set the minimum flux uncertainty to (0.1 magnitude) and do not account for distance uncertainties.
The best fit model parameters determine the radius of the inner edge of the stellar-ejecta distribution (). The mass of the shell is (scaled to a visual opacity of cmg) and the age estimate for the shell is (scaled as km s-1) where we can ignore to zeroth order. Table 2 reports the parameters of the best fit models and Figure 2 shows these models. The integrated luminosity estimates depend little on the choice of dust type, and are in the range of . We also fit the SEDs using Castelli & Kurucz (2004) stellar atmosphere models instead of blackbodies. Since these resulted in similar parameter estimates, we only report the blackbody results.
Generally, the best fits derived for graphitic dust require lower optical depths, lower dust temperatures and larger shell radii, leading to higher ejecta masses and age estimates. For Twins-2 and 4, the stellar temperature estimates reach the allowed maximum of K. The best fit models of Twin-1 and 5 also require the presence of a hot star, but with temperatures lower than the allowed maximum ( K and K for graphitic/silicate dust). Constrained by the low optical flux, the best fit models of Twin-3 require the presence of a cool star (K). For Twins-2, 4 and 5, the best fits derived for graphitic dust had lower , and for for Twins-1 and 3 the best fits derived for silicate dust have lower . Considering these models, the Car analog candidates appear to be embedded in of warm ( K) obscuring material ejected a few centuries ago.
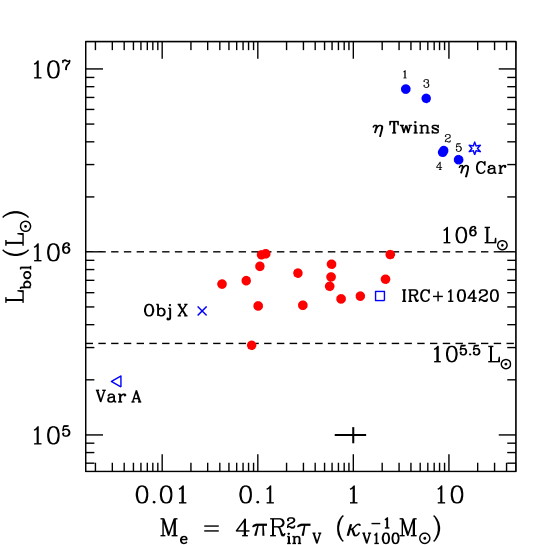
Figure 3 contrasts the bolometric luminosities and ejecta mass estimates of these five objects with the relatively less luminous sources we identified in Khan et al. (2015a). The five new sources form a distinct cluster close to Car in the parameter space, whereas the previously identified dusty-star candidates from Khan et al. (2015a) are more similar to the Galactic OH/IR star IRC+10420 (e.g., Tiffany et al. 2010) or M 33’s Variable A (e.g., Humphreys et al. 1987).
4 Discussion
To an extragalactic observer located in one of the targeted galaxies surveying the Milky Way with telescopes similar to the HST and Spitzer, Car’s present day SED would appear nearly identical to the extragalactic Car analog candidates we found. The Carina nebula is in extent (Smith & Brooks 2007) corresponding to at our most distant galaxy (M 51 at 8 Mpc). While this would not be resolved by Spitzer, it would be easily resolved by HST. Because more compact clusters are not uncommon, in Khan et al. (2013) we considered whether dusty clusters can hide Car like stars and if we would confuse unresolved star-clusters with Car analogs. In general, a cluster sufficiently luminous to hide an evolved star has hosted many luminous stars with strong UV radiation fields and winds, which will generally clear the cluster of the gas and dust needed to produce strong mid-IR emission over the timescale that even the most massive star needs to evolve away from the main sequence. Moreover, emission from warm circumstellar ejecta peaks between the IRAC and MIPS bands and then turns over, as seen in all of our candidates, unlike emission from colder intra-cluster dust that generally peaks at longer wavelengths.
A significant majority of massive stars are expected to be in multiple-star systems (e.g., Sana & Evans 2011), as is the case for Car (e.g., Damineli 1996; Mehner et al. 2010). This is a minor complication, affecting luminosity estimates by at most a factor of , and mass estimates even less. Assuming all the candidates we have identified are real analogs of Car, then our galaxy sample (including the Milky Way) contains Car-like stars. Based on the ratio of star formation rates ( vs. yr), our original sample of galaxies would be expected to have Car analog, which is statistically consistent with not finding one in Khan et al. (2015a).
If we expand our simple rate estimates from Khan et al. (2015a), our sources implies an eruption rate over the galaxies ( previous, in this work, and the Milky Way) of yr-1 (yryr-1 at 90% confidence) where yrs is a rough estimate of the period over which our method would detect an Car-like source. For comparison, the number of ccSN recorded in these galaxies over the past 30 years is (mainly based on Botticella et al. 2012) for an SN rate of yr. This implies that the rate of Car-like events is a fraction ( at 90% confidence) of the ccSNe rate.
If there is only one eruption mechanism and the SLSN-II are due to ccSN occurring inside these dense shells, then the ratio of the rate of Car-like events and SLSN-II, , is the ratio of the time period during which the shell is close enough to the star to cause a SLSN to the time period over which shell ejections occur. With of the core-collapse rate (Quimby et al. 2013), we must have that . A typical estimate is that to years, which implies to years, consistent with the properties of the massive shells around luminous stars observed in our own Galaxy and suggesting that the instabilities driving the eruptions are linked to the onset of carbon burning (Kochanek 2011). This would also imply the existence of “superluminous” X-ray ccSN, where an older shell of material is too distant and low density to thermalize the shock heated material but is still dense enough for the cooling time to be faster than the expansion time. Such events should be times more common than optical SLSN-II. If the eruptions driving SLSN-II are only associated with later and shorter burning phases (e.g., as in Shiode & Quataert 2014) then there must be two eruption mechanisms and the vast majority of Car analogs will not be associated with the SLSN-II mechanism.
We identified the potential Car analogs by specifically focusing on finding sources that most closely resemble the SED of present day Car. The reason that the SEDs of these five sources are so remarkably similar to each other is by design. We have not closely studied the less luminous mid-IR sources that may belong to the class of candidate self-obscured stars we identified in Khan et al. (2015a), and some of the sources that we excluded because they have relatively bright optical counterparts may be evolved high mass stars with older, lower optical-depth shells. It is readily apparent that a closer scrutiny of our mid-IR catalogs should reveal richer and more diverse populations of evolved massive stars. This in turn will let us better quantify the abundance of those stars, and constrain the rates of mass ejection episodes and mass loss from massive stars prior to their death by core-collapse.
The Car analog candidates we identified can be studied at greater detail with the James Webb Space Telescope (JWST, e.g., Gardner et al. 2006), taking advantage of its order-of-magnitude-higher spatial resolution. These sources are luminous in the wavelength range where the JWST will be most sensitive. They are rare laboratories for stellar astrophysics and will be very interesting extragalactic stellar targets for spectroscopic study with JWST’s mid-IR instrument (MIRI, Rieke et al. 2015). This will give us an unprecedented view of these most-massive self-obscured stars, letting us study their evolutionary state and the composition of their circumstellar ejecta.
References
- Alard & Lupton (1998) Alard, C. & Lupton, R. H. 1998, ApJ, 503, 325
- Botticella et al. (2012) Botticella, M. T., Smartt, S. J., Kennicutt, R. C., et al. 2012, A&A, 537, A132
- Castelli & Kurucz (2004) Castelli, F., & Kurucz, R. L. 2004, arXiv:astro-ph/0405087
- Cutri et al. (2012) Cutri, R. M. et al. 2012, VizieR Online Data Catalog, 2311, 0
- Dale et al. (2009) Dale, D. A. et al. 2009, ApJ, 703, 517
- Damineli (1996) Damineli, A. 1996, ApJ, 460, L49
- Draine & Lee (1984) Draine, B. T. & Lee, H. M. 1984, ApJ, 285, 89
- Fazio et al. (2004) Fazio, G. G. et al. 2004, ApJS, 154, 10
- Ferrarese et al. (2000) Ferrarese, L., Mould, J. R., Kennicutt, R. C., Jr., et al. 2000, ApJ, 529, 745
- Gardner et al. (2006) Gardner, J. P. et al. 2006, SSR, 123, 485
- Gerke et al. (2014) Gerke, J. R., Kochanek, C. S., & Stanek, K. Z. 2015, MNRAS, 450, 3289
- Hadfield et al. (2005) Hadfield, L. J., Crowther, P. A., Schild, H., & Schmutz, W. 2005, A&A, 439, 265
- Humphreys & Davidson (1984) Humphreys, R. M. & Davidson, K. 1984, Science, 223, 243
- Humphreys et al. (1987) Humphreys, R. M., Jones, T. J., & Gehrz, R. D. 1987, AJ, 94, 315
- Ivezic & Elitzur (1997) Ivezic, Z. & Elitzur, M. 1997, MNRAS, 287, 799
- Johnson et al. (2001) Johnson, K. E., Kobulnicky, H. A., Massey, P., & Conti, P. S. 2001, ApJ, 559, 864
- Kennicutt et al. (2003) Kennicutt, Jr., R. C. et al. 2003, PASP, 115, 928
- Kennicutt et al. (2008) —. 2008, ApJS, 178, 247
- Khan et al. (2010) Khan, R. et al. 2010, ApJ, 715, 1094
- Khan et al. (2011) Khan, R., Stanek, K. Z., Kochanek, C. S., & Bonanos, A. Z. 2011, ApJ, 732, 43
- Khan et al. (2013) Khan, R., Stanek, K. Z., & Kochanek, C. S. 2013, ApJ, 767, 52
- Khan et al. (2015a) Khan, R., Kochanek, C. S., Stanek, K. Z., & Gerke, J. 2015a, ApJ, 799, 187
- Khan et al. (2015b) Khan, R., Stanek, K. Z., Kochanek, C. S., & Sonneborn, G. 2015b, ApJS, 219, 42
- Kochanek (2011) Kochanek, C. S. 2011, ApJ, 743, 73
- Kochanek et al. (2012) Kochanek, C. S., Szczygieł, D. M., & Stanek, K. Z. 2012, ApJ, 758, 142
- Mauerhan et al. (2012) Mauerhan, J. C., Smith, N., Filippenko, A. V., et al. 2013, MNRAS, 430, 1801
- Mehner et al. (2010) Mehner, A., Davidson, K., Ferland, G. J., & Humphreys, R. M. 2010, ApJ, 710, 729
- Pastorello et al. (2007) Pastorello, A. et al. 2007, Nature, 447, 829
- Pastorello et al. (2013) Pastorello, A., Cappellaro, E., Inserra, C., et al. 2013, ApJ, 767, 1
- Prieto et al. (2012) Prieto, J. L., Brimacombe, J., Drake, A. J., & Howerton, S. 2013, ApJ, 763, L27
- Prieto et al. (2014) —. 2014, ApJ, 787, L8
- Quimby et al. (2013) Quimby, R. M., Yuan, F., Akerlof, C., & Wheeler, J. C. 2013, MNRAS, 431, 912
- Rest et al. (2012) Rest, A., Prieto, J. L., Walborn, N. R., et al. 2012, Nature, 482, 375
- Rieke et al. (2004) Rieke, G. H. et al. 2004, ApJS, 154, 25
- Rieke et al. (2015) Rieke, G. H., Wright, G. S., Böker, T., et al. 2015, PASP, 127, 584
- Robinson et al. (1973) Robinson, G., Hyland, A. R., & Thomas, J. A. 1973, MNRAS, 161, 281
- Saha et al. (2006) Saha, A. et al. 2006, ApJS, 165, 108
- Sahu et al. (2006) Sahu, D. K. et al. 2006, MNRAS, 372, 1315
- Sana & Evans (2011) Sana, H., & Evans, C. J. 2011, IAU Symposium, 272, 474
- Shappee & Stanek (2011) Shappee, B. J., & Stanek, K. Z. 2011, ApJ, 733, 124
- Shiode & Quataert (2014) Shiode, J. H., & Quataert, E. 2014, ApJ, 780, 96
- Smith et al. (2003) Smith, N., Gehrz, R. D., Hinz, P. M., et al. 2003, AJ, 125, 1458
- Smith & Owocki (2006) Smith, N. & Owocki, S. P. 2006, ApJ, 645, L45
- Smith & Brooks (2007) Smith, N. & Brooks, K. J. 2007, MNRAS, 379, 1279
- Smith et al. (2007) Smith, N., Li, W., Foley, R. J., et al. 2007, ApJ, 666, 1116
- Smith (2014) Smith, N. 2014, ARA&A, 52, 487
- Soker (2005) Soker, N. 2005, ApJ, 619, 1064
- Tiffany et al. (2010) Tiffany, C., Humphreys, R. M., Jones, T. J., & Davidson, K. 2010, AJ, 140, 339
- Vink et al. (1999) Vink, J. S., de Koter, A., & Lamers, H. J. G. L. M. 1999, A&A, 350, 181
- Williams et al. (2015) Williams, S. J., Bonanos, A. Z., Whitmore, B. C., Prieto, J. L., & Blair, W. P. 2015, A&A, 578, A100
| Twin-1 | Twin-2 | Twin-3 | Twin-4 | Twin-5 | |
|---|---|---|---|---|---|
| Host | M 51 | M 101 | NGC 6946 | M 83 | M 83 |
| RA (deg) | |||||
| Dec (deg) | |||||
| … | … | … | … | ||
| … | |||||
| … | … | ||||
| … | … | ||||
| … | … | … | … | ||
| … | … | … | … | ||
| … | … | … | … | ||
| … | … | … | … | ||
.
 |
 |
 |
 |
 |
| ID | ||||||||||
| (K) | (K) | (cm) | () | () | (years) | |||||
| Graphitic | ||||||||||
| Twin-1 | ||||||||||
| Twin-2 | ||||||||||
| Twin-3 | ||||||||||
| Twin-4 | ||||||||||
| Twin-5 | ||||||||||
| Silicate | ||||||||||
| Twin-1 | ||||||||||
| Twin-2 | ||||||||||
| Twin-3 | ||||||||||
| Twin-4 | ||||||||||
| Twin-5 | ||||||||||