Impact of supernova and cosmic-ray driving on the surface brightness of the galactic halo in soft X-rays
Abstract
The halo of the Milky Way contains a hot plasma with a surface brightness in soft X-rays of the order erg cm-2 s-1 deg-2. The origin of this gas is unclear, but so far numerical models of galactic star formation have failed to reproduce such a large surface brightness by several orders of magnitude. In this paper, we analyze simulations of the turbulent, magnetized, multi-phase interstellar medium including thermal feedback by supernova explosions as well as cosmic-ray feedback. We include a time-dependent chemical network, self-shielding by gas and dust, and self-gravity. Pure thermal feedback alone is sufficient to produce the observed surface brightness, although it is very sensitive to the supernova rate. Cosmic rays suppress this sensitivity and reduce the surface brightness because they drive cooler outflows. Self-gravity has by far the largest effect because it accumulates the diffuse gas in the disk in dense clumps and filaments, so that supernovae exploding in voids can eject a large amount of hot gas into the halo. This can boost the surface brightness by several orders of magnitude. Although our simulations do not reach a steady state, all simulations produce surface brightness values of the same order of magnitude as the observations, with the exact value depending sensitively on the simulation parameters. We conclude that star formation feedback alone is sufficient to explain the origin of the hot halo gas, but measurements of the surface brightness alone do not provide useful diagnostics for the study of galactic star formation.
1. Introduction
It has long been known that the halo of the Milky Way contains a hot, diffuse plasma that can be observed in soft X-rays (e.g. Burrows & Mendenhall, 1991; Wang & Yu, 1995; Pietz et al., 1998; Snowden et al., 1998; Kuntz & Snowden, 2000; Smith et al., 2007; Henley & Shelton, 2010). Most recently, Henley & Shelton (2013) obtained XMM-Newton observations at energies of –keV for 110 sightlines and inferred the X-ray temperature and surface brightness. They found the surface brightness to vary by one order of magnitude –erg cm-2 s-1 deg-2, while the temperature had a rather constant value around K.
What produces this hot halo gas is currently not clear. Two main processes have been dicussed, namely winds driven by star formation feedback from the Galactic disk (e.g. Shapiro & Field, 1976; Bregman, 1980; Norman & Ikeuchi, 1989; Joung & Mac Low, 2006; Hill et al., 2012) and galactic accretion flows (e.g. Toft et al., 2002; Rasmussen et al., 2009; Crain et al., 2010). Other ideas invoke supernova explosions more than pc above the galactic disk (Shelton, 2006; Henley & Shelton, 2009) or hybrid cosmic-ray and thermally driven outflows (Everett et al., 2008). However, the relative importance of these different potential sources of the hot halo gas is unknown.
Recently, Henley et al. (2015) analyzed stratified box simulations of a supernova-driven galactic disk by Hill et al. (2012) and measured surface brightnesses that were two orders of magnitude or more too low compared to observations. The origin of this discrepancy is unclear, although Henley et al. (2015) discuss several possibilities.
In this Letter, we study the galactic halo X-ray emission of simulations from the SILCC project111SImulating the Life-Cycle of molecular Clouds, http://hera.ph1.uni-koeln.de/silcc/ (Walch et al., 2015; Girichidis et al., 2015a). We model a non-equilibrium multi-phase interstellar medium using a time-dependent chemical network and include feedback by supernovae and cosmic rays (Section 2). In Section 3 we show vertical profiles of the galactic winds. We create synthetic surface brightness maps (Section 4) of the galactic halo and study the morphology (Section 5), surface brightness distribution (Section 6) and time evolution (Section 7) of the X-ray emission. In Section 8 we discuss the energy budget of the halo gas. We conclude in Section 9.
2. Simulations
We analyze simulations run with the FLASH 4.1 adaptive mesh refinement code (Fryxell et al., 2000; Dubey et al., 2009), employing a positivity-preserving magnetohydrodynamics solver (Bouchut et al., 2007; Waagan, 2009). The magnetohydrodynamic equations are extended by a mono-energetic, relativistic cosmic-ray fluid (Yang et al., 2012) in the advection-diffusion approximation as described in Girichidis et al. (2014). Parallel to the magnetic field, the diffusion tensor is , and in perpendicular direction .
All simulations use a time-dependent chemical network (Nelson & Langer, 1997; Glover & Mac Low, 2007a, b; Glover et al., 2010; Glover & Clark, 2012), which follows the abundances of free electrons, H+, H, H2, C+, O and CO. Dust shielding and molecular self-shielding are taken into account with the TreeCol algorithm (Clark et al. 2012, Wünsch et al. in prep). In hot gas, we use the Gnat & Ferland (2012) cooling rates and include diffuse heating from the photoelectric effect, cosmic rays and X-rays following the prescriptions of Bakes & Tielens (1994), Goldsmith & Langer (1978) and Wolfire et al. (1995), respectively. More information on the chemical network and the various heating and cooling processes can be found in Gatto et al. (2015) and Walch et al. (2015).
We simulate stratified boxes with dimensions kpckpckpc or kpckpckpc and a grid resolution of pc. These boxes are larger and have a coarser resolution than previous simulations of similar type (Walch et al., 2015; Girichidis et al., 2015a) because our cosmic ray diffusion coefficient does not allow for higher resolution. The simulation domain is periodic in the and directions. Gas can leave the box in direction, but infall is not permitted.
We use a tree-based method to incorporate self-gravity (Wünsch et al. in prep.) and additionally impose an external gravitational potential for the stellar component of the gravitational force on the gas. We choose the parameters of the external potential to fit solar neighbourhood values, namely a surface density in stars of pc-2 and a vertical scale height of pc.
The disk has a gas surface density pc-2. The mass is initially set up according to a Gaussian distribution in -direction with a scale height of pc. The disk has a midplane density of g cm-3 and temperature of K. It is embedded in a halo with density g cm-3 and temperature K. Magnetic fields are initialized in the -direction and scale in magnitude with the square root of the gas density. The midplane field strength is nG. For more information on the initial conditions and simulation setup see Walch et al. (2015) and Girichidis et al. (2015a).
Following the Kennicutt-Schmidt relation (Schmidt, 1959; Kennicutt, 1998), we inject supernova explosions at a constant supernova rate surface density of Myrkpc-2 and half of this value (see discussion in Walch et al. 2015). Using the same approach as de Avillez & Breitschwerdt (2004) and Joung & Mac Low (2006), explosion events are drawn randomly from a distribution of type Ia and type II supernovae, taking spatial and temporal correlations of explosion sites in stellar clusters into account (see Girichidis et al. 2015a).
With each supernova explosion, we inject a thermal energy of erg. For a detailed description of the supernova injection subgrid model we refer to Gatto et al. (2015). In simulations with cosmic rays, we additionally inject 10% of in the form of cosmic ray energy. We also consider a control run in which we only inject cosmic ray energy, but no thermal energy during supernova explosions (Girichidis et al., 2015b).
Table 1 summarizes the key simulation properties for the runs presented in this paper. Simulations SN, SNCR and CR are discussed in Girichidis et al. (2015b). For the small boxes, we also present simulations that include self-gravity, and simulations with half the fiducial supernova rate. Additionally, we show one high-resolution simulation from Walch et al. (2015) with identical supernova rate and surface density, and which uses the same clustered driving, S10-KS-clus.
| simulation | supernova rate | resolution | box dimension | thermal | cosmic | self- | |
| name | (pc-2) | (Myrkpc-2) | (pc) | (kpc3) | feedback | rays | gravity |
| SN | yes | no | no | ||||
| SNCR | yes | yes | no | ||||
| CR | no | yes | no | ||||
| sb-SN | yes | no | no | ||||
| sb-SN-lo | yes | no | no | ||||
| sb-SN-sg | yes | no | yes | ||||
| sb-SNCR | yes | yes | no | ||||
| sb-SNCR-lo | yes | yes | no | ||||
| sb-SNCR-sg | yes | yes | yes | ||||
| S10-KS-clus | yes | no | yes |
We list the values of the gas surface density , the supernova rate (surface density), the numerical resolution, and the box dimension. We also specify which simulations include thermal energy injection, cosmic rays or self-gravity.
3. Vertical profiles
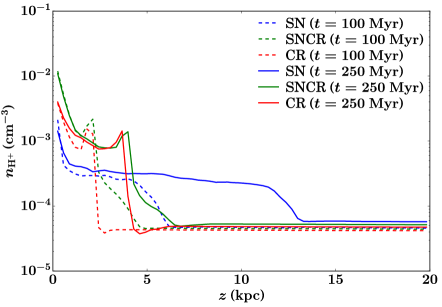
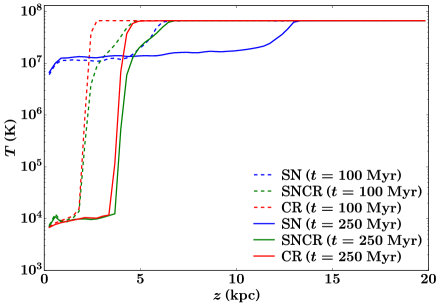
Since X-rays are emitted from hot, ionized gas in the halo, we show in Figure 1 vertical profiles of the H+ number density and temperature for the upper halo of the simulations SN, SNCR and CR after and Myr. The simulations with cosmic-ray feedback can reach half an order of magnitude higher densities of H+ in the halo. However, this H+ is at much lower temperatures, K instead of K in the pure thermal case. Including cosmic rays, the galactic wind is mostly atomic in composition (Girichidis et al., 2015b), which through mixing processes with the ionized component leads to a lower average temperature of H+ in the halo.
After Myr, simulation SN has filled the halo up to 13 kpc with hot gas from a galactic wind. Runs SNCR and CR expand more slowly (see discussion in Girichidis et al. 2015b). Simulation SNCR only drives gas in excess of K into the halo in a kpc wide layer ahead of the primarily atomic outflow, while run CR does not create any hot gas at all.
4. Surface brightness maps
To estimate the importance of absorption for the soft X-ray surface brightness maps, we compute the total optical depth for the neutral hydrogen cross section along lines of sight from kpc above the galactic midplane to the end of the simulation box at 20 kpc. Soft X-rays are primarily absorbed by atomic hydrogen near . The absorption cross section per hydrogen nucleus can be approximated by , where is the energy of the X-ray photon (Shang et al., 2002). The function falls monotonically from to , with an average value of .
We find optical depths well below for the vast majority of the sightlines. Although the galactic wind is mostly atomic in composition in the cosmic-ray runs, the total amount of atomic hydrogen that accumulates in the halo remains small, and the entire halo stays optically thin. Therefore, we can neglect absorption for the computation of the surface brightness maps.
We use an emission table generated with the Astrophysical Plasma Emission Code (APEC, Smith et al. 2001) from the collisional ionization database AtomDB222http://www.atomdb.org to compute the X-ray emissivity in the energy band –keV. The metallicity is solar throughout. The emissivity is largest for gas with temperatures between K and K and declines rapidly for higher and lower temperatures.
Given the emissivity as function of temperature and density, we compute surface brightness maps by integrating the emissivity along lines of sight. The base grid of our simulations has a resolution of in the midplane (- plane) for the large boxes and for the small ones. For each of these -coordinates, we trace a ray outwards until the end of the simulation volume and integrate the emissivity along the ray. We start the integration at an altitude of kpc above the midplane to only include halo gas. Hereafter, we call the region kpc the upper halo. To visualize the structure of the galactic wind in the simulations, we also generate edge-on maps of the surface brightness with an analogous procedure.
Henley et al. (2015) use a more complex method to post-process the galactic fountain models of Hill et al. (2012), following closely the analyis of real observations. We have compared our values for the surface brightness to the results of this more sophisticated procedure by applying our method to the Hill et al. (2012) simulations. We find good agreement in the surface brightness distribution between the results reported by Henley et al. (2015) and our own values. However, our approach does not allow us to determine X-ray temperatures, and so we will focus exclusively on the surface brightness in this paper.
5. Morphology of the X-ray emission
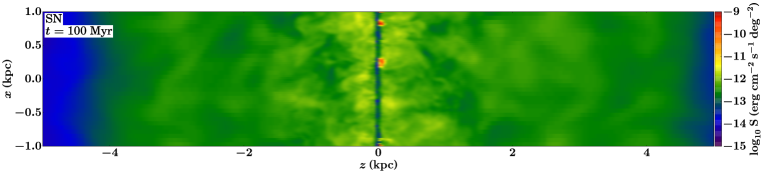
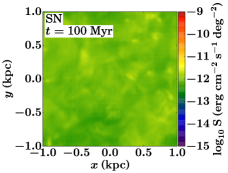
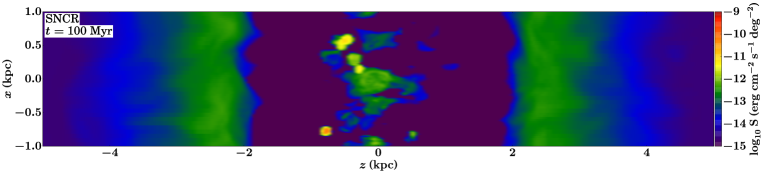
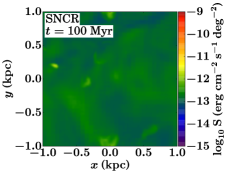
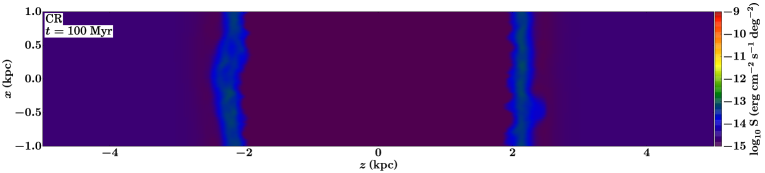
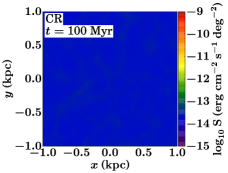
The morphology of the face-on soft X-ray emission is qualitatively similar in all simulations. The largest differences occur as function of the outflow driving mechanism. We illustrate this in Figure 2 for the three simulations SN, SNCR and CR at a simulation time of Myr. When thermal feedback is included, the supernova and/or cosmic-ray driving launches a wind into the galactic halo that is bright in soft X-rays. In the case of runs SN and SNCR, supernova explosions inject hot gas into the halo that reaches a height of kpc. The edge-on surface brightness corresponds very well to the vertical profiles of Figure 1.
Because of the lower temperature of the wind, run SNCR has a smaller face-on surface brightness than run SN. Most of the gas launched by the galactic wind in run SNCR is too cool to emit soft X-rays. Therefore, supernovae which explode at high altitudes and inject thermal energy locally into the halo provide a more important contribution to the face-on surface brightness than in run SN, where the galactic wind is bright in soft X-rays and the emission stems from the entirety of the halo gas. As expected, run CR is completely dark in soft X-rays, with the exception of the hot gas remaining from the initial conditions. In all cases the face-on maps of surface brightness are relatively homogeneous, with a scatter for different lines of sight of less than an order of magnitude. Run SN is an order of magnitude brighter than run SNCR, with run SN being very close to the observed values.
6. Surface brightness distribution
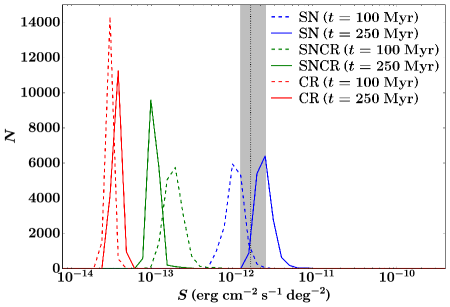
As the simulations proceed, an increasing amount of gas is pushed into the halo. Figure 3 shows the face-on surface brightness distribution of run SN, SNCR and CR at Myr and Myr. The width of the distribution in all snapshots is one order of magnitude or smaller. In the Myr of evolution between the snapshots, the distribution shifts towards larger surface brightnesses, but does not significantly change its shape.
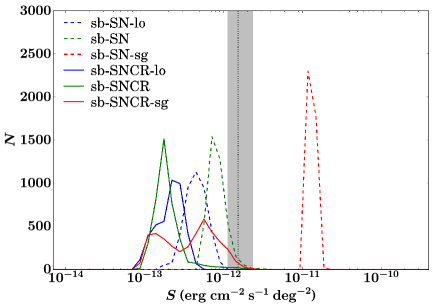
The histograms for the simulations with the smaller volume are shown in Figure 3 for Myr. The surface brightness distributions of the simulations with the lower supernova rates are shifted towards smaller values by a factor of a few compared to simulations with the fiducial supernova rates, but only in the case of pure thermal feedback. Most strikingly, the runs that include self-gravity have an up to one order of magnitude higher surface brightness than simulations without self-gravity. Both sets of simulations with and without cosmic rays show this effect, but it is more pronounced in the pure thermal case. The reason for the increase in surface brightness for simulations with self-gravity is the formation of filaments and sheets in the disk, which sets in after about Myr. These structures bind the diffuse gas in the disk, so that supernovae exploding in voids can inject large amounts of hot gas into the halo. Without self-gravity, these ejecta are largely absorbed by diffuse gas in the disk before they can enter the halo. All surface brightness distributions have mean values not farther away than one order of magnitude from the median of the Henley & Shelton (2013) observations.
7. Time evolution
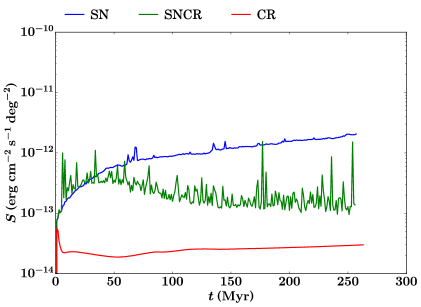
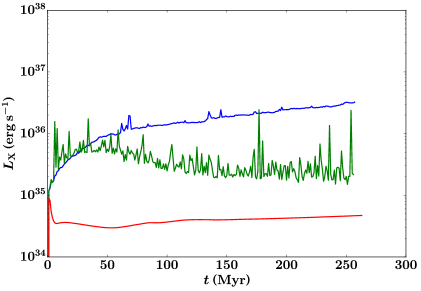
The time evolution of the mean face-on surface brightness of all simulations is shown in Figure 4. Run SN reaches a value of erg cm-2 s-1 deg-2 after 50 Myr, and then continues to grow slowly. We note that this growth is not limited by the size of the simulation box, which extends up to 20 kpc (compare Figure 1). Run SNCR is much more intermittent than run SN because of the large relative importance of supernova explosions at high altitudes. On average, the surface brightness in run SNCR is one order of magnitude smaller than in run SN.
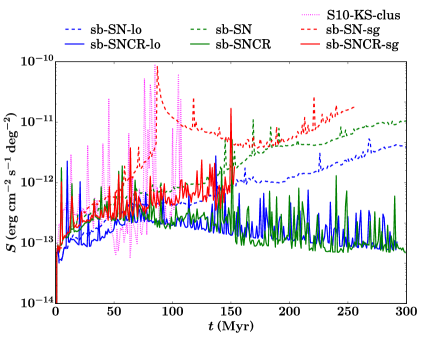
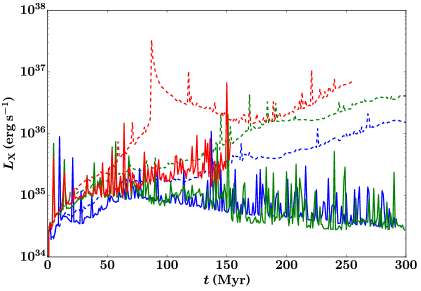
The simulations with the smaller boxes show a similar behavior as the other runs. For pure thermal feedback, runs with a lower supernova rate always have a smaller surface brightness than simulations with the fiducial value. Note, however, that the difference in surface brightness at late times is much larger than the difference in the supernova rate. Therefore, simulations with only thermal feedback are very sensitive to the assumed supernova rate. When cosmic rays are included, no systematic dependence on the supernova rate is observed.
Of all the different physical effects considered here, self-gravity has by far the largest impact. This, however, is only a temporary effect, because in our simulations the inclusion of self-gravity leads to a run-away process that accumulates most mass in dense clouds that cannot be destroyed by supernovae (Girichidis et al., 2015a). At Myr, most of the disk in run sb-SN-sg has been blown away, and the remaining gas is locked up in a few blobs in the midplane. In contrast, the disks in runs sb-SNCR and sb-SNCR-sg can survive for a longer time. Therefore, their evolution is more steady compared to the bursty situation in run sb-SN-sg.
The high-resolution run S10-KS-clus behaves similarly as the other simulations but shows larger fluctuations over time, which is expected. The magnitude of the surface brightness in the lower-resolution runs is therefore not affected by resolution.
All the simulations reach surface brightness values between erg cm-2 s-1 deg-2 and erg cm-2 s-1 deg-2. This agrees with the observations by Henley & Shelton (2013) within an order of magnitude. Because the time variability of the observed values is unknown, and since our simulations do not reach a steady state within the simulation runtime, a comparison of absolute values should not be overemphasized. The exact surface brightness values depend sensitively on the simulation parameters, but all of our simulations naturally produce values of the same order of magnitude as the observations.
8. Energy budget
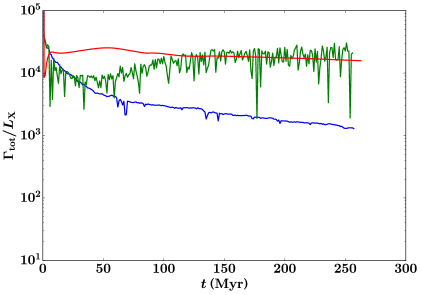
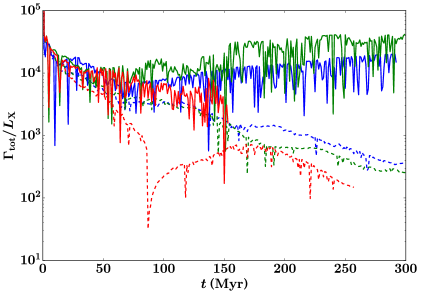
We can estimate the energy budget of the upper halo ( kpc) as follows. For symmetry reasons, we assume that half of the energy input (thermal or cosmic rays) from supernova explosions goes into the heating of the upper halo. Furthermore, we have to consider the total X-ray heating rate of the upper halo due to the Wolfire et al. (1995) prescription, which is the only heating term in our chemical network that affects hot, ionized gas. Both forms of energy input give the total heating rate . In simulations with the fiducial supernova rate and thermal feedback, the energy input from supernova explosions is about times the X-ray heating rate, however in run CR both forms of energy input are comparable in magnitude. Therefore, the contribution of X-ray heating to the surface brightness is negligible when thermal feedback is present. The energy radiated away by soft X-rays is given by the luminosity .
Figure 4 shows and the ratio as function of time. The amount of energy radiated away in soft X-rays is usually less than a percent and in most cases even less than a permille.
9. Conclusions
We have presented a differential analysis of the soft X-ray emission from the galactic halo in a set of simulations in which we systematically vary the effects of supernova feedback, cosmic-ray driving and self-gravity. We find that star formation feedback alone is sufficient to explain the observed surface brightness. For pure thermal feedback, the results are very sensitive to the supernova rate. Cosmic rays suppress this dependence and reduce the surface brightness by an order of magnitude or more. Self-gravity binds the diffuse gas in the disk plane, so that supernovae exploding in voids can blow a large amount of hot gas into the halo. This can boost the soft X-ray surface brightness by several orders of magnitude. Because this quantity is extremely sensitive to the above physical effects, we conclude that observations of the soft X-ray surface brightness alone do not provide useful diagnostics for the study of galactic star formation.
Acknowledgements
We thank Jonathan Mackey for useful discussions and John ZuHone for providing the APEC emissivity file. We also thank Alex Hill and Mordecai Mac Low for access to their simulation data and the referee for helpful comments that improved the clarity of the paper. T.P., P.G., A.G., T.N., S.W., S.C.O.G., R.S.K., and C.B. acknowledge support from the DFG Priority Program 1573 Physics of the Interstellar Medium. T.N. acknowledges support from the DFG cluster of excellence Origin and Structure of the Universe. S.W. acknowledges the support of the Bonn-Cologne Graduate School, which is funded through the Excellence Initiative, and the SFB 956 Conditions and impact of star formation funded by the DFG. R.W. acknowledges support by the Czech Science Foundation grant 209/12/1795 and by the project RVO:67985815 of the Academy of Sciences of the Czech Republic. R.S.K., S.C.O.G., and C.B. thank the DFG for funding via the SFB 881 The Milky Way System (subprojects B1, B2, and B8). R.S.K. furthermore acknowledges support from the European Research Council under the European Community’s Seventh Framework Programme (FP7/2007-2013) via the ERC Advanced Grant STARLIGHT (project number 339177). The FLASH code was in part developed by the DOE-supported Alliances Center for Astrophysical Thermonuclear Flashes (ASCI) at the University of Chicago. The data was analyzed with the yt code (Turk et al., 2011).
References
- Bakes & Tielens (1994) Bakes, E. L. O., & Tielens, A. G. G. M. 1994, ApJ, 427, 822
- Bouchut et al. (2007) Bouchut, F., Klingenberg, C., & Waagan, K. 2007, Numerische Mathematik, 108, 7
- Bregman (1980) Bregman, J. N. 1980, ApJ, 236, 577
- Burrows & Mendenhall (1991) Burrows, D. N., & Mendenhall, J. A. 1991, Nature, 351, 629
- Clark et al. (2012) Clark, P. C., Glover, S. C. O., & Klessen, R. S. 2012, MNRAS, 420, 745
- Crain et al. (2010) Crain, R. A., McCarthy, I. G., Frenk, C. S., Theuns, T., & Schaye, J. 2010, MNRAS, 407, 1403
- de Avillez & Breitschwerdt (2004) de Avillez, M. A., & Breitschwerdt, D. 2004, A&A, 425, 899
- Dubey et al. (2009) Dubey, A., Antypas, K., Ganapathy, M. K., et al. 2009, Parallel Computing, 35, 512
- Everett et al. (2008) Everett, J. E., Zweibel, E. G., Benjamin, R. A., et al. 2008, ApJ, 674, 258
- Fryxell et al. (2000) Fryxell, B., Olson, K., Ricker, P., et al. 2000, ApJS, 131, 273
- Gatto et al. (2015) Gatto, A., Walch, S., Mac Low, M.-M., et al. 2015, MNRAS, 449, 1057
- Girichidis et al. (2014) Girichidis, P., Naab, T., Walch, S., & Hanasz, M. 2014, ArXix:1406.4861
- Girichidis et al. (2015a) Girichidis, P., Walch, S., Naab, T., et al. 2015a, ArXiv:1508.06646
- Girichidis et al. (2015b) Girichidis, P., Naab, T., Walch, S., et al. 2015b, ArXiv:1509.07247
- Glover & Clark (2012) Glover, S. C. O., & Clark, P. C. 2012, MNRAS, 421, 116
- Glover et al. (2010) Glover, S. C. O., Federrath, C., Mac Low, M.-M., & Klessen, R. S. 2010, MNRAS, 404, 2
- Glover & Mac Low (2007a) Glover, S. C. O., & Mac Low, M.-M. 2007a, ApJS, 169, 239
- Glover & Mac Low (2007b) —. 2007b, ApJ, 659, 1317
- Gnat & Ferland (2012) Gnat, O., & Ferland, G. J. 2012, ApJS, 199, 20
- Goldsmith & Langer (1978) Goldsmith, P. F., & Langer, W. D. 1978, ApJ, 222, 881
- Henley & Shelton (2009) Henley, D. B., & Shelton, R. L. 2009, ApJ, 701, 1880
- Henley & Shelton (2010) —. 2010, ApJS, 187, 388
- Henley & Shelton (2013) —. 2013, ApJ, 773, 92
- Henley et al. (2015) Henley, D. B., Shelton, R. L., Kwak, K., Hill, A. S., & Mac Low, M.-M. 2015, ApJ, 800, 102
- Hill et al. (2012) Hill, A. S., Joung, M. R., Mac Low, M.-M., et al. 2012, ApJ, 750, 104
- Joung & Mac Low (2006) Joung, M. K. R., & Mac Low, M.-M. 2006, ApJ, 653, 1266
- Kennicutt (1998) Kennicutt, Jr., R. C. 1998, ApJ, 498, 541
- Kuntz & Snowden (2000) Kuntz, K. D., & Snowden, S. L. 2000, ApJ, 543, 195
- Nelson & Langer (1997) Nelson, R. P., & Langer, W. D. 1997, ApJ, 482, 796
- Norman & Ikeuchi (1989) Norman, C. A., & Ikeuchi, S. 1989, ApJ, 345, 372
- Pietz et al. (1998) Pietz, J., Kerp, J., Kalberla, P. M. W., et al. 1998, A&A, 332, 55
- Rasmussen et al. (2009) Rasmussen, J., Sommer-Larsen, J., Pedersen, K., et al. 2009, ApJ, 697, 79
- Schmidt (1959) Schmidt, M. 1959, ApJ, 129, 243
- Shang et al. (2002) Shang, H., Glassgold, A. E., Shu, F. H., & Lizano, S. 2002, ApJ, 564, 853
- Shapiro & Field (1976) Shapiro, P. R., & Field, G. B. 1976, ApJ, 205, 762
- Shelton (2006) Shelton, R. L. 2006, ApJ, 638, 206
- Smith et al. (2001) Smith, R. K., Brickhouse, N. S., Liedahl, D. A., & Raymond, J. C. 2001, ApJ, 556, L91
- Smith et al. (2007) Smith, R. K., Bautz, M. W., Edgar, R. J., et al. 2007, PASJ, 59, 141
- Snowden et al. (1998) Snowden, S. L., Egger, R., Finkbeiner, D. P., Freyberg, M. J., & Plucinsky, P. P. 1998, ApJ, 493, 715
- Toft et al. (2002) Toft, S., Rasmussen, J., Sommer-Larsen, J., & Pedersen, K. 2002, MNRAS, 335, 799
- Turk et al. (2011) Turk, M. J., Smith, B. D., Oishi, J. S., et al. 2011, ApJS, 192, 9
- Waagan (2009) Waagan, K. 2009, J. Comput. Phys., 228, 8609
- Walch et al. (2015) Walch, S., Girichidis, P., Naab, T., et al. 2015, MNRAS, 454, 238
- Wang & Yu (1995) Wang, Q. D., & Yu, K. C. 1995, AJ, 109, 698
- Wolfire et al. (1995) Wolfire, M. G., Hollenbach, D., McKee, C. F., Tielens, A. G. G. M., & Bakes, E. L. O. 1995, ApJ, 443, 152
- Yang et al. (2012) Yang, H.-Y. K., Ruszkowski, M., Ricker, P. M., Zweibel, E., & Lee, D. 2012, ApJ, 761, 185