![[Uncaptioned image]](/html/1510.06411/assets/ngVLA_banner.png)
Next Generation Very Large Array Memo No. 8
Science Working Group 3
Galaxy Assembly through Cosmic Time
Caitlin M. Casey1,
Jacqueline A. Hodge2,3,
Mark Lacy2,
Christopher A. Hales4,
Amy Barger5,
Desika Narayanan6,
Chris Carilli4,7,
Katherine Alatalo8,
Elisabete da Cunha9,
Bjorn Emonts10,
Rob Ivison11,12,
Amy Kimball13,
Kotaro Kohno14,
Eric Murphy15,
Dominik Riechers16,
Mark Sargent17,
Fabian Walter18
Abstract
The Next-Generation Very Large Array (ngVLA) will be critical for understanding how galaxies are built and evolve at the earliest epochs. The sensitivity and frequency coverage will allow for the detection of cold gas and dust in ‘normal’ distant galaxies, including the low-J transitions of molecular gas tracers such as CO, HNC, HCN, and HCO+; synchrotron and free-free continuum emission; and even the exciting possibility of thermal dust emission at the highest () redshifts. In particular, by enabling the total molecular gas reservoirs to be traced to unprecedented sensitivities across a huge range of epochs simultaneously – something no other radio or submillimeter facility will be capable of – the detection of the crucial low-J transitions of CO in a diverse body of galaxies will be the cornerstone of ngVLA’s contribution to high-redshift galaxy evolution science. The ultra-wide bandwidths will allow a complete sampling of radio SEDs, as well as the detection of emission lines necessary for spectroscopic confirmation of elusive dusty starbursts. The ngVLA will also deliver unique contributions to our understanding of cosmic magnetism and to science accessible through microwave polarimetry. Finally, the superb angular resolution will move the field beyond detection experiments and allow detailed studies of the morphology and dynamics of these systems, including dynamical modeling of disks/mergers, determining the properties of outflows, measuring black hole masses from gas disks, and resolving multiple AGN nuclei. We explore the contribution of a ngVLA to these areas and more, as well as synergies with current and upcoming facilities including ALMA, SKA, large single-dish submillimeter observatories, GMT/TMT, and JWST.
1Department of Astronomy, The University of Texas at Austin, 2515 Speedway Blvd, Austin, TX 78712, USA
2National Radio Astronomy Observatory, 520 Edgemont Road, Charlottesville, VA 22903, USA
3Leiden University, J.H. Oort Building, Niels Bohrweg 2 NL-2333 CA Leiden, The Netherlands
4National Radio Astronomy Observatory, 1003 Lopezville Rd, Socorro, NM 87801, USA
5Department of Astronomy, University of Wisconsin–Madison, 475 North Charter Street, Madison, WI 53706, USA
6Department of Physics & Astronomy, Haverford College, 370 Lancaster Ave, Haverford, PA 19041, USA
7Cavendish Astrophysics Group, JJ Thomson Avenue, Cambridge, CB3 0HE, UK
8Carnegie Observatories, 813 Santa Barbara St, Pasadena, CA 91101, USA
9Center for Astrophysics and Supercomputing, Swinburne University of Technology, Hawthorn VIC 3122, Australia
10Centro de Astrobiologia, Instituto Nacional de Técnica Aeroespacial, 28850 Torrejón de Ardoz, Madrid, Spain
11European Southern Observatory, Karl-Schwarzschild-Strasse 2, D-85748 Garching, Germany
12Institute for Astronomy, University of Edinburgh, Royal Observatory,
Blackford Hill, Edinburgh EH9 3HJ, UK
13CSIRO Astronomy & Space Science, Epping, PO Box 76, NSW 1710 Australia
14Institute of Astronomy, The University of Tokyo,
2-21-1 Osawa, Mitaka, Tokyo, 181-0015 Japan
15IPAC, Caltech, MC 220-6, Pasadena, CA 91125, USA
16Astronomy Department, Cornell University,
220 Space Sciences Building, Ithaca, NY 14853, USA
17CEA Saclay, DSM/Irfu/Service d Astrophysique, Orme des Merisiers, F-91191 Gif-sur-Yvette Cedex, France
18Max-Planck-Institut für Astronomie, Königstuhl 17, D-69117 Heidelberg, Germany
1 Introduction
The Karl G. Jansky Very Large Array (VLA) is a 27-element radio interferometer located on the Plains of San Agustin, New Mexico, which has enabled cutting-edge radio astronomy for over three decades. Each of the 25-m diameter antennae are situated on rail tracks that form the shape of a ‘Y’, providing baselines up to 36 km and angular resolutions as high as 0.04′′ at the top end of the 74–50,000 MHz frequency range. Originally known as simply the Very Large Array, the array was renamed as the Jansky Very Large Array in 2012 to mark the completion of a major expansion of its capabilities. This upgrade to several of the major hardware areas allowed for complete frequency coverage between 1–50 GHz, an order of magnitude improvement in continuum sensitivity, and increased spectroscopic capability and correlator flexibility.
In late 2014, NRAO established several working groups in order to explore the scientific potential of a next-generation large array for centimeter-wave (0.3–30 cm) astronomy, well beyond the current capabilities of even the JVLA. Currently designated the ‘Next Generation Very Large Array’ (ngVLA), such an array would entail ten times the effective collecting area of the JVLA and ALMA, operating from 1 GHz to 115 GHz, with ten times longer baselines (300 km) providing mas-resolution, plus a dense core on km-scales for high surface brightness imaging (Carilli et al., ). The ngVLA is envisioned to represent a factor of 5–10 improvement over the present-day VLA in multiple parameters, including frequency coverage, instantaneous radio frequency (RF) and processed bandwidth, total collecting area, maximum baseline length, field of view, and correlator modes. These working groups have subsequently identified a number of key science goals that would benefit greatly from a substantial upgrade to one or more of these parameters, and for which no other existing or upcoming facility will suffice.
The high-redshift science goals of the ngVLA which are the key focus of this report (working group 3) are intimately intertwined with some of the most important questions surrounding galaxy evolution studies today. Specifically, how and when did most galaxies in the Universe assemble? What physical processes dominate the buildup of stellar mass in the Universe, and how has that changed and evolved over the past 12-13 billion years? What role does environment play in galaxy growth? Can our understanding of the first galaxies shed light on early Universe cosmology, including hierarchical growth and collapse of large scale structure? In this white paper, we explore the many important contributions that the ngVLA will make to studies of galaxy assembly over cosmic time and out to the earliest epochs of galaxy formation.
2 Motivation
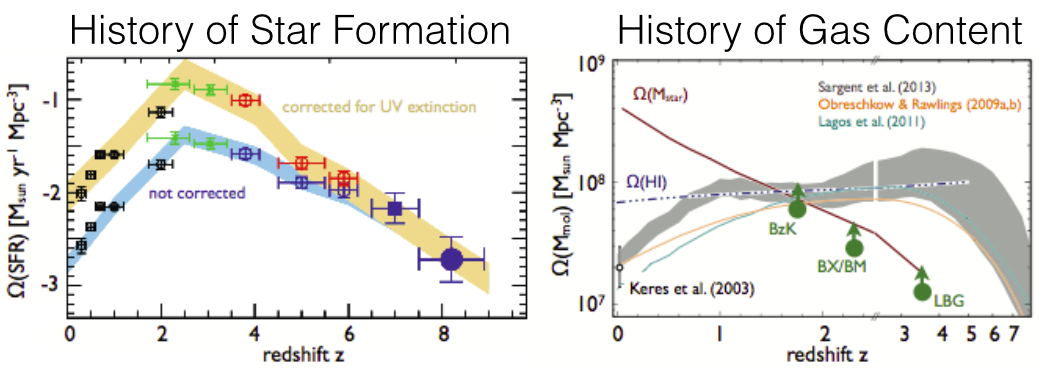
Deep, legacy optical surveys of the Universe have laid down a framework for our understanding of the formation of galaxies at early times. They have indicated that galaxies were forming stars at rates hundreds of times higher at than in the present day. This is the epoch where the star formation rate density (SFRD) peaks, and at earlier times, very deep surveys attempt to learn when galaxies first became illuminated (see Figure 1 for a depiction of the redshift evolution of the SFRD from optical surveys). However, at redshifts beyond , the measurements which constrain this understanding have largely been limited to optical and near-infrared pencil-beam surveys of direct starlight, thus limited in dynamic range, accessible volume, and to galaxies readily visible via their direct emission from stars. This, despite the fact that half of all energy emitted by extragalactic sources is obscured and emitted by dust or gas at much longer wavelengths.
The submillimeter and radio long-wavelength regime tell a crucial part of the galaxy evolution story, but they have been largely set aside by a large fraction of the galaxy evolution community in past decades due to limitations in long-wavelength instrumentation and sensitivity. Yet recent years have seen a dramatic increase in our understanding of galaxy evolution from a bolometric point of view, from both dust and gas emission, thanks to facilities like the Very Large Array (VLA), Scuba on the JCMT, the Herschel Space Observatory, IRAM’s Plateau de Bure Interferometer (PdBI), and the Atacama Large Millimeter Array (ALMA). Here we present the argument that the next few decades will see a significant shift in galaxy evolution work away from the rest-frame optical/UV and towards long-wavelength studies. The ngVLA will play a critical part in defining what we will be able to learn about galaxy assembly and large scale structure.
Cold molecular gas is the most fundamental building block for star formation, yet the Universe’s molecular gas content is very poorly understood relative to its measured stellar content (Figure 1). Solving the existing mysteries of how the Universe’s stars assembled requires a detailed look at such a fundamental building block. Cosmological simulations are now making detailed predictions as to how this gas migrates, heats, cools, and enters and leaves galaxies via accretion and feedback mechanisms. While these simulations represent a huge leap forward in theoretical modeling, these predictions have yet to be tested through direct observation of the molecular gas at high-redshift.
In addition to the much needed molecular gas census at high-redshift, the galaxy evolution community also needs a more detailed understanding of how galaxies in the distant Universe may be fundamentally different physically than those in the low-redshift Universe. Dynamics play a key role in the distinction. While high-redshift galaxies seem to be substantially different from nearby galaxies in terms of their star formation rates and stellar mass characteristics (Noeske et al., 2007; Daddi et al., 2008), it is unclear whether or not these differences are driven primarily by cosmic downsizing associated with the different conditions of the intergalactic medium (Cowie & Songaila, 1986), or if the galaxies grow in fundamentally different ways at high-redshift. Probing the internal kinematics through rest-frame millimeter molecular lines gets to the heart of this debate, but to-date, has only been done for a handful of galaxies beyond .
3 Cold Gas Emission
Cold molecular gas is the fuel which powers star formation, the production of metals, the formation of stellar byproducts, and therefore galaxy growth. The bulk of the Universe’s cold gas reservoir is comprised of hydrogen gas in the form of atomic hydrogen, Hi, and molecular hydrogen, H2, the latter of which is responsible for star formation in cold, condensed molecular clouds. Though H2 is not directly observable under normal circumstances, CO gas is typically used as a proxy given that its particularly bright transitions are tightly correlated with the ambient density of molecular hydrogen. This section discusses the primary goals of ngVLA science as they relate to cold gas at high-redshift, through observations of CO and tracers of denser gas phases.
3.1 CO
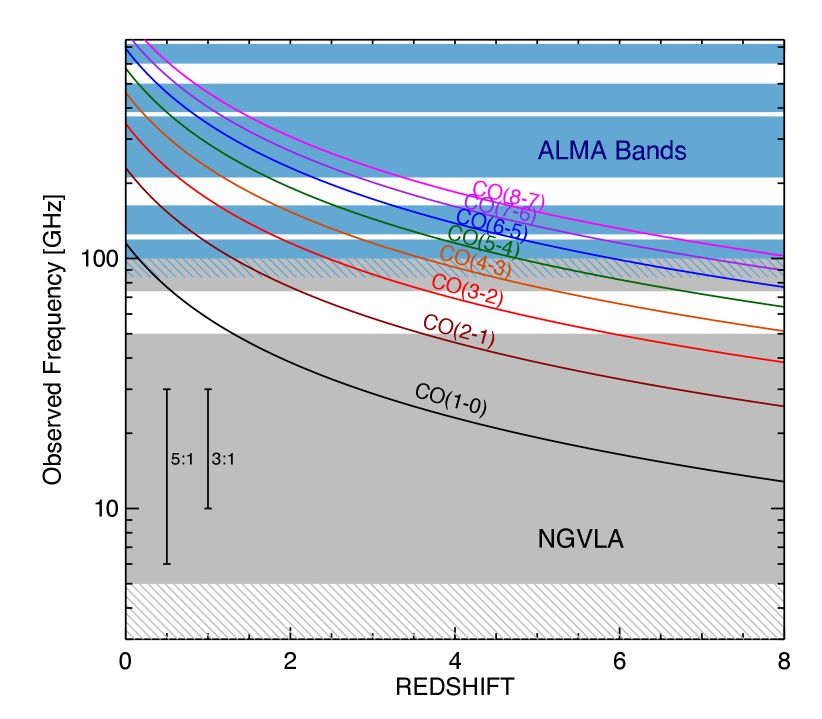
Transitions of carbon monoxide are particularly bright due to CO’s low critical density, making it the easiest molecule to detect in high-redshift galaxies. Indeed, the vast majority of the few hundred molecular line detections in the high-redshift Universe have been of CO (see more in reviews of Solomon & Vanden Bout, 2005; Carilli & Walter, 2013). Due to frequency shifting at sufficiently high-redshift, millimeter-operating facilities like IRAM’s PdBI, CARMA and ALMA can only observe the higher-J transitions of CO. The lower-J transitions, including the ground state CO(1-0) transition, are only accessible to longer wavelength radio observatories like the VLA. See Figure 2 for an illustration of this problem for surveying CO (particularly low-J CO) at high-redshift.
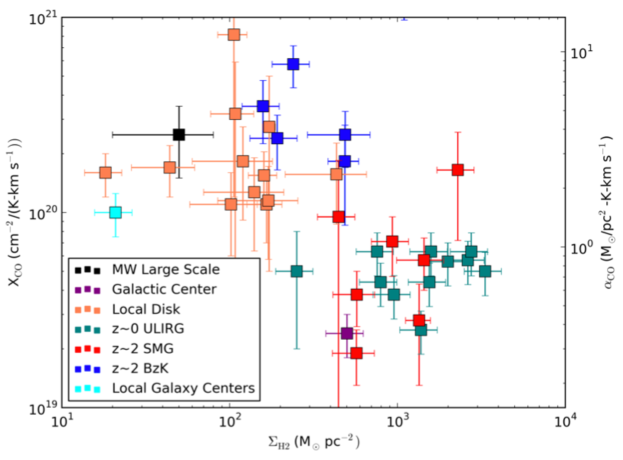
While high-J lines are useful for confirming the existence of galaxies’ molecular gas reservoirs, higher-J CO transitions alone cannot constrain the total molecular gas reservoir, which requires two significantly uncertain conversions. The first is the conversion of high-J CO line strength to the ground state CO(1-0) line strength. This conversion requires knowledge of internal gas temperature and excitation, which might vary substantially in different regions of the galaxy by up to factors of five, and even between the relatively low-J transitions from CO(3-2) to CO(1-0). The second uncertainty is the CO–H2 conversion factor, XCO or , which is required to convert from CO(1-0) to the mass of molecular hydrogen. This conversion varies by up to a factor of five depending on the conditions of the gas in the ISM, including metallicity.
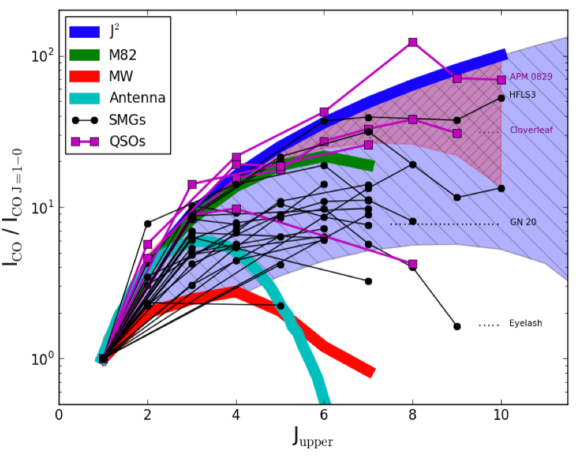
The uncertainties involved in scaling high-J CO transitions to molecular gas mass are illustrated in Figure 3, which shows both the diversity of CO spectral line energy distributions (SLEDs) amongst high-redshift galaxies and the existing constraints on the CO–H2 conversion factor amongst high-redshift galaxy populations. When all uncertainties are accounted for, high-J CO-derived gas masses are uncertain by factors of 25, an uncertainty far too large to precisely measure important quantities like galaxies’ gas fractions.
Due to the uncertainties involved with converting high-J CO lines to gas masses, recent work has focused on using dust continuum measurements to scale to gas masses (Magdis et al., 2011, 2012; Scoville et al., 2014; Santini et al., 2014). However, this technique typically assumes that the dust-to-gas ratio is fixed across a wide range of galaxies and redshifts, which has been shown to be a poor assumption in some cases (Rémy-Ruyer et al., 2014; Capak et al., 2015). In particular, the dust-to-gas ratio is known to depend strongly on metallicity (e.g., Issa, MacLaren & Wolfendale, 1990; Lisenfeld & Ferrara, 1998; Draine et al., 2007). Furthermore, the important kinematic signatures that come along with molecular line measurements are absent from dust continuum measurements.
The ideal probe of the cold molecular gas reservoir is the ground state transition of CO, CO(1-0), where the scaling to molecular hydrogen mass has only the uncertainty in with which to contend. Furthermore, constraining more precisely in high- galaxies is possible with constraints on dynamical mass and stellar mass, which reduces the uncertainty on gas mass further. The JVLA, GBT, and ATCA have detected CO(1-0) in a number of high redshift starburst galaxies, albeit a few at a time with long integrations (Ivison et al., 2011; Hodge et al., 2012; Papadopoulos et al., 2012; Greve et al., 2014; Emonts et al., 2014). These initial detections of CO(1-0) at high-redshift have not only constrained the total molecular gas mass of hydrogen in these high-z systems, but also highlighted the importance of understanding the spatial distribution of gas in distant galaxies.
While the submillimeter-luminous galaxy population, i.e. dusty star forming galaxies (DSFGs) have been found to be relatively compact in high-J transitions (Tacconi et al., 2008; Bothwell et al., 2010), consistent with the idea that they are scaled-up analogs to local ULIRGs (Sanders & Mirabel, 1996), their CO(1-0) maps are dramatically different, showing gas extending as far as 16 kpc from the galaxy centers (Ivison et al., 2011; Spilker et al., 2015). Studies of high-redshift proto-cluster radio galaxies even revealed bright CO(1-0) reservoirs out to distances of 60 kpc from the central galaxy (Emonts et al., 2014). While these larger sizes are more suggestive of disk-like rotation dynamics and widespread molecular gas reservoirs in the halo environment of massive galaxies, the number of galaxies surveyed at the current VLA sensitivity makes it difficult to infer large-scale population dynamics or draw comparisons between low- and high- galaxy populations.
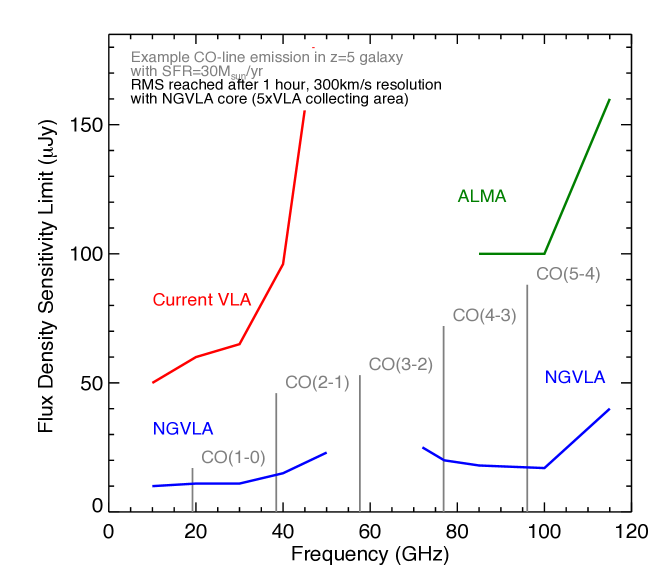
The ngVLA is desperately needed to dramatically increase the number of galaxies surveyed in CO(1-0) at high-redshift by factors in the thousands, in line with what is currently observed from high-redshift galaxies via direct starlight. Figure 4 illustrates the anticipated improvement in ngVLA sensitivity over the current VLA and ALMA depths across 10–120 GHz.
3.2 A molecular gas deep field
To demonstrate the dramatic impact of ngVLA on detection rates of CO(1-0) in high- samples, we have generated a mock observation with a 3:1 bandwidth ratio tuned to 11–33 GHz. This frequency range will pick up the CO(1-0) transition from . The RMS reached after a one hour integration with five times the collecting area of the current VLA is 10 Jy beam-1 across the whole bandwidth. This means that in 30 hours (including overheads), ngVLA will be able to achieve a 1 10 Jy beam-1 RMS in 2 MHz bins, sufficient to resolve individual CO lines into 3–5 spectral bins across the entire bandwidth.
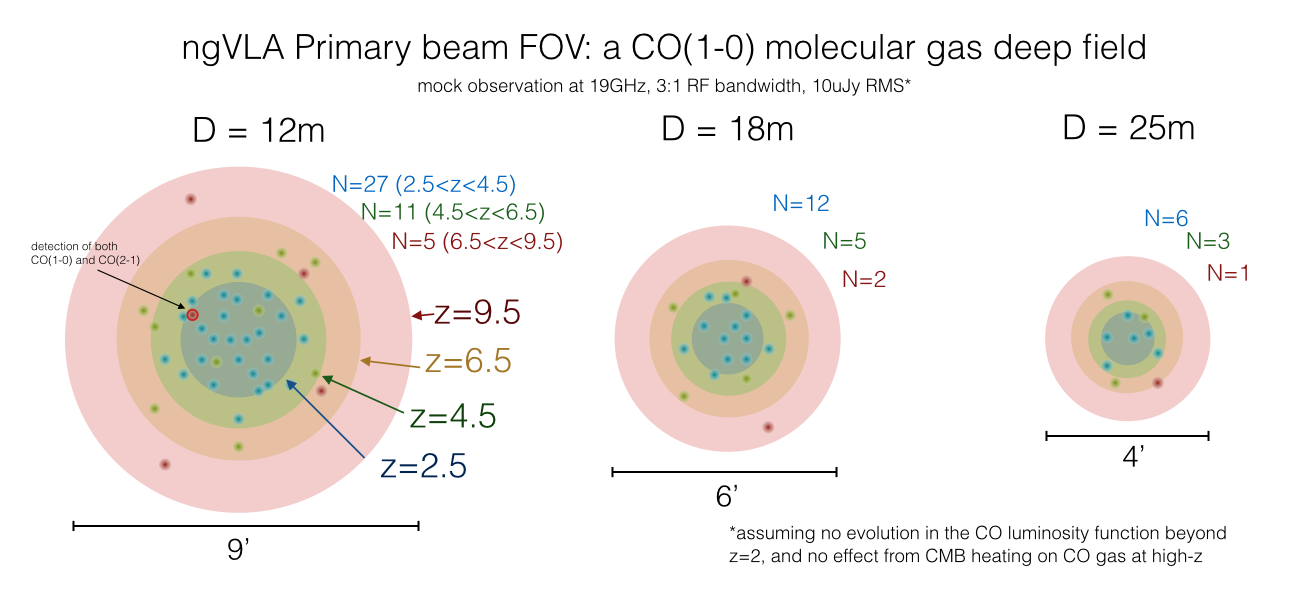
To estimate the number of galaxies accessible to CO(1-0) detection within one ngVLA pointing, we use the latest estimates of the integrated infrared luminosity function (Casey, Narayanan & Cooray, 2014) which is roughly complete out to . For lack of a better assumption, we assert that the same luminosity function holds out to , and we translate to a best-guess CO(1-0) luminosity function using a conservative estimate of a ULIRG-type L-to-LIR scaling (Bothwell et al., 2013) and assuming a linewidth of 200 km s-1. Figure 5 gives a schematic of detectable galaxies within a single pointing to a fixed depth of 10 Jy beam-1 RMS. This schematic highlights two things: the field of view is substantially larger for smaller-dish antennae (12 m as opposed to the current 25 m), and the field of view is substantially larger at low frequencies, corresponding to the regime where the highest-redshift CO emitters would be detectable. However, with a fixed flux density RMS, only the brightest galaxies will be detectable at the highest redshifts and so are comparatively fewer in number than the fainter, sources. For example, assuming 18 m antennae, we expect twelve sources to fall within a 2–3′ field of view, five sources to fall within a 3–4′ field of view, and two sources to fall within a 5–6′ field of view.
Recently, da Cunha et al. (2013) published empirical predictions for the number of line emitters in a CO deep field. Using the deepest available optical/near-infrared data for the Hubble Ultra Deep Field (UDF), they employed a physically motivated spectral energy distribution model along with empirical relations between the observed CO line and infrared luminosities of star-forming galaxies in order to predict the expected number of line detections. In particular, for frequencies between 18–50 GHz over the 12 arcmin2 UDF, and assuming a linewidth of 300 km s-2, they predict of order 200 CO(1-0) detections down to a 5 limit of 50 Jy beam-1. In order to compare the two methods, if we adjust our frequency tuning to cover the same range, we predict 70 CO(1-0) line detections in a single (12-m dish) pointing, which is approximately one-third of the area of the UDF. The two methods thus produce predictions that are of the same order. Given all of the assumptions that went into the models, and particularly since the estimates were derived in two completely different ways, this relative agreement is encouraging.
The mock observation described in this paper will not only be sensitive to CO(1-0), but also CO(2-1) emission at early epochs. However, the sensitivity and field of view for CO(2-1) will be significantly different for the same redshift regime given the differences in frequency, and will more closely mirror the coverage for the low-redshift CO(1-0) emitters. The survey sensitivity with respect to CO(2-1) depends on source excitation as the ratio of can vary from 2–4. Perhaps counter-intuitively, the depth of CO(2-1) observations at high- will be greater than for CO(1-0), although the number of expected sources per single pointing will not differ substantially from the expected CO(1-0) emitters given the limited field of view. Line degeneracy may then be of concern, since it will be difficult to disentangle low-redshift CO(1-0) emitters and high-redshift CO(2-1) emitters. Other multiwavelength information (and perhaps parallel ALMA observations) would be necessary to break this degeneracy.
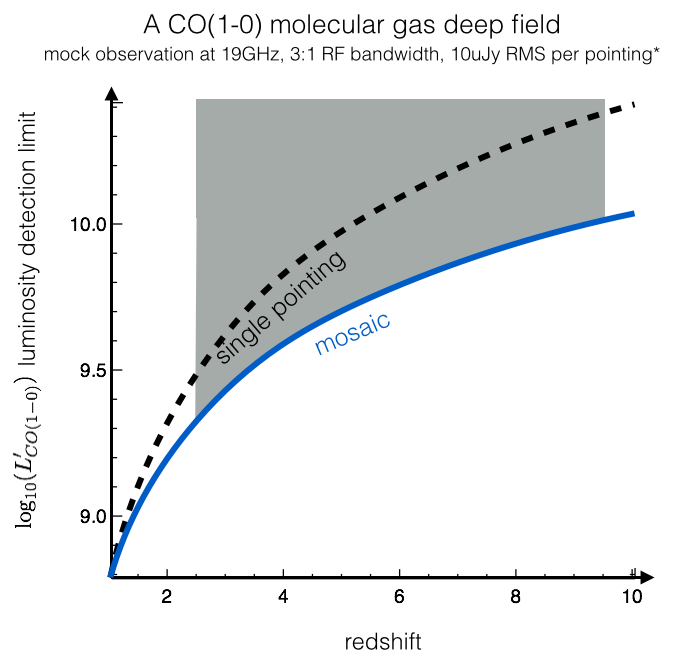
Note that weaving a series of single pointings together will have unique advantages with such a wide bandwidth. For a single pointing example above, the low frequency space probes the largest volumes, but at shallower luminosity limits at high-redshifts. Tiling a mosaic together by maximizing overlap for the low-frequency observations will dramatically reduce the RMS at higher-redshifts, while mapping a large area. Figure 6 shows the effect of mosaicing on the CO(1-0) luminosity limit out to high-redshifts, sensitive to objects in the gray parameter space. As an example, we predict that a 750 hour mosaic made up of 41 individual pointings with 12 m antennae (55 pointings overlapped with an inset 44 pattern) could detect nearly 1500 individual CO(1-0) emitters, with the largest number above where the mosaic would be at its deepest. This mosaic would be approximately 2020′ across. In contrast, antennae which are 18 m in size would yield only 600 detections, and 25 m dishes would yield only 300 detections.
While direct molecular gas detections are certainly the main focus of future ngVLA extragalactic deep fields, it is worth noting that these surveys will be done in well-surveyed legacy fields, where there is already substantial ancillary data including spectroscopic redshifts. With large numbers of spectroscopic redshifts, stacking to measure the median molecular gas reservoir in LBGs would become possible as a function of redshift, environment, or other physical factors.
Before leaving this topic, it is important to return to our a priori assumption that the luminosity function of CO will not substantially change between and . This undoubtedly is not the case, but as there are currently no constraints on any alternative picture, we cannot hypothesize on the change we will perceive in detection yields in molecular gas deep fields. In addition, it is likely the case that early Universe galaxies contain fewer metals and may be less luminous in CO for their given mass. A final important caveat is that at sufficiently high redshift, the temperature of the CMB is non-negligible and can contribute to dust continuum and gas heating within galaxies. While this extra heating of the gas (and dust) will boost the intrinsic fluxes, the CMB also becomes a stronger background against which these fluxes must be measured. The net effect of these two competing effects on CO emission is less straightforward than for the dust continuum emission (da Cunha et al., 2013), as the regions of cold molecular gas may not be in local thermal equilibrium, or the kinetic temperature of the gas may not be thermally coupled to the dust in an obvious way, particularly in early-Universe galaxies. However, the overall effect of CMB heating will be to cut down the number of direct detections in the Universe at low gas temperatures ( K).
On a technical note, using phased array feeds (PAFs) with multiple pixels instead of single pixel feeds would allow the ngVLA to survey areas of sky corresponding to volumes of 0.1 Gpc3, covering the full range of cosmic environments. For example, if we were to use a 33 pixel PAF we could survey the entire 2 deg2 COSMOS field to this depth in a few hundred hours, detecting CO emitting galaxies. This would allow us, for example, to compute 2-point correlation functions within the CO emitting population, and cross-correlations between CO emitting galaxies and other populations such as galaxies with large stellar masses, galaxy clusters and AGN, all of which can be compared directly with the output of simulations. This is critical for assessing the collapse of large scale structure and environmental impact on star formation in galaxies.
3.3 Using CO as a redshift beacon
The need for CO-based redshift confirmation for the most dust-obscured starburst galaxies has already been made clear by the past decade of effort poured into obtaining spectroscopic confirmation for dusty star-forming galaxies (DSFGs; e.g., Chapman et al., 2005; Swinbank et al., 2004; Casey et al., 2011; Casey, 2012; Casey et al., 2012; Danielson et al., 2015). These studies have clearly demonstrated that 50% of all dusty starbursts are too obscured to obtain spectroscopic confirmation via emission lines in the optical/near-infrared. The question of whether the unconfirmed DSFGs sit at similar redshifts or higher redshifts than the others is yet to be clarified, but it is quite clear that DSFG samples beyond suffer from severe spectroscopic incompleteness. The discovery of bright dusty galaxies like HFLS3 (Riechers et al., 2013) hint at the existence of such a population at very high redshifts, but so far, confirming such sources (at more typical, unlensed luminosities) in a systematic way through blind CO searches has not been efficient. In fact, even the existing capability of ALMA can only complete a spectral scan for high-J CO emission for a single source in about an hour of integration time – still prohibitive for large samples, save the strongly lensed subset (Weiß et al., 2013). If we consider the mock observation in § 3.2 and Figure 5, we expect to detect 100 galaxies in one pointing with a 3:1 RF bandwidth ratio above a CO line luminosity of K km/s pc2. Those CO detections can potentially probe a redshift range as wide as . This makes the case clear that NGVLA will be revolutionary in providing unequivocal spectroscopic confirmation for galaxies containing substantial molecular gas potential wells, potentially surpassing the optical/near-infrared in efficiency of follow-up.
3.4 Simulations of CO gas emission at high-
Dusty star-forming galaxies at high-redshift are the most luminous, heavily star-forming galaxies in the Universe (Casey, Narayanan & Cooray, 2014). As some of the most luminous star-formers, ngVLA is in a unique position to study DSFGs’ CO emission in detail through high-resolution, pointed follow-up.
Theorists argue at great length over physical models for DSFGs, with diverse predictions existing for their masses, large scale environments, and potential merger status. Broadly, models for the origin of DFSGs fall into two camps: one in which major mergers drive the luminosity of the galaxy, and one in which DSFGs are the centers of massive halos growing hierarchically via numerous minor mergers and smooth accretion.
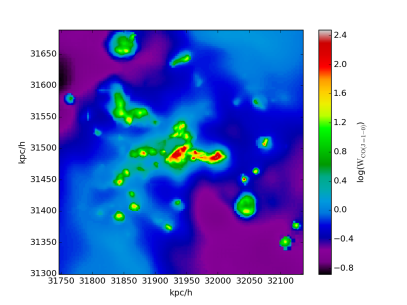
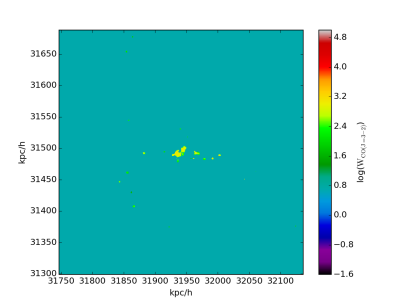
High-resolution observations may have the power to distinguish between these two broad classes of models. For example, high resolution cosmological zoom simulations (Davé et al., 2010; Narayanan, 2015) suggest that DSFGs owe their origin to hierarchical growth in a LCDM cosmology will show significant substructure around the central galaxy when observed at high-resolution. However, much of this gas associated with subhalos may be relatively diffuse compared to the relatively dense gas in the central halo. Figure 7 presents synthetic CO emission from one such model for DSFG formation (Narayanan et al., 2015). The subhalos being accreted onto the central halo are clearly present in the ground state CO(1-0) transition. However, even CO(3-2) has an effective density too large to light up in the diffuse subhalos.
Because of this, (sub)mm-wave interferometers such as ALMA may miss the large scale gaseous substructure in high-z DSFGs, necessitating the use of sensitive radio-wave interferometers like the ngVLA. In this respect, recent observational work on low-surface-brightness CO(1-0) emission in and around high-z proto-cluster radio galaxies (Emonts et al., 2014, 2015), already revealed very widespread ( kpc) reservoirs of diffuse molecular halo gas, reminiscent of the simulations shown in Figure 7. These low-resolution observations were done with the Australia Telescope Compact Array, with its five antennas packed in ultra-compact array configurations that surpass those of the current VLA. The ngVLA can revolutionise the studies of low-surface-brightness CO(1-0) emission with a densely packed core that consists of many short-baseline elements, with more than an order of magnitude more sensitivity than existing compact arrays.
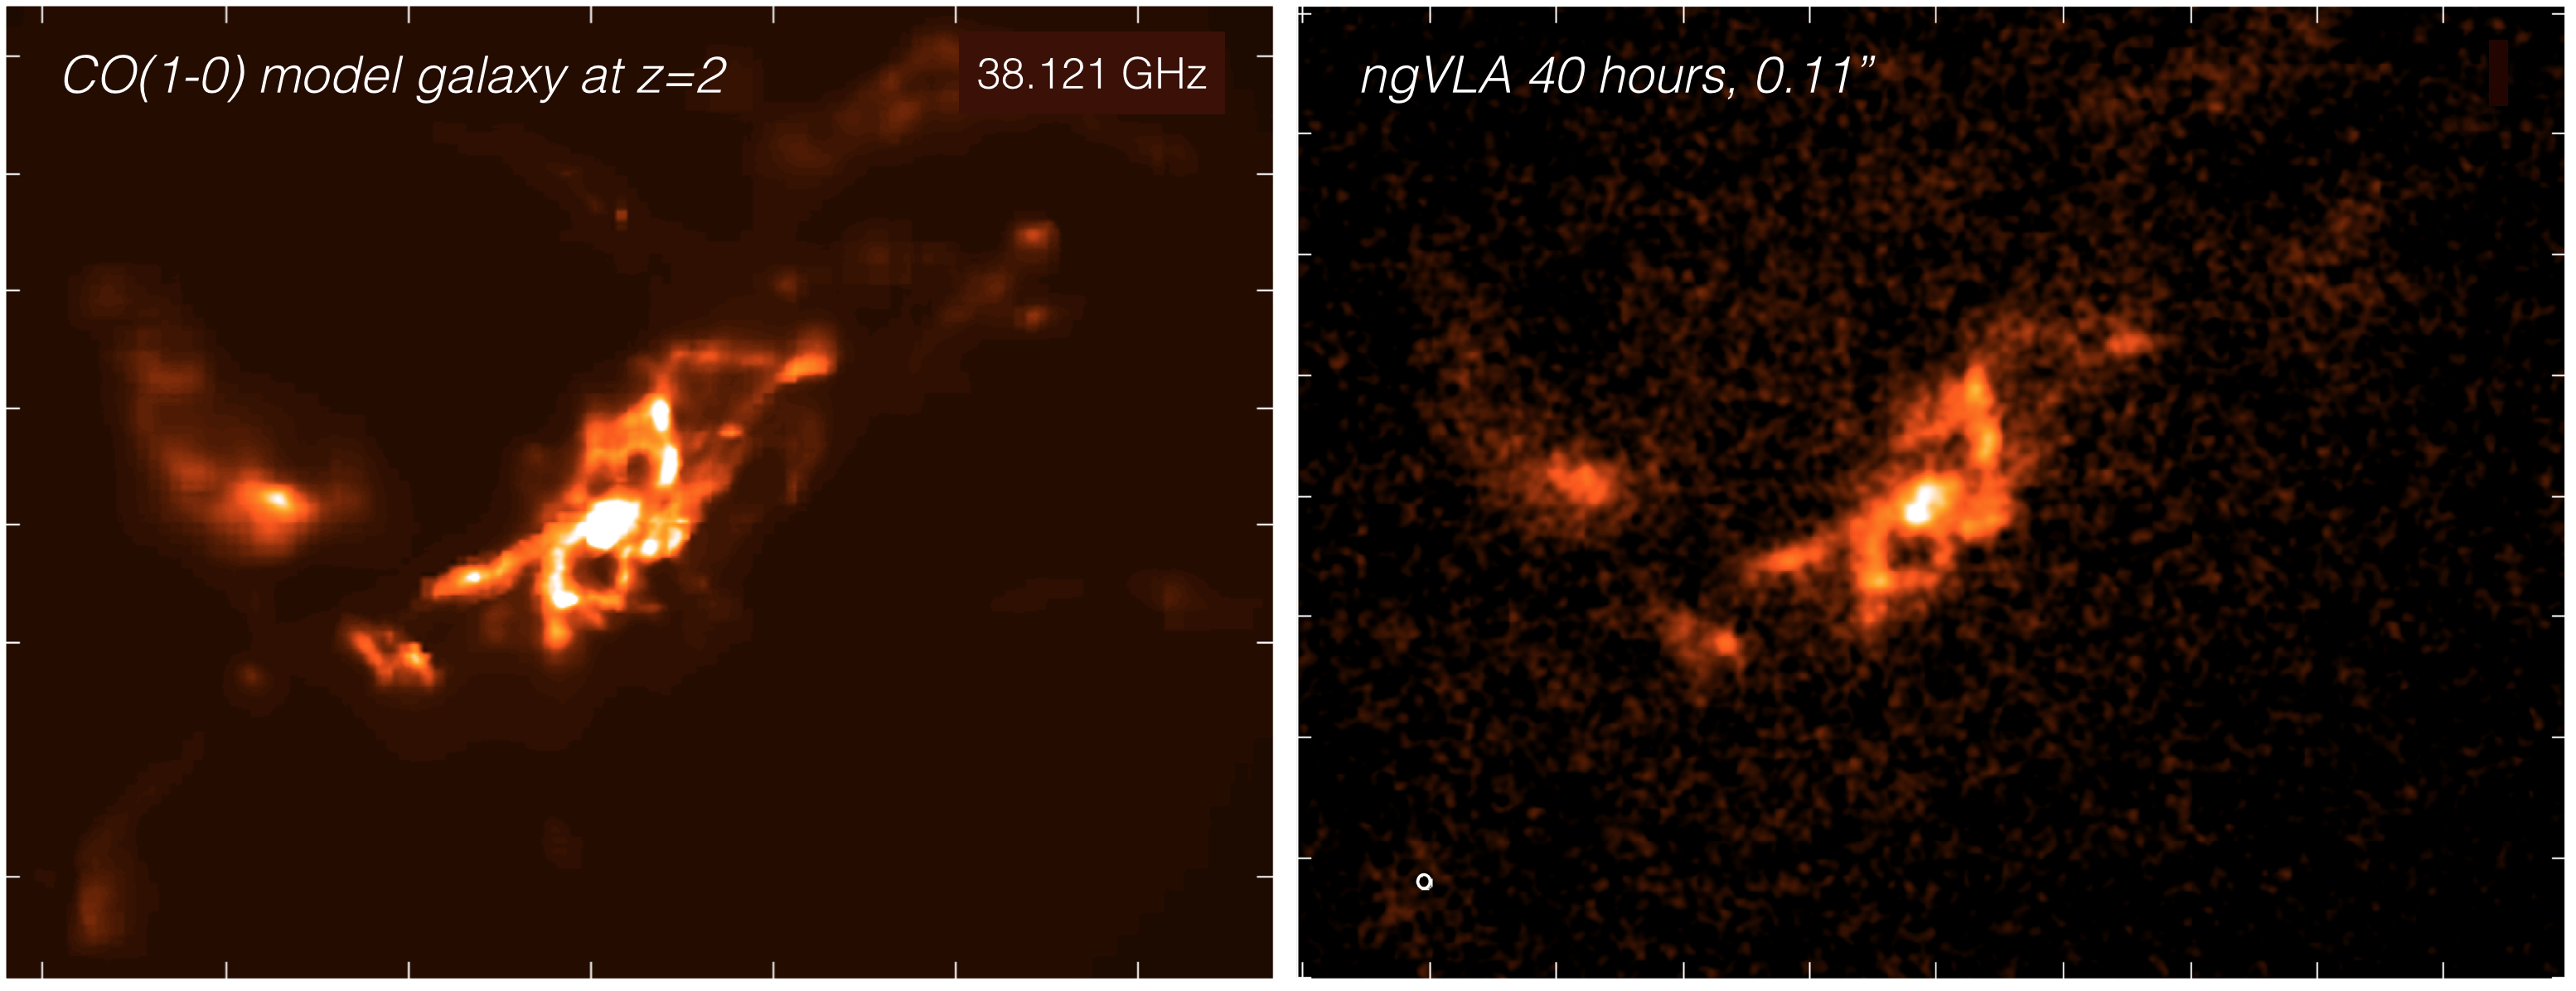
Figure 8 shows this same hydrodynamically simulated galaxy as shown in Figure 7, but with simulated noise properties characteristic of the ngVLA 40 hours of integration at 0.11′′ resolution. Such observations of high- systems is currently quite limited with the JVLA (GN20, shown in Figure 10, is exceptionally luminous and required 120 hours of observations to reach adequate sensitivity). The sensitivity improvements with ngVLA will not only cut the time per source substantially but reach much more intrinsically faint systems.
3.5 Dense gas tracers
The critical density required to collisionally excite CO is relatively low (n102–103 for the lower-J transitions), meaning that observations of CO are a good way to trace the total molecular gas reservoirs in galaxies. At the same time, this also makes CO a fairly poor tracer of the dense molecular cores where star-formation within distant galaxies is ultimately taking place. High dipole moment molecules like hydrogen cyanide (HCN), on the other hand, are only collisionally excited at very high densities, making them much more reliable tracers of the very dense gas directly associated with the formation of individual stars. Some studies of HCN in the nearby universe have even found evidence that the ratio of HCN luminosity to FIR luminosity remains constant over 8 orders of magnitude in HCN luminosity, suggesting that HCN may be a fundamental direct probe of star forming ‘units,’ and that the only difference between star formation on different scales and in different environments is the number of these fundamental star-forming units (e.g. Gao & Solomon, 2004; Wu et al., 2005, 2010; Zhang et al., 2014).
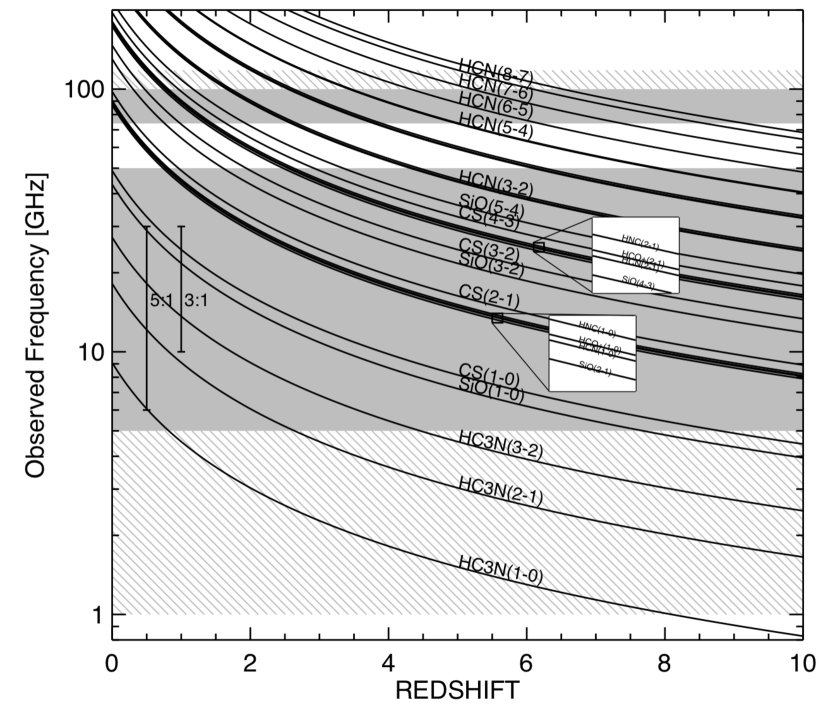
While some recent observational studies argue that the local HCN-FIR relation may in fact be more nuanced (e.g. García-Burillo et al., 2012) – a possibility for which further investigation by the ngVLA will be essential – it is clear that even less is known about dense gas tracers in the more distant universe. Owing to the fact that they only trace the densest regions of the ISM and are therefore less abundant, emission from the rotational transitions of molecules like HCN is usually an order of magnitude fainter than CO, complicating efforts to detect and study these tracers at high-. As a result, only a few high-z galaxies have been detected in dense gas tracers to-date (e.g. Solomon et al., 2003; Vanden Bout, Solomon & Maddalena, 2004; Carilli et al., 2005; Gao et al., 2007; Riechers et al., 2007, 2011; Danielson et al., 2011). With ALMA now online, the situation will clearly improve dramatically in the near future. However, as with CO, ALMA will only be able to detect the mid- and higher-J transitions of dense gas tracers like HCN, HNC, and HCO+. These higher-level transitions are less directly tied to the total dense gas mass, requiring assumptions about the (highly uncertain) excitation ratios. In addition, these higher-J transitions are more likely to be affected by IR pumping, which local studies find may be common in ultraluminous galaxies (e.g. Aalto et al., 2007). Thus, while necessary to understand the overall excitation properties of high- sources, the ALMA-detectable transitions may be unsuitable as tracers of the total dense gas mass.
The current JVLA probes the right frequency range to detect the crucial low-J transitions of these high critical density molecules (Figure 9). However, its limited sensitivity means that the current state-of-the-art for high-z detections consists of a smattering of strongly lensed hyper-starbursting quasar hosts (e.g. Vanden Bout, Solomon & Maddalena, 2004; Riechers et al., 2007, 2011). With significantly increased sensitivity, the ngVLA would extend studies of the dense gas mass at high-z beyond this handful of extreme objects for the first time. In addition to tracing the dense gas mass at high-z, such studies are critical for constraining models of star formation based on the gas density PDF, as these models make testable predictions about the FIR-HCN relation in FIR-luminous objects (e.g. Krumholz & Thompson, 2007; Narayanan et al., 2008). Finally, while angular resolution is not a priority for these photon-starved studies, the brightest objects could even be spatially resolved by a ngVLA on kpc scales (requiring baselines on the order of the current VLA). The ngVLA would thus enable detailed studies of the dense gas at high-redshift such as are currently only possible in the local universe.
4 Dynamics
Of the several hundred galaxies currently detected in molecular line emission (see Carilli & Walter, 2013, for a review), the vast majority are spatially unresolved or – at best – marginally resolved. Particularly in the low-J (J3) CO transitions which trace the bulk of a galaxy’s gas reservoir, only a handful of high-redshift galaxies have been resolved to-date (Riechers et al., 2008; Hodge et al., 2012, 2013). This lack of spatial resolution makes it very challenging to do any detailed dynamical modeling. By providing sub-arcsecond resolution imaging of the gas and dust in high-redshift galaxies, the ngVLA will allow detailed studies of morphologies and – even more critically – galactic dynamics. This section discusses some of the applications this ability will have for studies of galaxy evolution at high-redshift.
4.1 The relative role of mergers versus disks
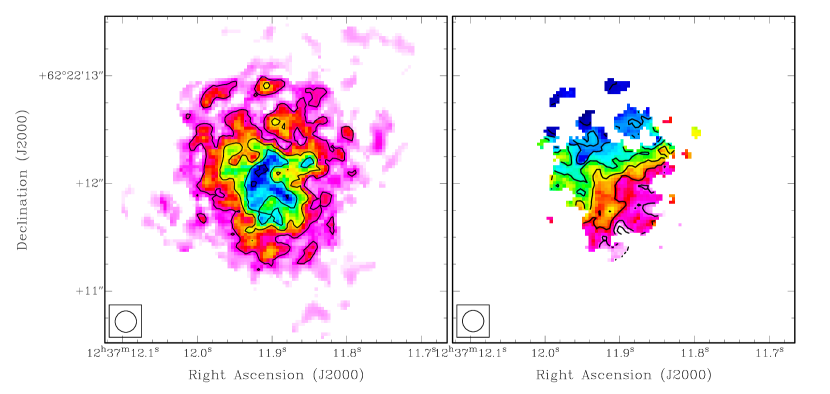
What is the relative role of major mergers versus secular disk evolution to galaxies in the early Universe? This question applies not only to the most massive, dust-obscured starbursts (e.g. Narayanan et al., 2010; Davé et al., 2010; Hayward et al., 2012), but also to the general mass assembly of galaxies at (e.g. Förster Schreiber et al., 2009; Dekel et al., 2009), when half of the stellar mass in galaxies was assembled. While the JVLA can already spatially resolve emission on scales as small as 0.05′′ (equivalent to 400 pc at a redshift of ), it lacks the surface brightness sensitivity to use this capability on the faint, extended gas reservoirs in even the most CO-luminous high-redshift galaxies. The best examples to-date of resolved CO at high-redshift (e.g. Riechers et al., 2008; Hodge et al., 2012) therefore settle for the VLA’s B-configuration (rather than the more extended A-configuration), reaching angular resolutions of 0.2′′. This resolution allowed Hodge et al. (2012) to model the dynamics of the DSFG named GN20, finding evidence for a rotating disk with a flat rotation curve (see Figure 10). However, even in this more compact configuration, the observations of this extremely gas-rich galaxy (M 1011 M⊙) required 50 hours on source, or a total of 100 hours with overheads. It is thus currently not possible to do this experiment on more than a handful of the most extreme high-redshift galaxies (this is also demonstrated by the example simulation in the previous section, shown in Figure 8). Thus, even though the angular resolution of the JVLA is already adequate for studies of high- galactic dynamics, an increase in the surface brightness sensitivity by an order of magnitude would be required for the ngVLA to feasibly conduct such studies.
The newly completed ALMA has both the resolution and sensitivity required to study the resolved morphologies and dynamics of some high-redshift galaxies. However, as discussed in Section 3.1, ALMA is only able to detect the high-J transitions of CO in high-redshift galaxies (see Figure 2), with CO(3-2) and CO(5-4) the lowest transitions accessible at and , respectively (assuming the current bands). Beyond the well-known uncertainties in global excitation ratios (Figure 3), the higher-J (J3) lines have been shown to give a biased and incomplete view of the reservoirs in some high-redshift galaxies, as shown previously in Figure 7. In particular, observations of the CO in normal star-forming galaxies and DSFGs demonstrate that CO(3–2) emission can miss up to half of the gas mass and imply reservoir sizes that are three times more compact than determined from the ground-state CO(1–0) transition (e.g. Hainline et al., 2006; Ivison et al., 2011; Dannerbauer et al., 2009; Aravena et al., 2010; Riechers et al., 2011). It is thus crucial to extend down to the frequency range of the VLA (i.e., down to 10-20GHz) in order to probe the dynamics of the bulk of the gas directly.
Note that the [Cii] emission line at a rest-frame 158 m has been quite successful in characterizing the dynamics of some high-redshift galaxies, although the interpretation is difficult as the photo-disassociation region (PDR)-generated line’s emission represents a complex mix of physical mechanisms (Olsen et al., 2015). While the kinematics of the [Cii] line is certainly a useful diagnostic of potential mergers, it is unlikely to trace the full extent of a galaxy’s cold gas reservoir. In contrast, the CO(1-0) line provides not only dynamics, but a direct link to the molecular gas supply, as detailed in the previous section.
4.2 Molecular outflows
In addition to distinguishing between mergers and disks, the dynamical information can shed light on the presence of galactic inflows/outflows. Galactic winds, in particular, are thought to play a major role in regulating the formation of stars by acting as a source of negative feedback on the star-forming ISM. As such, they are now a common feature in theoretical models of galaxy evolution. By observing the molecular component of such winds, one can measure the total molecular mass outflow rate, which, along with the cool atomic phase, is thought to comprise a significant fraction of the wind (e.g. Walter, Weiss & Scoville, 2002; Rupke, Veilleux & Sanders, 2005; Alatalo et al., 2011). Recent studies with ALMA have mapped galactic winds in the local Universe in unprecedented detail (e.g. Bolatto, Wolfire & Leroy, 2013) and, by detecting the redshifted emission from low-J CO transitions in distant galaxies, the ngVLA would allow studies of the importance of galactic outflows across cosmic time.
4.3 Measuring the CO-to-H2 conversion factor
Finally, the dynamical information is also critical to get back to the physical parameter that is ultimately of concern: the total molecular gas mass. Even with the ground-state transition of CO, an assumption is required about the CO–to–H2 conversion factor XCO in order to convert the observed CO luminosity to the total molecular gas mass, M. Locally, much progress is being made in directly measuring the conversion factor through various methods, including applying virial techniques to resolved CO emission from discrete molecular clouds (Bolatto, Wolfire & Leroy, 2013, and references therein). Unfortunately, the direct determination of the conversion factor in high- objects remains extremely challenging with current instruments. Thus, the best we can do at high- right now is to extrapolate from what we know about local galaxies, which may not be appropriate analogues for the galaxy populations that exist at earlier cosmic times. If our community is able to build the ngVLA, that could achieve resolutions of 5-15mas in the (unbiased) low-J CO lines, we could begin resolving individual molecular clouds on scales of 40-100 pc at , allowing us to measure the conversion factor in high- galaxies directly.
5 Continuum Emission
Single-dish submillimeter imaging has contributed immeasurably to the study of high-redshift galaxy evolution, particularly by unveiling a significant population of extremely dusty star-forming galaxies that have been incredibly challenging for cosmological simulations to explain (Casey, Narayanan & Cooray, 2014, and references therein). This submillimeter imaging can cover large fields and produce uniformly selected samples of distant DSFGs chosen in a single bandpass to a well-established flux limit, making the selection of these sources straightforward to model. These wavelengths are also equally sensitive to both low and high redshift galaxies, due to the very negative -correction on the Rayleigh-Jeans tail of dust emission’s blackbody. However, images from single-dish submillimeter facilities have low resolution, and blank field observations run up against the confusion limit quickly. Interferometric submillimeter/millimeter imaging has high spatial resolution and sensitivity, but the field-of-view is small. Radio continuum imaging surveys with the VLA do not suffer from extinction, have high spatial resolution, and can cover large areas. However, at the present time, the deepest surveys made with the VLA can only find the most luminous galaxies at high redshifts, with star-formation rates above 100 M⊙ yr-1. Here we discuss various ways in which continuum work with the ngVLA will push the boundaries of galaxy evolution studies by probing the dust-unbiased star formation from galaxies at high redshift.
5.1 Synchrotron as a tracer of cosmic star formation
Unlike the rest-frame UV/optical, synchrotron emission is relatively unaffected by dust attenuation, making it a valuable tracer of the total amount of star formation in galaxies, unbiased by dust. The main downside to using synchrotron emission as a star formation tracer is the limiting sensitivity of current facilities. For example, the deepest existing 1.4 GHz VLA image ( of 11.5 Jy of the CDF-N by F. Owen) only probes down to ULIRG luminosities (ultra-luminous infrared galaxies, L 1012 L⊙) to and LIRG luminosities (luminous infrared galaxies, 1011 L⊙) to . The ngVLA can help us construct a complete star formation history by delivering a large homogeneous sample that is insensitive to extinction over a wide range of luminosities and SFRs out to high redshifts (e.g., these same luminosity limits to ). With its unprecedented sensitivity, the ngVLA will even be sensitive to nearly Milky Way-like galaxies at redshifts of z1–3, the peak epoch of galaxy formation. For example, using a 5–15 GHz band (3:1 instantaneous RF bandwidth) and assuming a sensitivity 5VLA (10VLA) would result in a 5 detection limit of 500 nJy beam-1 (250 nJy beam-1) after only 10 hours of on-source integration time. Assuming baselines where the source is unresolved, this translates to a SFR of 10.8 M⊙ yr-1 (5.4 M⊙ yr-1) at .
5.2 The promise of free-free as a SFR tracer
Although lower frequencies have the advantage of a larger field-of-view, which is necessary to get large numbers of very high-redshift galaxies, there are several major issues to consider to determine which frequencies would be best suited for mapping the star formation history in the radio. First, what are the dominant physical mechanisms contributing to the radio emission at high redshifts? Second, how well can we calibrate these mechanisms to estimate SFRs? Third, can we separate AGNs from star-forming galaxies? With synchrotron emission, there is substantial contamination of the star-forming samples by AGNs, and there are uncertainties in the conversion from radio flux to star formation rate (SFR).
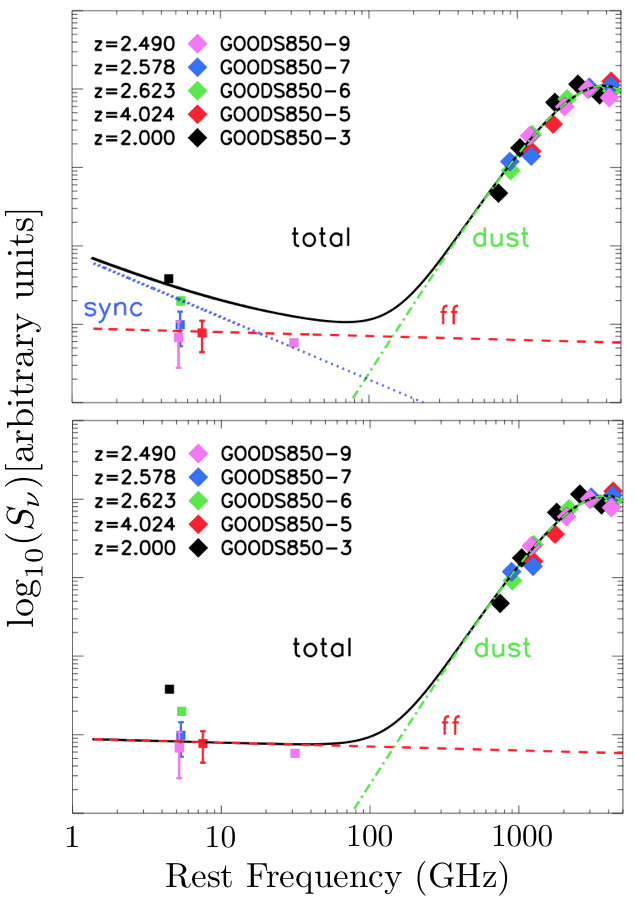
Free-free emission is dominant at rest-frame frequencies of tens of GHz and is directly proportional to the production rate of ionizing photons by young, massive stars (though it may be biased towards starbursts), making it useful for measuring SFRs (e.g. Murphy et al., 2015). However, even at these high frequencies there can be substantial synchrotron contributions that have to be taken into account. For example, Rabidoux et al. (2014) find a free-free fraction of 55% at 33 GHz for a sample of local star-forming galaxies. Using multiple measurements over the broad wavelength coverage of the ngVLA, we will be able to observe the full radio spectral energy distributions (SEDs; Figure 11) of galaxies out to high-redshift, allowing us to separate the pure synchrotron and free-free regions of the spectra and hence estimate the relative fractions produced by each mechanism as a function of frequency for determining more accurate SFRs.
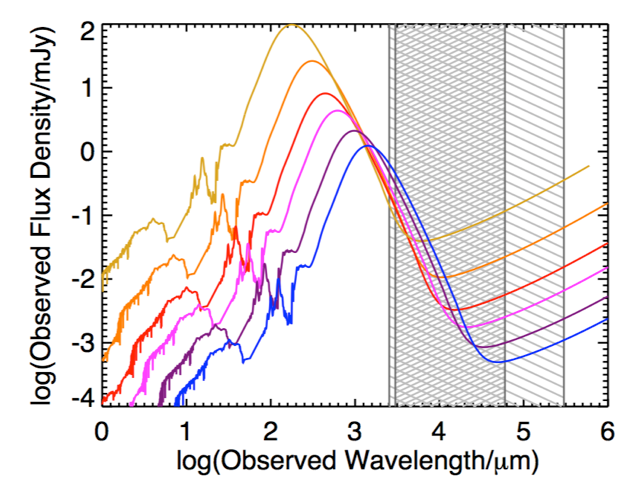
One important factor to consider in this regard is the quenching of the synchrotron emission by the cosmic microwave background radiation (CMBR). Compton cooling of relativistic electrons on the CMBR dominates over the synchrotron emission when the CMBR energy density exceeds the galaxy magnetic energy density (e.g. Condon, 1992; Murphy, 2009). Since the energy density of the CMBR goes as , there is a redshift dependence. Moreover, the synchrotron emission will be highly quenched in moderate SFR galaxies at high redshifts but possibly never in ULIRGs, so there is also a luminosity dependence. This means that high-redshift galaxies with moderate SFRs will be totally free-free, modulo the possible contribution from anomalous dust emission (Adam et al., 2015), which may arise from spinning dust grains (e.g. Draine & Lazarian, 1998). We illustrate the various cases in Figure 12. In (a) we show the synchrotron emission (dotted; assuming a constant spectral index) as it would be for either a moderate luminosity, low-redshift galaxy or a ULIRG, as well as the free-free emission (dashed), the dust emission (dot-dashed), and the total emission (solid), while in (b) we show the synchrotron emission suppressed as it would be for a moderate luminosity, high-redshift galaxy. Thus, the most secure SFRs will come from observations made at high frequencies (rest-frame GHz) where the free-free emission significantly dominates for all galaxy types. This range will be readily accessible out to high-redshifts with the ngVLA.
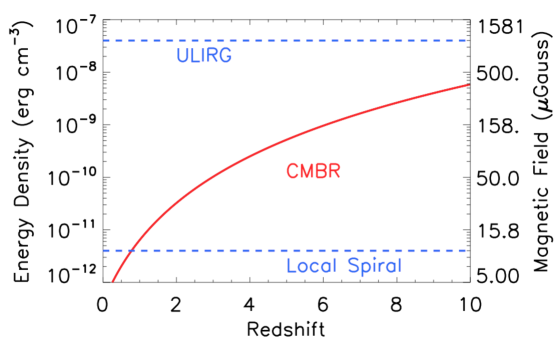
One potentially interesting benefit of the CMBR quenching of the synchrotron emission is that by mapping out the radio SEDs for a number of galaxies of a given luminosity with the ngVLA and seeing at what redshift the shape changes from synchrotron plus free-free to free-free only, we can get a rough galactic magnetic field measurement for that luminosity by equating it to the CMBR energy density (e.g. Carilli, 2001). We show this in Figure 13, where we plot energy density versus redshift for a local spiral and a ULIRG (McBride, 2014), and for the redshift-dependent CMBR. We show the magnetic field strength on the right-hand vertical axis.
Another benefit of the CMBR quenching is that extended AGNs are expected to be quenched at high redshifts since the magnetic fields in the extended radio jets are small, leaving only compact AGNs (e.g. Afonso et al., 2014). Since the typical radio sizes for star-forming galaxies () are larger than those for compact AGNs (Cowie et al., in prep), it should be straightforward to separate star-forming galaxies from AGNs even with only moderately sub-arcsecond spatial resolution.
5.3 Thermal dust emission at the highest redshifts
Thermal re-radiation from dust dominates a galaxy’s spectrum at rest frequencies above 200 GHz. This dust emission is dominantly powered by recently-formed, massive stars, making it an excellent tracer of the bolometric luminosity in dusty starbursts. While ALMA is already revolutionizing our understanding of dusty star forming galaxies at intermediate redshifts (e.g., Karim et al., 2013; Hodge et al., 2013; Weiß et al., 2013; Hezaveh et al., 2013; Simpson et al., 2014), at sufficiently high-redshift, the ngVLA bands will also benefit from the very-negative K-correction on the cold dust Raleigh-Jeans tail. As a consequence, the higher frequency coverage of the ngVLA will bring with it the exciting possibility of detecting thermal emission from dust at the highest () redshifts, providing important constraints on high- dust emission.
One crucial caveat is that detecting this thermal dust emission against the background of the CMB becomes more difficult at higher redshift (da Cunha et al., 2013). As discussed in Section 3.2 in regards to CO emission, the net effect of the higher CMB temperature at high-z is to decrease the contrast between the target and CMB, implying that detecting thermal dust emission at the highest redshifts may only be feasible for the most luminous star-formers. It will be critical to take this effect into account even for detected galaxies, as the contrast against the CMB is frequency dependent. Failing to account for this effect could therefore affect the interpretation of the dust SED, yielding biased estimates of dust temperature, mass, emissivity index and luminosity (da Cunha et al., 2013).
6 AGN and supermassive black holes
The ngVLA will have a large impact on studies of the evolution and characteristics of massive black holes at the centers of distant galaxies. In this section we outline some key science goals related to the evolution of active galactic nuclei (AGN) and how the ngVLA will be uniquely useful.
6.1 Black hole masses from gas dynamics
The proposed capabilities of the ngVLA offer the tantalizing possibility of directly observing gas dynamics in the vicinity of the super-massive black holes at the centers of massive galaxies, and thereby also of measuring the masses not just of AGN, but of quiescent super-massive black holes. Such observations require being able to resolve the “radius of influence” of a black hole, i.e. the distance within which the black hole’s gravitational potential significantly affects the orbital motion of the surrounding stars and interstellar gas. From Krolik (1999), the radius of influence is given approximately by . From the M- relation as calibrated by Kormendy & Ho (2013)
Combining these two formulae yields
Thus, a M⊙ black hole has a radius of influence of about 54 pc, corresponding to almost 30 mas at , easily resolvable to the ngVLA with long baselines. The ngVLA will revolutionize estimates of black hole masses in the large fraction of systems that are heavily obscured in the optical/near-IR, where estimates from optical gas or stellar dynamics cannot be obtained even with 30 m class optical/near-IR telescopes like GMT, TMT, and the E-ELT.
Observations from the ngVLA will also enable high resolution observations of galaxy dynamics (see discussion in § 4) to constrain models that can be used to estimate velocity dispersions for use with the relation in high- galaxies. Current observations barely resolve the host galaxies, making reliable separation of circular velocity and velocity dispersion difficult (e.g. Kimball et al., 2015). Although resolving the dynamic across parsec scales may be limited in practice to the , full galaxy wide dynamics will be essential for characterizing distant sources on the relation.
6.2 The nature of radio emission from radio-quiet AGN
Radio emission from radio-loud AGN is powered by synchroton emission from relativistic jets emanating from a region very close to the central black hole. However, even traditionally radio-quiet objects have significant radio emission, the origin of which is unclear. The radio emission may originate in scaled down versions of the jets of radio-loud objects, in synchrotron emission from material shocked by thermal winds from the accretion disk (Zakamska & Greene, 2014), or from star formation in the quasar host (e.g. Kimball et al., 2011). Determining which of these dominates is important, especially for our understanding of the feedback process in radio-quiet objects. If jets are ubiquitous, they can be agents of feedback along with any thermal winds. If star formation dominates, it implies that most quasar hosts are heavily star-forming at the level of ULIRGs, which would be a challenge for models in which AGN feedback is supposed to inhibit star formation.
Determining which process dominates requires high spatial resolution, multifrequency observations to distinguish the jets and flat-spectrum cores expected from weak radio AGN from more diffuse steep spectrum emission from thermal shocks, and a combination of synchrotron and free-free thermal emission (at high frequencies) from star formation.
6.3 Weak radio AGN in normal galaxies
Our own galaxy contains a weak radio AGN, SgrA∗, with a luminosity in its flat spectrum core . The ngVLA could detect such an AGN in nearby galaxies out to Mpc with a flux density of 1 Jy (enclosing the nearest nearby galaxies), with a detection in 10 hours. A more luminous radio AGN, such as that in M87 () could even be seen out to . Such AGN are important for “maintenance” or “radio” mode feedback in massive galaxies, and seem only to be produced by the most massive black holes. They can thus trace the evolution of these black holes from when they form at to the current epoch. Although the SKA will excel at finding many millions of such objects, isolating those at high redshift will require additional selection using high frequency data. In these data we can pinpoint the steepest spectrum objects, which the ngVLA will easily identify. The ngVLA will also be the only telescope capable of determining the morphologies of these objects and studying how the radio jets interact with the ISM of their host galaxies.
6.4 Multiple AGN
The combination of high resolution and high sensitivity will allow the ngVLA to resolve two merging AGN within their host galaxies. At 10 GHz, the ngVLA’s “goal” resolution is 30 mas, which could easily distinguish two AGN separated by pc at . Thus, the fraction of dual and multiple AGN can be used to constrain black hole merger rates (e.g. Fu et al., 2015) and the contribution of mergers to the growth of supermassive black holes.
If a VLBI component with intercontinental baselines is added to the ngVLA, this opens up the possibility of obtaining baselines with high sensitivity at pc-scale resolutions for AGN at . This is important, as, even after decades of work, it is still unclear how, or even if, the final stages of supermassive black hole mergers take place in the centers of galaxies. This final parsec problem refers to the difficulty of understanding how a binary black hole loses angular momentum in a regime where neither dynamical friction with other stars nor gravitational radiation is effective. Although various theories have been put forward to overcome this problem (e.g. Vasiliev, Antonini & Merritt, 2015), statistics of binary black hole separations in galaxy cores with a range of dynamical properties are needed to constrain these models.
6.5 Molecular gas and feedback in AGN
In order to understand the effects of AGN (and stellar) feedback on galaxy formation, it is important to be able to study molecular outflows, not just in CO, but also in dense gas tracers (HCN, HCO+, CS, etc, as discussed in § 3.5) where CO is optically thick. It remains an open question as to whether the most important feedback mechanism is through expulsion of gas during short, but violent feedback episodes in “quasar” mode, or “radio” mode, where little, if any outflowing gas exceeds the escape velocity of the system, but jets can inject turbulence into the ISM sufficient to prevent star formation. The ngVLA will allow the detailed study of gas dynamics in the host galaxy to help us answer this important question.
Another interesting application of the ngVLA will be the study of gas chemistry in AGN versus star-forming galaxies. A highly obscured AGN is very difficult to find using any conventional technique: optical line diagnostics, X-rays and mid-IR emission from hot dust can all be blocked by a sufficient column of dust and gas; far-infrared emission is hard to distinguish from star formation; and radio free-free emission can arise either from AGN photoionization or from star formation. It has been speculated, however, that some molecular species may be more (or less) common in regions dominated by XDR chemistry, due to an AGN, or PDR chemistry, due to star formation (e.g. Martin et al., 2015; Izumi et al., 2015). If so, detection of molecular transitions in the 3 mm band (100 GHz) of ngVLA will provide the best evidence possible of the presence of very highly obscured AGN, and some of the lower-J transitions at lower frequencies.
6.6 Sunyaev-Zeldovich Effect from Quasar/Starburst Winds
Thermal winds from AGN and starbursts are predicted to be detectable via the Sunyaev-Zeldovich effect in long (several tens to hundreds of hours) integrations using ALMA (Chatterjee et al., 2008; Rowe & Silk, 2011), an ngVLA would be many times faster at detecting these, and could be used to characterize the outflows in extent and pressure, constraining quasar lifetimes and providing important information to feedback models. There has been a claim of a statistical detection of quasar winds via this technique in Planck data (Ruan, McQuinn & Anderson, 2015), but only the ngVLA will be able to study it in detail in individual objects.
7 Polarimetry and Cosmic Magnetism
Magnetic fields are ubiquitous in nature and have been detected on all astrophysical scales up to, and tentatively beyond, those of galaxy clusters. Magnetic fields can be dynamically important, for example having comparable energy density to gravity and turbulence in interstellar gas (Beck, 2007), and are essential for understanding a wealth of astrophysical processes from star to galaxy formation. The buildup and impact of magnetic fields over cosmic time remain outstanding problems in astrophysics. Polarimetry is a powerful tool for unveiling the magnetic Universe, and for providing a window into associated science such as radiative transfer theory, properties of dust, and black hole accretion flows.
To date, far-IR and millimeter polarimetry with facilities such as the JCMT and CARMA have been limited to angular resolutions of a few arcseconds. Sub-arcsecond resolution can be attained with the VLA and ALMA, and also with the VLBA albeit at limited surface brightness sensitivity. Polarimetry with ALMA and the recently upgraded Jansky VLA is only just beginning and will soon deliver scientific yields. The groundwork from these studies will set the stage for research directions within the new parameter space of the ngVLA. Key to this new parameter space is angular resolution, which will minimize beam depolarization (vector averaging of polarization position angles within a large observing beam), enabling quantitative studies of magnetic fields in unprecedented detail. The sensitivity improvement of the ngVLA will enable the lowest signal-to-noise total intensity science with the VLA and ALMA to be studied in polarization.
The SKA will play a fundamental role in tracing cosmic magnetism through studies of synchrotron radiation and Faraday rotation. By going to higher frequencies, the ngVLA will open a unique window on cosmic magnetic fields and science accessible through microwave polarimetry. The 5-100 GHz frequency range proposed for the ngVLA will facilitate observations of polarized emission from dust, atomic and molecular spectral lines, and synchrotron radiation from extreme Faraday rotation environments as well as those that are significant depolarized at lower frequencies. The ultra wide bandwidths proposed for the ngVLA will allow detailed Faraday structure mapping. We address each of these with example science themes in the following sections. We note that while the following sections necessarily focus on extragalactic science, much of the discussions are also relevant for Working Groups 1 (Cradle of Life) and 2 (Galaxy Ecosystems) through topics such as cometary comae, circumstellar disks, planetary nebulae, and Galactic molecular clouds.
7.1 Dust Continuum
Linearly and circularly polarized thermal emission at far-IR and millimeter wavelengths can be produced by elongated, spinning, aligned dust grains. Despite over half a century of effort, a comprehensive theory does not yet exist to explain exactly how dust grains are aligned (Lazarian, 2007). Observations indicate that alignment is with respect to the magnetic field, though the alignment mechanism may not be magnetic. Promising candidates include radiative alignment via torques that are efficient when grain sizes are comparable to the wavelength, and mechanical alignment in the presence of gas flows. The degree of fractional polarization can provide diagnostics of grain characteristics (Hildebrand & Dragovan, 1995), Typical observed fractions in molecular clouds are a few percent (Leach et al., 1991; Greaves et al., 1999). When measurements of turbulent velocities and the dispersion of polarization position angles across a source are available, the Chandrasekhar-Fermi method (Chandrasekhar & Fermi, 1953) can be used to estimate magnetic field strengths in the plane of the sky (e.g. Falceta-Goncalves, Lazarian & G., 2008). This method requires the dispersion of position angles to be meaningfully coupled to turbulent structure. If this condition is not met, for example due to beam depolarization, then magnetic field strengths will be overestimated (Houde, 2009). Similarly, not all tangled magnetic field structures will be sampled along the line of sight (LOS) when the emission is optically thin, leading to overestimated magnetic field strengths. The three-dimensional magnetic field distribution can be reconstructed through a combination of dust polarimetry and measurements of ion-to-neutral molecular line width ratios (Houde et al., 2005).
The ngVLA will be capable of mapping magnetic fields in the molecular environments of a large number of nearby galaxies through dust polarimetry. For example, an ngVLA with collecting area 5 x VLA could map the millimeter wavelength dust polarization and magnetic field geometry in a galaxy like the starburst M82 ( Mpc; Greaves et al., 2000; Reissl, Wolf & Seifried, 2014) in less than 10h if it were located at a distance of 350 Mpc, i.e. well beyond the boundary of the Local Supercluster (Laniakea), sampling neighboring superclusters. Such studies will be highly complementary to other ngVLA probes of the interstellar medium in galaxies such as (polarized) synchrotron emission and molecular line diagnostics, and also to lower frequency studies of nearby galaxies and their magnetism with the SKA (Beck, 2015). This will enable a detailed understanding of the environments of local galaxies, including the interaction between gas and magnetic fields, in turn providing constraints on the end-points () of magnetized galaxy evolution models (e.g. Van Eck et al., 2015). Studies of local volume supernova remnants through their sometimes highly fractionally polarized dust emission (Dunne et al., 2009) may be developed to similar effect. ngVLA studies of dust polarization in environments where grain alignment is expected to be occurring, such as accretion disks (Aitken et al., 2002), will enable new probes of magnetic fields.
7.2 Spectral Lines
Rotational emission lines of molecules can be linearly polarized through the Goldreich-Kylafis (G-K) effect (Goldreich & Kylafis, 1982). This arises when excited states of a molecule are exposed to anisotropic radiation, either from an external source (e.g. nearby infrared emitter) or internally from a gradient in the line optical depth (e.g. due to a local velocity gradient). De-excitation then results in spectral lines with net linear polarization, with fractional levels typically a few percent. The production of linear polarization in absorption lines against unpolarized continuum sources, as well as the production of both linear and circular polarization in the absorption lines against linearly polarized continuum sources, will also arise in the presence of optical depth anisotropies (Kylafis, 1983).
By utilizing the G-K effect, the ngVLA will be capable of mapping magnetic fields in the molecular environments of a large sample of galaxies extending to high redshifts. For example, assuming a channel rms noise of 10 Jy beam-1, the ngVLA could detect CO(1–0) in a Mgas 1010 M⊙ galaxy out to with sufficient sensitivity to detect a few percent polarization. Recently, Li & Henning (2011) mapped CO polarization in M33 to investigate the interplay between large and small scale magnetic fields on the formation of molecular clouds. ngVLA studies capturing more detail within larger source samples will be critical for understanding the environmental impacts of magnetic fields within galaxies over cosmic time. Spectral line polarimetry with the ngVLA may be essential for studying galactic magnetic fields at high redshift, for example in main sequence galaxies where synchrotron probes will be of limited use due to CMBR quenching (see Figure 13).
The G-K effect will lead to polarization of polycyclic aromatic hydrocarbon (PAH) emission. ngVLA studies of polarized anomalous microwave emission (AME; Draine & Lazarian, 1998) may therefore provide insight into grain alignment theory and perhaps even the very nature of PAHs. While such studies may be most productive within the Galaxy, extragalactic investigations of AME (e.g. Hensley, Ostriker & Ciotti, 2014) and its polarization characteristics will offer important consistency checks.
Elliptical polarization of atomic and molecular emission and absorption lines is produced by the Zeeman effect. The presence of a magnetic field causes the spectral line to be split into three components: a linearly polarized component that is unshifted in frequency and two elliptically polarized components shifted symmetrically above and below the original line frequency. The elliptical polarization is a combination of (intrinsic) circular polarization proportional to the strength of the line of sight magnetic field with opposite sign for each split component, and (propagation induced) linear polarization proportional to the strength of the magnetic field oriented perpendicular to the position angle in the plane of the sky. The magnitude of the frequency shift depends on the strength of the total magnetic field and the splitting factor (Landé g-factor), the latter dependent on the magnetic moment of the species. For most spectral lines except those associated with strong masers (e.g. OH), the magnitude of the frequency splitting is much less than the spectral line width, in which case the Zeeman observations are only sensitive to the line of sight magnetic component. Zeeman splitting is approximately 3 orders of magnitude weaker for non-paramagnetic species than paramagnetic species.
The ngVLA frequency range will enable Zeeman studies of paramagnetic molecules such as C4H, SO, and C2H (and potentially CN depending on the upper frequency bound), non-paramagnetic molecules such as H2O and NH3, and radio recombination lines from atomic species such as H and C. Unsampled magnetic structures within the telescope observing beam or along the line of sight will reduce the measured Zeeman effect. The high angular resolution of the ngVLA is therefore critical for maximizing Zeeman detectability, while its sensitivity will be necessary to improve detection statistics in weak magnetic environments or for species with low magnetic moments. Robishaw et al. (2015) present a selection of Galactic and extragalactic science that can be addressed by SKA observations of the Zeeman effect. Much of this is applicable to higher frequency science with the ngVLA, for example mapping magnetic fields in galaxies using masers or megamasers to constrain the redshift evolution and dynamics of galactic magnetism. Robishaw et al. (2015) point out that measurements of the Zeeman effect are currently sensitivity limited. The ngVLA can uniquely contribute to this field.
Non-Zeeman circular polarization of molecular rotational spectral lines, with fractional levels of a few percent, can arise from resonant scattering through the conversion of linear to circular polarization (Houde et al., 2013). This effect is proportional to the square of the magnetic field component in the plane of the sky. The effect could be examined in ngVLA data to improve the analysis of Zeeman observations, or exploited for Zeeman-insensitive molecules.
7.3 Synchrotron Continuum
The synchrotron mechanism produces linearly polarized radiation with a theoretical maximum fractional level of approximately 70% in a uniform magnetic field. However, observed fractions at radio wavelengths are often only a few percent due to selection effects such as spectral (bandwidth) and spatial (beam) depolarization, depth depolarization (Faraday dispersion), and the degree to which the magnetic fields in the synchrotron emitting volumes are ordered. Faraday rotation describes the rotation of the plane of linear polarization as linearly polarized radiation passes through a birefringent medium, such as a magnetized thermal gas containing free electrons. The degree of rotation at wavelength is proportional to both and the ‘rotation measure’ (RM). Observations of the position angle of linear polarization at multiple ’s enable measurement of the RM, which in turn is proportional to the path integral of the line of sight magnetic field component weighted by the electron density: RM . If can be measured or modeled along the line of sight, then the magnetic field can be probed.
Faraday rotation studies will feature prominently with the SKA as part of the cosmic magnetism key science driver. The higher frequency coverage of the ngVLA will provide unique parameter space for studies of Faraday rotation, with particular relevance for sources with very large rotation measures ( rad m-2) and those exhibiting significant depolarization at lower frequencies. This is important, for example, for studying accretion rates onto nearby supermassive black holes such as Sgr A* (Macquart et al., 2006) and M81* (Brunthaler, Bower & Falcke, 2006). These sources exhibit large rotation measures and are both depolarized at frequencies less than approximately 80 GHz. The ngVLA can facilitate an accretion rate census of similar nearby black holes. For example, an ngVLA with collecting area 5 x VLA could detect a black hole with similar millimeter wavelength properties to Sgr A* out to a distance of 1.5 Mpc in less than 10h, i.e. encompassing a significant fraction of the local group. The high angular resolution and sensitivity of the ngVLA will aid in the observation and interpretation of sub-parsec scale jet launching environments near supermassive black holes, with implications for precession and supermassive black hole binarity. For example, millimeter wavelength polarization position angles for BL Lac appear to match the structural position angle of the jet (Stirling et al., 2003).
More generally, synchrotron polarization studies with the ngVLA at its lowest frequencies will contribute to investigations into the nature of radio emission from radio-quiet AGN and weak radio AGN in normal galaxies (for example, comparing their fractional polarization properties with other source populations Massardi et al., 2013), high rotation measure sources and their environments (Broderick et al., 2007; Martí-Vidal et al., 2015), polarized spectral energy distributions (Homan, 2012; Farnes et al., 2014), high angular resolution observations of rotation measure gradients and helical magnetic fields in jets (Hovatta et al., 2012; Gabuzda, Knuettel & Reardon, 2015), and turbulence in galaxies through depolarization studies.
8 Synergies with other facilities
Here we describe how the ngVLA will complement and contrast with the capabilities of other cutting-edge observatories. As the 21st century is clearly an era of multi-facility use, and multiwavelength studies, it is essential that ngVLA’s discoveries in the area of galaxy evolution complement, but do not duplicate, the range of measurements made by other facilities.
8.1 The Atacama Large Millimeter Array (ALMA)
ALMA’s design is optimized for high frequencies in the millimeter and submillimeter regime; it cannot be rivaled by ngVLA at wavelengths 1mm, in particular due to the contrast of weather at the ALMA site and VLA site. However, ALMA has about half the collecting area of the current VLA, so will be much less sensitive than the ngVLA at mm wavelengths where its wavelength range overlaps. For objects with large angular scales (for example, nearby galaxies and SZ decrements in galaxy clusters), its smaller dishes and compact array will remain valuable. At low frequencies, only ALMA’s Band-3 (84-116 GHz) is currently available on the telescope; however, by the advent of ngVLA, we expect the antennas to be outfitted with Band-1 and Band-2 receivers, allowing observations as low as 30 GHz. For objects near the celestial equator, ALMA baselines could therefore be used to fill in shorter baselines for ngVLA observations of objects with structure on a wide range of angular scales.
Another area where we expect significant synergy between ALMA and the ngVLA takes advantage of their very complementary angular resolutions. The recent ALMA long baseline campaign showed that images can be obtained with baselines out to 15 km at 230 GHz, providing a resolution of 15 mas. This resolution would match the ngVLA at 40 GHz baseline length of 180 km (5VLA). Working together, the two telescopes would thus be sensitive to a wide range of CO transitions (and the underlying dust continuum) at comparable angular resolution, allowing studies of the spatially-resolved molecular gas excitation and resolved star formation law in high redshift galaxies (e.g., Hodge et al., 2012, 2015).
8.2 The Square Kilometre Array (SKA)
The ngVLA will have a point-source sensitivity twice that of SKA phase-1 (SKA-1 MID) in the frequency range where they overlap. The upper frequency being considered for the SKA is between 14 GHz and 24 GHz. Though 24 GHz and below could be useful for detecting CO(1-0) at extremely high-redshift (), it falls short of the frequencies where the impact of the ngVLA CO studies will be most profound, namely, from 25–50 GHz, covering low order CO (and other molecular) transitions over the peak epoch of Cosmic star formation ( to 4).
In terms of brightness temperature sensitivity at 10GHz, a comparison between the ngVLA specifications and Murphy et al. (2015) suggests that at resolution the surface brightness sensitivity in continuum will be similar (RMS in 1hr with a 5GHz bandwidth mK for both SKA-1 MID and the tapered ngVLA beam), but at higher angular resolutions (mas) ngVLA will be about twice as sensitive. Note that these conclusions depend ultimately on the adopted configurations. The strength of SKA for high redshift galaxy studies is thus likely to be in HI and in continuum and polarization studies that require high surface brightness sensitivity at GHz frequencies, complementary to the ngVLA’s focus on molecular gas and higher-frequency thermal radio emission.
8.3 Next Generation Bolometers on Single-Dish (Sub)mm telescopes
Single-dish submillimeter and millimeter telescopes provide a unique data product that submillimeter interferometric datasets cannot provide: they can map large fields of view in multiple bandpasses swiftly and simultaneously. The Herschel Space Observatory has contributed significantly to the last five years developments in large field of view mapping, but is limited in scope due to its wavelength range (the SPIRE instrument operated at 250–500m), and is particularly insensitive to the Universe. The SCUBA-2 instrument in operation at the JCMT simultaneously maps at 450m and 850m, and is currently surveying large areas, up to 4 deg2 to the 850m confusion limit (0.5 mJy/beam). These deep surveys, and those at longer wavelengths to be done by bolometer arrays like GISMO-2 at 1.2 mm and 2 mm, are ideal for probing DSFGs in the Universe, and would be ideal candidates for ngVLA spectroscopic follow-up. This is particularly relevant since, historically, redshift confirmation has been most challenging for DSFGs at , requiring direct confirmation through far-infrared/millimeter wavelength emission lines. The next generation of wide-field submillimeter bolometers will lean on facilities like the ngVLA significantly for quick and efficient redshift follow-up.
8.4 Future infrared astronomy space missions
Two infrared space telescopes have been proposed for launch in the next 1-2 decades. SPICA, a joint project of the Japanese and European Space Agencies, will be a 3-m class cooled telescope, whose focus will be on spectroscopic surveys of distant galaxies. SPICA is currently scheduled for launch in 2025. At the same time, NASA is currently considering a proposal for a Far-Infrared Surveyor telescope, which will be a 5-m class single-dish telescope, also concentrating on spectroscopic surveys. Both SPICA and the Far-Infrared Surveyor will be able to provide many targets for ngVLA follow-up of low order CO lines and dense gas tracers, essential for understanding their underlying gas mass.
8.5 Large optical/IR telescopes (GMT, TMT, and E-ELT)
The ngVLA will have an angular resolution comparable to adaptive-optics corrected images from the GMT, TMT or E-ELT (15-20 mas). This will allow, for example, direct morphological comparisons of the ionized atomic and molecular gas in high redshift galaxies on sub-kpc scales. Moreover, the combination of the ngVLA and these large optical/IR telescopes will also allow dynamical comparisons of these key ISM components, providing detailed insight into the process of galaxy formation as a function of cosmic time. This is particularly crucial for the formation of early, massive galaxies, where star-formation rates would have to have been high, and the dust content proportionally high. By providing a direct route to observing the star-forming molecular gas in high-redshift galaxies, ngVLA observations will be necessary to interpret the complex rest-frame optical and UV emission in the earliest galaxies.
8.6 JWST
JWST will be highly sensitive to emission from starlight in high redshift galaxies up to at least , and by the advent of the ngVLA, JWST deep fields should be available for follow-up with the ngVLA. A corollary of this synergy is that an ngVLA with survey capability (for example, if fitted with phased array feeds) could be used to perform a high frequency survey for CO-emitting galaxies in these fields, some of which may not be visible – even to JWST – if they are sufficiently dusty and/or have very low stellar mass.
9 Summary, Outlook, & Technical Requirements
The ngVLA will be a truly unique facility, primed to reveal many of the more elusive mysteries of galaxy formation and evolution. In this white paper, we have discussed some of the possible focus areas for such a facility to the best of our ability and given the constraints of current knowledge. Weighing the science cases for these focus areas, we identify five Key Science Projects where a ngVLA could have a significant impact on studies of galaxy assembly through cosmic time, and which we summarize here:
-
1.
The cold gas history of the universe
To-date, our knowledge of galaxy assembly at high-z has been based almost entirely on the stars and ionized gas which result from the star formation process. Due to limitations in instrumentation, the cold gas reservoirs that fuel the star formation have largely been ignored. By blindly detecting the low-J CO emission in multiple galaxies at once, a ngVLA would supply this crucial missing piece of the galaxy assembly puzzle. Excellent sensitivity on relatively short baselines (few km or less) could be critical to avoid over-resolution in unbiased searches. -
2.
Galactic dynamics at high-z
Even with hundreds of hours of telescope time on some of the brightest galaxies in the universe, it remains challenging to resolve the cold gas at high-z with the current VLA. The relative importance of mergers and isolated disks in the early dust-enshrouded universe is thus an open question. By easily resolving the cold gas reservoirs in high-z galaxies on scales of a few hundred parsec to 1 kpc, a ngVLA would allow the community to characterize the dynamics of even the dustiest systems at high-z. -
3.
Tracing star formation in early galaxies with dense gas
Studies in the local universe suggest that dense gas may be a more fundamental tracer of star formation than the cold gas typically studied in more distant galaxies. An order of magnitude fainter than CO, such gas is beyond the reach of the VLA for all but a handful of strongly lensed hyper-starbursting galaxies. A ngVLA would facilitate the detection of low-J dense gas tracers at high-z, directly revealing the star-forming gas in galaxies during the peak epoch of star formation and beyond. -
4.
Measuring dust-unbiased star formation with free-free emission
Free-free emission is both relatively unaffected by dust obscuration and directly proportional to the production rate of ionizing photons by young massive stars, making it a promising tracer of star formation at high-z. Unfortunately, its faintness makes it extremely difficult to detect with current instruments, and even when it is detected, it is difficult to quantify contamination by a synchrotron component. A ngVLA would deliver the full radio spectral energy distributions of high-z galaxies, making it possible to isolate the free-free component of the spectrum and thus determine more accurate star formation rates. -
5.
Magnetic fields in galaxies
The role of magnetic fields in star formation and galaxy evolution are still poorly understood. A ngVLA would have the sensitivity, angular resolution, and unique microwave frequency range to produce a detailed observational census of magnetic fields in a wide range of galaxies throughout the Local Supercluster (Laniakea) on scales from supermassive black hole accretion flows up to molecular clouds. Such work would be highly complementary to lower-frequency studies of magnetic fields on typically larger scales with the SKA.
As the ngVLA is still in the initial technical design phase, it is important for us to clearly state the specifications required by these key science projects for the endeavor as a whole to be successful. We summarize those technical remarks here:
-
•
Sensitivity. A minimum of 5 times the collecting area of the current VLA would be necessary for a substantial impact on extragalactic science. This will dramatically improve our ability to transform high- single-source CO(1-0) follow-up to blank-field CO(1-0) detection campaigns, and bring the number of high- CO(1-0) detections from a handful to several thousands. This type of contribution is substantial. The vast majority of the extragalactic community currently focuses on galaxies’ UV, optical and near-infrared emission. This leap in instrumentation capability in the 1 cm regime has the potential to refocus the community’s energy on the often dominant and always critical mechanisms for galaxies’ emission: their dust and gas. We point the reader back to Figure 4 for a simple depiction of the improved sensitivity limits of ngVLA over the current VLA and ALMA (see also NRAO ngVLA Memo No. 5, Carilli et al., Figure 2).
-
•
Antennae Size. With its 25 m antennae, the current VLA has a relatively small field of view. Assuming equal collecting area and smaller antennae (12 m), this could increase the field of view substantially, enabling larger area mosaicked maps at equal cost. The field of view has substantial impact on the number of sources detectable in molecular gas per pointing, from 45 sources in a single 18 hour exposure (with 12 m antennae) down to 10 sources (with 25 m antennae). There is a similar impact on the number of galaxies we will be able to characterize in a large-field mosaic, ranging from 1500 galaxies across (12 m) to 300 (25 m) with a 700 hour investment. We direct the reader to Figure 5 for an illustration of the antennae size on the yield of CO(1-0) emitters at high-redshift, assuming equal collecting area.
-
•
Bandwidth. Wide bandwidth is a very useful component of high- science with the ngVLA. Prior limitations restricted spectral line science of high- sources in the radio in previous generations, as frequencies were often too poorly constrained to waste time on multiple tunings. Both a 3:1 and 5:1 RF bandwidth ratio would change the landscape of spectral-line surveys for high redshift galaxies, where so many of the challenges faced by the community are rooted in simply securing adequate redshifts. We point the reader to Figures 2 and 9 for an illustration of which lines would be simultaneously accessible to wide-bandwidth observations in the 10–50 GHz range. Note that the jump from the current JVLA 2:1 bandwidth ratio to 3:1 is not a substantial change (it is equivalent to being able to detect CO(1-0) in the following redshift ranges: at 2:1 and at 3:1), however a wider bandwidth certainly would help the efficiency of high-redshift molecular gas deep field searches by capturing all relevant lines across a huge chunk of cosmic time.
-
•
Spatial Resolution. The characteristic resolution needed to characterize the kinematics and dynamics in distant galaxies is 0.1′′ and is primarily limited by the sensitivity limits per beam. There is no need for extra long baselines for high-redshift work, with the exception of projects focused on resolving the black hole radius of influence in more distant galaxies, at 30 mas resolution. We highlight Figure 10 as an illustration of resolving dynamics in high-redshift galaxies on 0.1′′ scales, and Figure 8 as the possible future capabilities of ngVLA in detecting detailed sub-structure in intrinsically fainter systems.
-
•
Frequency Coverage. Aside from our continuum emission goals, which would ideally make use of the entire frequency coverage available to the ngVLA (Figure 11), the sweet spot for high-redshift science falls in the 10–50 GHz range, where spectral features (both low-J CO and dense gas tracers) are most prevalent beyond . Again, we draw the reader’s attention to Figures 2 and 9 for illustrations.
-
•
Polarization Purity. Low instrumental leakage in both linear and circular polarization is crucial for magnetic field science with the ngVLA. Dust polarimetry, the Goldreich-Kylafis effect, and the Zeeman effect require sensitivity to sub-percent polarized radiation. This, in turn, requires stable on-axis polarization with leakage terms small enough to enable beam-center calibration to 0.1% in Stokes Q, U, and V. Calibration residuals no worse than about 0.5% at the primary beam half power radius are required to enable polarization mapping of extended sources, which is of particular importance for dust polarimetry.
The next few decades of technological development for astronomical instrumentation will certainly lead to baffling discoveries, many of which will be difficult or impossible to predict. The next generation VLA will be an essential tool towards this end, fulfilling a unique niche untapped by any other radio facility at 10s of GHz.
References
- Aalto et al. (2007) Aalto, S. et al. 2007, A&A, 464, 193.
- Adam et al. (2015) Adam, R. et al. 2015, A&A, 576, A12.
- Afonso et al. (2014) Afonso, J. et al. 2014, ArXiv e-prints.
- Aitken et al. (2002) Aitken, D. K. et al. 2002, MNRAS, 329, 647.
- Alatalo et al. (2011) Alatalo, K. et al. 2011, ApJ, 735, 88.
- Aravena et al. (2010) Aravena, M. et al. 2010, ApJ, 718, 177.
- Barger et al. (2012) Barger, A. J. et al. 2012, ApJ, 761, 89.
- Beck (2007) Beck, R. 2007, A&A, 470, 539.
- Beck (2015) Beck, R. 2015, in Astrophysics and Space Science Library, ed. A. Lazarian, E. M. de Gouveia Dal Pino, and C. Melioli, volume 407 of Astrophysics and Space Science Library, 3.
- Bolatto, Wolfire & Leroy (2013) Bolatto, A. D., Wolfire, M., and Leroy, A. K. 2013, ARA&A, 51, 207.
- Bothwell et al. (2010) Bothwell, M. S. et al. 2010, MNRAS, 405, 219.
- Bothwell et al. (2013) Bothwell, M. S. et al. 2013, MNRAS, 429, 3047.
- Bouwens et al. (2009) Bouwens, R. J. et al. 2009, ApJ, 705, 936.
- Broderick et al. (2007) Broderick, J. W. et al. 2007, MNRAS, 381, 341.
- Brunthaler, Bower & Falcke (2006) Brunthaler, A., Bower, G. C., and Falcke, H. 2006, A&A, 451, 845.
- Capak et al. (2015) Capak, P. L. et al. 2015, Nature, 522, 455.
- (17) Carilli, C. et al., Next Generation VLA Memo. No. 5: Project Overview http://library.nrao.edu/ngvla.shtml.
- Carilli (2001) Carilli, C. L. 2001, in Starburst Galaxies: Near and Far, ed. L. Tacconi and D. Lutz, 309.
- Carilli et al. (2005) Carilli, C. L. et al. 2005, ApJ, 618, 586.
- Carilli & Walter (2013) Carilli, C. L. and Walter, F. 2013, ARA&A, 51, 105.
- Casey (2012) Casey, C. M. 2012, MNRAS, 425, 3094.
- Casey et al. (2012) Casey, C. M. et al. 2012, ApJ, 761, 140.
- Casey et al. (2011) Casey, C. M. et al. 2011, MNRAS, 415, 2723.
- Casey, Narayanan & Cooray (2014) Casey, C. M., Narayanan, D., and Cooray, A. 2014, Physics Reports, 541, 45.
- Chandrasekhar & Fermi (1953) Chandrasekhar, S. and Fermi, E. 1953, ApJ, 118, 116.
- Chapman et al. (2005) Chapman, S. C. et al. 2005, ApJ, 622, 772.
- Chatterjee et al. (2008) Chatterjee, S. et al. 2008, MNRAS, 390, 535.
- Condon (1992) Condon, J. J. 1992, ARA&A, 30, 575.
- Cowie & Songaila (1986) Cowie, L. L. and Songaila, A. 1986, ARA&A, 24, 499.
- da Cunha et al. (2013) da Cunha, E. et al. 2013a, ApJ, 766, 13.
- da Cunha et al. (2013) da Cunha, E. et al. 2013b, ApJ, 765, 9.
- Daddi et al. (2008) Daddi, E. et al. 2008, ApJL, 673, L21.
- Danielson et al. (2011) Danielson, A. L. R. et al. 2011, MNRAS, 410, 1687.
- Danielson et al. (2015) Danielson, A. L. R. et al. 2015, MNRAS.
- Dannerbauer et al. (2009) Dannerbauer, H. et al. 2009, ApJL, 698, L178.
- Davé et al. (2010) Davé, R. et al. 2010, MNRAS, 404, 1355.
- Dekel et al. (2009) Dekel, A. et al. 2009, Nature, 457, 451.
- Draine et al. (2007) Draine, B. T. et al. 2007, ApJ, 663, 866.
- Draine & Lazarian (1998) Draine, B. T. and Lazarian, A. 1998, ApJL, 494, L19.
- Dunne et al. (2009) Dunne, L. et al. 2009, MNRAS, 394, 1307.
- Emonts et al. (2014) Emonts, B. et al. 2014, MNRAS, 438(4), 2898.
- Emonts et al. (2015) Emonts, B. et al. 2015, MNRAS, 451(1), 1025.
- Falceta-Goncalves, Lazarian & G. (2008) Falceta-Goncalves, D., Lazarian, A., and G., K. 2008, ApJ, 679, 537.
- Farnes et al. (2014) Farnes, J. S. et al. 2014, ApJ, 795, 63.
- Förster Schreiber et al. (2009) Förster Schreiber, N. M. et al. 2009, ApJ, 706, 1364.
- Fu et al. (2015) Fu, H. et al. 2015, ApJ, 799, 72.
- Gabuzda, Knuettel & Reardon (2015) Gabuzda, D. C., Knuettel, S., and Reardon, B. 2015, MNRAS, 450, 2441.
- Gao et al. (2007) Gao, Y. et al. 2007, ApJL, 660, L93.
- Gao & Solomon (2004) Gao, Y. and Solomon, P. M. 2004, ApJ, 606, 271.
- García-Burillo et al. (2012) García-Burillo, S. et al. 2012, A&A, 539, A8.
- Goldreich & Kylafis (1982) Goldreich, P. and Kylafis, N. D. 1982, ApJ, 253, 606.
- Greaves et al. (2000) Greaves, J. S. et al. 2000, Nature, 404, 732.
- Greaves et al. (1999) Greaves, J. S. et al. 1999, A&A, 344, 668.
- Greve et al. (2014) Greve, T. R. et al. 2014, ApJ, 794, 142.
- Hainline et al. (2006) Hainline, L. J. et al. 2006, ApJ, 650, 614.
- Hayward et al. (2012) Hayward, C. C. et al. 2012, MNRAS, 424, 951.
- Hensley, Ostriker & Ciotti (2014) Hensley, B., Ostriker, J. P., and Ciotti, L. 2014, ApJ, 789, 78.
- Hezaveh et al. (2013) Hezaveh, Y. D. et al. 2013, ApJ, 767, 132.
- Hildebrand & Dragovan (1995) Hildebrand, R. H. and Dragovan, M. 1995, ApJ, 450, 663.
- Hodge et al. (2012) Hodge, J. A. et al. 2012, ApJ, 760, 11.
- Hodge et al. (2013) Hodge, J. A. et al. 2013, ApJ, 768, 91.
- Hodge et al. (2015) Hodge, J. A. et al. 2015, ApJL, 798, L18.
- Homan (2012) Homan, D. C. 2012, ApJ, 747, 24.
- Houde (2009) Houde, M. 2009, ApJ, 706, 1504.
- Houde et al. (2013) Houde, M. et al. 2013, ApJ, 764, 24.
- Houde et al. (2005) Houde, M. et al. 2005, in Astronomical Polarimetry: Current Status and Future Directions, ed. A. Adamson, C. Aspin, C. Davis, and T. Fujiyoshi, volume 343 of Astronomical Society of the Pacific Conference Series, 154.
- Hovatta et al. (2012) Hovatta, T. et al. 2012, AJ, 144, 105.
- Issa, MacLaren & Wolfendale (1990) Issa, M. R., MacLaren, I., and Wolfendale, A. W. 1990, A&A, 236, 237.
- Ivison et al. (2011) Ivison, R. J. et al. 2011, MNRAS, 412, 1913.
- Izumi et al. (2015) Izumi, T. et al. 2015, ApJ, 811, 39.
- Karim et al. (2013) Karim, A. et al. 2013, MNRAS, 432, 2.
- Kimball et al. (2011) Kimball, A. E. et al. 2011, ApJL, 739, L29.
- Kimball et al. (2015) Kimball, A. E. et al. 2015, MNRAS, 452, 88.
- Kormendy & Ho (2013) Kormendy, J. and Ho, L. C. 2013, ARA&A, 51, 511.
- Krolik (1999) Krolik, J. H. 1999, Active galactic nuclei : from the central black hole to the galactic environment, ).
- Krumholz & Thompson (2007) Krumholz, M. R. and Thompson, T. A. 2007, ApJ, 669, 289.
- Kylafis (1983) Kylafis, N. D. 1983, ApJ, 267, 137.
- Lazarian (2007) Lazarian, A. 2007, JQSRT, 106, 225.
- Leach et al. (1991) Leach, R. W. et al. 1991, ApJ, 370, 257.
- Li & Henning (2011) Li, H.-B. and Henning, T. 2011, Nature, 479, 499.
- Lisenfeld & Ferrara (1998) Lisenfeld, U. and Ferrara, A. 1998, ApJ, 496, 145.
- Macquart et al. (2006) Macquart, J.-P. et al. 2006, ApJ, 646, 111.
- Magdis et al. (2012) Magdis, G. E. et al. 2012, ApJ, 760, 6.
- Magdis et al. (2011) Magdis, G. E. et al. 2011, A&A, 534, A15.
- Martí-Vidal et al. (2015) Martí-Vidal, I. et al. 2015, Science, 348, 311.
- Martin et al. (2015) Martin, C. L. et al. 2015, ApJ, 803, 6.
- Massardi et al. (2013) Massardi, M. et al. 2013, MNRAS, 436, 2915.
- McBride (2014) McBride, J. D. G. 2014. PhD thesis, University of California, Berkeley.
- Murphy et al. (2015) Murphy, E. et al. 2015a, Advancing Astrophysics with the Square Kilometre Array (AASKA14), 85.
- Murphy (2009) Murphy, E. J. 2009, ApJ, 706, 482.
- Murphy et al. (2015) Murphy, E. J. et al. 2015b, ApJ.
- Narayanan (2015) Narayanan, D. 2015, in IAU Symposium, ed. B. L. Ziegler, F. Combes, H. Dannerbauer, and M. Verdugo, volume 309 of IAU Symposium, 214.
- Narayanan et al. (2008) Narayanan, D. et al. 2008, ApJ, 684, 996.
- Narayanan et al. (2010) Narayanan, D. et al. 2010, MNRAS, 401, 1613.
- Narayanan et al. (2015) Narayanan, D. et al. 2015, Nature, 525, 496.
- Noeske et al. (2007) Noeske, K. G. et al. 2007, ApJL, 660, L43.
- Olsen et al. (2015) Olsen, K. P. et al. 2015, ArXiv e-prints.
- Papadopoulos et al. (2012) Papadopoulos, P. P. et al. 2012, MNRAS, 426, 2601.
- Rabidoux et al. (2014) Rabidoux, K. et al. 2014, ApJ, 780, 19.
- Reissl, Wolf & Seifried (2014) Reissl, S., Wolf, S., and Seifried, D. 2014, A&A, 566, A65.
- Rémy-Ruyer et al. (2014) Rémy-Ruyer, A. et al. 2014, A&A, 563, A31.
- Riechers et al. (2013) Riechers, D. A. et al. 2013, Nature, 496, 329.
- Riechers et al. (2011) Riechers, D. A. et al. 2011, ApJL, 733, L11.
- Riechers et al. (2008) Riechers, D. A. et al. 2008, ApJ, 686, 851.
- Riechers et al. (2007) Riechers, D. A. et al. 2007, ApJL, 671, L13.
- Robishaw et al. (2015) Robishaw, T. et al. 2015, ArXiv e-prints.
- Rowe & Silk (2011) Rowe, B. and Silk, J. 2011, MNRAS, 412, 905.
- Ruan, McQuinn & Anderson (2015) Ruan, J. J., McQuinn, M., and Anderson, S. F. 2015, ApJ, 802, 135.
- Rupke, Veilleux & Sanders (2005) Rupke, D. S., Veilleux, S., and Sanders, D. B. 2005, ApJS, 160, 115.
- Sanders & Mirabel (1996) Sanders, D. B. and Mirabel, I. F. 1996, ARA&A, 34, 749.
- Santini et al. (2014) Santini, P. et al. 2014, A&A, 562, A30.
- Scoville et al. (2014) Scoville, N. et al. 2014, ApJ, 783, 84.
- Simpson et al. (2014) Simpson, J. et al. 2014, ApJ, 788, 125.
- Solomon et al. (2003) Solomon, P. et al. 2003, Nature, 426, 636.
- Solomon & Vanden Bout (2005) Solomon, P. M. and Vanden Bout, P. A. 2005, ARA&A, 43, 677.
- Spilker et al. (2015) Spilker, J. S. et al. 2015, ApJ, 811, 124.
- Stirling et al. (2003) Stirling, A. M. et al. 2003, MNRAS, 341, 405.
- Swinbank et al. (2004) Swinbank, A. M. et al. 2004, ApJ, 617, 64.
- Tacconi et al. (2008) Tacconi, L. J. et al. 2008, ApJ, 680, 246.
- Van Eck et al. (2015) Van Eck, C. et al. 2015, ApJ, 799, 35.
- Vanden Bout, Solomon & Maddalena (2004) Vanden Bout, P. A., Solomon, P. M., and Maddalena, R. J. 2004, ApJL, 614, L97.
- Vasiliev, Antonini & Merritt (2015) Vasiliev, E., Antonini, F., and Merritt, D. 2015, ApJ, 810, 49.
- Walter, Weiss & Scoville (2002) Walter, F., Weiss, A., and Scoville, N. 2002, ApJL, 580, L21.
- Weiß et al. (2013) Weiß, A. et al. 2013a, ApJ, 767, 88.
- Weiß et al. (2013) Weiß, A. et al. 2013b, ApJ, 767, 88.
- Wu et al. (2005) Wu, J. et al. 2005, ApJL, 635, L173.
- Wu et al. (2010) Wu, J. et al. 2010, ApJS, 188, 313.
- Zakamska & Greene (2014) Zakamska, N. L. and Greene, J. E. 2014, MNRAS, 442, 787.
- Zhang et al. (2014) Zhang, C. et al. 2014, Research in Astronomy and Astrophysics, 14, 1221.