∎
22email: thibault.lagache@pasteur.fr
Present address: BioImage Analysis Unit, CNRS UMR 3671, Institut Pasteur, France. 33institutetext: C. Sieben 44institutetext: Department of Biology, Molecular Biophysics, IRI Life Sciences, Humboldt-Universität zu Berlin, Germany 55institutetext: T. Meyer 66institutetext: Institute of Chemistry and Biochemistry, Free University Berlin, Germany 77institutetext: A. Herrmann 88institutetext: Department of Biology, Molecular Biophysics, IRI Life Sciences, Humboldt-Universität zu Berlin, Germany 99institutetext: D. Holcman 1010institutetext: Applied Mathematics and Computational Biology, IBENS, Ecole Normale Supérieure, 46 rue d’Ulm 75005 PARIS, France and Newton Institute,DAMTP Cambridge Cb3 0DS and Mathematical Institute, University of Oxford, Andrew Wiles Building, Woodstock Rd, Oxford OX2 6GG, United Kingdom
1010email: david.holcman@ens.fr
Stochastic model of endosomal escape of Influenza virus
Keywords:
Mathematical Modeling Markov Jump Process WKB approximation Endosomal Acidification Influenzapacs:
87.10.Mn 87.16.Wd 87.16.ad 87.16.afMSC:
92-08 60J75 35Q84 81S22 34E201 Abstract
Influenza viruses enter a cell via endocytosis after binding to the surface. During the endosomal journey, acidification triggers a conformational change of the virus spike protein hemagglutinin (HA) that results in escape of the viral genome from the endosome to the cytoplasm. A quantitative understanding of the processes involved in HA mediated fusion with the endosome is still missing. We develop here a stochastic model to estimate the change of conformation of HAs inside the endosome nanodomain. Using a Markov-jump process to model the arrival of protons to HA binding sites, we compute the kinetics of their accumulation and the mean first time for HAs to be activated. This analysis reveals that HA proton binding sites possess a high chemical barrier, ensuring a stability of the spike protein at sub-acidic pH. Finally, we predict that activating more than adjacent HAs is necessary to prevent a premature fusion.
2 Introduction
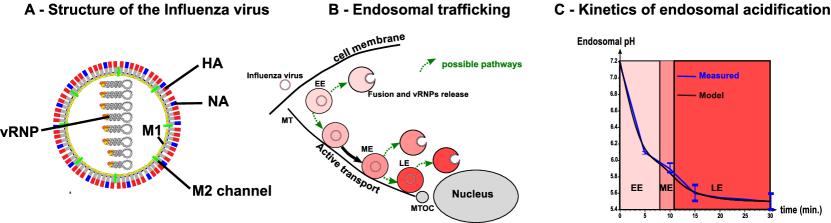
The first step of infection by influenza starts when viral particles enter the cell by a process called endocytosis at the host cell surface, where they are captured in spherical endosome. The second step is the transport of the virus, trapped inside the endosome. During the third and critical step, the viral genome, encoding ribonucleoproteins (vRNPs) has to escape from the endosomal compartment, so that later on, it can translocate into the nucleus Mercer:2010fk (Figure 1-A). Fusion between the endosome and influenza virus is mediated by a low-pH conformational change of the viral envelope glycoprotein hemagglutinin (HA) (figure 1-A). The goal of this article is to present a new model based on endosome acidification and conformational change of the HA to predict the exact timing for initiating fusion between the virus and the endosome membrane, and thus to release the viral genome.
The model accounts for important detailed properties of the glycoprotein HA composed by two linked subunits HA1 and HA2, the latter anchoring HA to the viral envelope. Indeed, at neutral pH, HA is not active (in a non-fusogenic state), but as the pH decreases due to proton entry into the endosome, a partial dissociation of the HA1 subunit results in a spring-loaded conformational change of HA2 into an active (fusogenic) state Huang:2003qf . Consequently, the residence time of influenza virus genome within the endosome before fusion depends on the kinetics of endosome acidification. Yet, the absence of direct in vivo measurements of these parameters makes the endosomal step of virus infection difficult to analyze. To estimate the pH-driven fusion of influenza viruses in an endosome, we develop a model that accounts for the main kinetics parameters of the fusion process.
We start by developing a kinetics model for endosome acidification, that we calibrate using experimental data. The model depends on the following parameters: buffering capacity of the endosomal lumen, membrane leakage and proton pumping rate, all together controlling the number of free protons inside the endosome. Because the proton binding event to HA is discrete, we model it here using a classical Markov jump process Schuss:2010 . Using an asymptotic expansion of the solution for the mean arrival time equation for the number of protons to a certain threshold, we obtain an analytical expression for the kinetics of HA conformational change at fix pH values. The model is then calibrated using the kinetics of the HA conformational change Krumbiegel:1994bh . Finally, by combining the two models for kinetics of endosomal acidification and HA conformational change, we can estimate the number of activated HAs inside an endosome. We predict that at least three adjacent activated HAs are necessary to trigger membrane fusion Danieli:1996ve ; Ivanovic:2013fk , a cooperativity process that should prevent premature fusion. We confirm some of the predictions using co-labeling viruses and endosomal markers experimental data, showing that intracellular fusion of viruses mainly occur in maturing endosomes.
3 Kinetics model of endosomal acidification
The model of endosomal acidification follows the free number of protons at time in the endosomal compartment. The protons enter with an entry rate through the V-ATPase proton pumps ( is the endosomal surface and the rate is associated with to the proton pumps activity) and can escape with a leaking rate , but can also bind to endosomal buffers. The proton pump rate is mainly determined by the membrane potential (Figure 11 Grabe:2000vn ), which in turn depends on the endosomal concentrations of several cations () and (). The ionic concentration inside endosome is tightly regulated by channels, exchangers and leak and in particular, by raising the interior-positive membrane potential, Na-K ATPase exchangers have been proposed to limit the acidification of early compared to late endosomes Fuchs:1989ly .
3.1 Mass action law for free protons
To derive the time-dependent equations for the free protons, we use the balance of fluxes. The fast equilibrium between fluxes determines the effective number of protons entering the endosome which follows the first order kinetics
| (1) |
Protons are rapidly bound to endosomal buffers. We model the buffer activity using an ensemble of chemical reactions Grabe:2001fk :
| (2) |
where are the rate constants . Thus the kinetics equations for the number of free protons inside an endosome is
where and are the number of weak acids and bases inside the endosome at time . We assume that the membrane potential reaches rapidly its steady state value compared to the acidification kinetics Grabe:2000vn , we thus approximate the pumping rate as
| (3) |
where the parameter is related to the membrane potential . In addition, the protons leak is proportional to the endosomal concentration and the endosomal surface Grabe:2001fk
| (4) |
where is a permeability constant, is the Avogadro constant and is the volume of the endosome. Consequently, using approximations 3-4 in equation 3.1, we obtain the general dynamics of free protons:
3.2 Dynamics of the pH and the steady state limit
When the protons enter the endosome, they equilibrate with buffers, a process much faster compared to acidification: after a fraction of protons have entered the endosome, they instantaneously bind to bases, leading to a jump on each base
| (5) |
To estimate the associated pH change with the entry of protons and the infinitesimal changes of the number of bases, we use equation 2) at equilibrium and time :
| (6) |
Thus,
| (7) |
where and are constant. Consequently,
| (8) |
where . By differentiating equation 8 with respect to , the infinitesimal variation of base is related to of the endosomal pH by
| (9) |
Using equation 7, we get for equation 9
| (10) |
leading to
| (11) |
where
| (12) |
is the buffering capacity of the weak acid-base . Finally, using equations 5 and 11 we find that the variation of protons is related to an infinitesimal change of the endosomal pH through
| (13) |
where is the total buffering capacity of the endosome, which is approximately constant Van-Dyke:1994bh .
Finally, using the proton extrusion and pumping rates (equation 3 and 4), we obtain the kinetics equation
| (14) |
With
| (15) |
we obtain that the kinetics equation for free protons accumulation in an endosome is
| (16) |
When the proton leakage is counterbalanced by the pumps, after a time long enough, the pH reaches an asymptotic value , where the endosome cannot be further acidified given by
| (17) |
Consequently, the rate is linked to by
| (18) |
and equation 16 can be rewritten as
| (19) |
To conclude, we obtain here a kinetics equation for the endosome acidification as a function of endosome parameters and permeability. However, equation 19 is not sufficient to account for the different stages of the endosomal maturation. Indeed, the final Mercer:2010fk and the permeability were reported to decrease with the endosomal maturation Fuchs:1989ly and are thus time dependent.
3.3 Modeling pH change and acidification of an endosome
We now relate the acidification dynamics to the change of two proteins that can be followed experimentally. Indeed, the transition from a first stage endosome called early endosome (EE) to a second stage endosome called late endosome (LE) is quantified by a gradual exchange of a protein called Rab5 by another one associated to the late phase called protein Rab7 Rink:2005kl . Kinetics of Rab exchange have been experimentally measured and we approximate here the kinetics of the ratio Rab5/Rab7 obtained from data (Figure 4-C Rink:2005kl ) by a sigmoidal function
| (20) |
where is the half-maturation time and is the time scale of Rab conversion. We then approximate the transition rate from early to late endosome with the Rab conversion rate and we consider that the steady-state pH relative to the amount of Rab7, that gradually replaces Rab5 during endosomal maturation is given by
| (21) |
Similarly, the permeability constant follows the equation
| (22) |
3.4 Calibrating the acidification model by live cell imaging
We shall now calibrate the acidification equation to experimental parameters. First, by fitting equation 20 to the experimental data (Figure4-C of Rink:2005kl ) where the lag time between initiation and termination of the Rab5/Rab7 replacement is estimated to min., leading to a time constant for 100 s.
We use data from endosomal acidification in MDCK cells where the pH inside endosomes decreases very quickly within the first 10-15 min (Figure 1-B) to reach a steady state pH around 5.5 after 20 min, in agreement with previous studies Zaraket:2013aa . The steady state pH is pH and pH for early and late endosomes, respectively Bayer:1998cr , thus we calibrated the permeability constant and Rab conversion kinetics by solving numerically equation 19 and fitting the experimental acidification curve (Figure 1-C). We found that the permeabilities of early and late endosomes are and , respectively and the half-maturation time is min.
3.5 Accounting for proton influx inside viral core and buffering
The last step of the kinetics model of protons include the binding and unbinding with various viral components providing buffer capacity. Indeed, the buffering capacity of the viral proteins and the influx of protons through M2-channels inside the viral core (Figure1-A), the presence of viruses inside endosomes changes the overall buffering capacity of the endosome itself and can perturb the overall acidification kinetics. To compute the influx in each virus through M2 channels, we use first order transport kinetics Leiding:2010uq , summarized by the chemical reaction
| (23) |
When a proton binds a free protein channel with a binding and unbinding rates, it is transported inside the virus core with an inward rate , while the forward rate is . Thus the inward flux in a single virus can be computed from equation 23 Leiding:2010uq
| (24) |
where is the number of M2 channels per viral particle, is the number of free protons inside the viral core and
| (25) |
We extracted the buffer capacity of a virus and accounted for the viral genome, the internal viral proteins and unspecific buffers that can be reached through the M2 channels Leiding:2010uq . Most abundant internal proteins are the M1 ( copies per virus) and the nucleoproteins (NP, copies per virus) LambandKrug (Figure 1-A). Proton binding sites of viral proteins are the ionogenic groups in their amino acid side chains stoyanov , and the main ionogenic buffers in the endosome pH range are the aspartic acid (Asp, pKa=3.9), the glutamic acid (Glu, pKa=4.32) and the histidine (His, pKa=6.04) stoyanov . Closely related binding sites can have strong influence on each other due to electrostatic interactions.
In addition, the 3-dimensional protein folding can hinder the accessibility of some residues to the solvent and protons. Consequently, calculations based on the three-dimensional structure of the protein are necessary to determine accurately its buffering capacity with respect to pH. Using the spatial organization (crystal structure) of NP proteins Ng:2008fk , we computed the pKa values of all titratable residues in the proteins with electrostatic energy calculations using the software Karlsberg+ PROT:PROT21820 . We then determined the mean number of protonated residues of NP proteins (see Material and Methods) and we found that increases almost linearly with pH:
| (26) |
indicating that the buffering capacity of NPs is approximatively constant between pH 7 and 5 (equation 11)
| (27) |
where is the volume of the viral internal lumen, for a spherical viral particle with radius nm Lamb:1983fk . The structure of the matrix M1 protein is unknown and consequently, we use the cumulative contributions of Asp, Glu and His residues to estimate the number of M1 proton binding sites. We thus estimate the fraction of occupied residues for a fixed pH using the equilibrium constant for any residue (Asp, Glu or His) to be
| (28) |
The mean number of protonated site is then given by
| (29) |
where the number of residue for each group is , and . Using equation 29, we plotted as function of the pH and observed that is almost a linear function
| (30) |
and obtain that
| (31) |
Additionally to internal M1s and NPs proteins, protons entering the viral core through M2 channels can also bind to viral nucleic acids and in particular to basic groups in the guanine, adenine and cytosine nucleotides stoyanov . In particular, the buffering capacity of oligonucleotides in solution, for a concentration of monomers, has been estimated to be in the pH range 5-7 (Figure 3-D in stoyanov ). Consequently the buffering capacity of the viral nucleotides Hutchinson:2010ja is approximatively equal to
| (32) |
Finally, the viral core lumen should also contain other unspecific buffers such as cytoplasmic buffers enclosed during the viral assembly, leading to an unspecific buffering capacity inside the viral lumen that has to be added to the buffering capacities and of internal proteins. Due to possible ionic exchange between viral and endosomal lumens, we approximate with the endosomal buffering capacity , which is independent of the pH and has been estimated to be Van-Dyke:1994bh
| (33) |
In summary, the proton buffering capacity inside viral cores is equal to
| (34) |
and similarly to the flux equation 19, the number of free protons contained in viral core at time , which determines the influx of protons through M2 channels (equation 24), follows the kinetics equation
| (35) |
By solving numerically equation 35, we estimate that protons enter the viral core during endosomal maturation. Using endosomal acidification kinetics equation 19, we estimate that more than protons bind to endosomal buffers during endosome acidification. Thus, the buffering capacity of a single virus should not influence the endosomal acidification. However the number of protons that bind to endosomal buffers drastically decreases with the endosomal size (e.g. for nm instead of nm). In addition viral particles may accumulate during the endosomal journey Matlin:1982fk . Thus, for multiplicity of infection (MOI) and viral accumulation in endosomes, the viral buffering capacity may significantly affect the acidification kinetics of small and intermediate size endosomes.
4 Markov jump model of HA conformational change
Although the number of protons entering in the endosome is quite huge, as discussed in the previous section, the actual number of free protons defining endosomal pH is low ( at pH 6 in an endosome with a radius of nm). In addition, there are few proton binding sites on a single HA that trigger its conformational change Huang:2002dq , which is the event we shall monitor. This change of scale between many entering protons and the few free protons and HA binding sites requires a different description than the previous continuous model. To compute the mean time for HA conformation to change as the pH drop, we shall first extract the forward and backward proton binding rates. For that purpose, we convert the HA conformational change kinetics, obtained from experimental data at various pH Krumbiegel:1994bh into rate constants.
At temperature , when the pH decreases from to , the number of bound protons bound to HA1 increases approximatively from to (Figure 3 in Huang:2002dq ), suggesting that the number of available number of binding site is at acidic pH. The influenza virus carries HA trimers Ivanovic:2013fk (Figure 2-A) and thus there are exactly sites that can competitively bind protons. The goal of this section is to compute the mean time that a threshold of bound protons to HA1 is reached, which is a model of fusogenic state, where the protein can engage into the generation of a fusion pore with the endosomal membrane.
4.1 Modeling HA conformational change
To analyse the conformational changes of a single HA trimer, we follow the occupied sites at time , for a fix proton concentration . During time and , the number of specific bound sites can either increase with a probability , when a proton arrives to a free site or decreases with probability when a proton unbinds or remains unchanged with probability (Figure 2-A).
We estimate hereafter the rates and and the critical threshold . The forward rate depends on the proton concentration and the number of free sites of the HA trimer, thus
| (36) |
where is the forward binding rate of a proton to a binding site.
To determine the proton unbinding rate , we use the values available for the HA1 protonation Huang:2002dq . We approximate the number of bound protons with respect to the proton concentration by a linear function (Figure3 Huang:2002dq )
| (37) |
where is the mean number of bound protons at pH=7 and
| (38) |
is the mean number of HA1 sites that are additionally protonated for a proton concentration mol. L-1. Because the unbinding rate does not depend on the proton concentration and we obtain for the equilibrium ratio . Using at equilibrium the concentration for which , the mass-action law leads to or equivalently . Finally, we get
| (39) |
In summary, the binding and unbinding rates and are given by
| (40) |
4.2 Rate of HA conformational change
To compute the mean time that exactly protons are bound to a single HA we use a Markov jump process description. The Master equation is derived by evaluating during time and , the variation in the number of bound sites among the HA1 proton binding sites. The scaled variable is
| (41) |
where and using the difference , the transition probabilities are
At a fixed proton concentration, the probability that the number of protonated sites is equal to at time , that is ), when there are initially bound sites (), is solution of the backward-Kolmogorov equation Matkowsky:1984 ; KNESSL:1984ij ; KNESSL:1985bs ; Schuss:2010 ; Lagache:2012vn
| (42) | |||||
which has the classical Kramers-Moyal expansion risken
| (43) | |||||
The mean first time that the process reaches the threshold models the HA1 subunit filled with protons. It is precisely the mean of the first passage time for the bound protons to reach the level . The mean first passage time , satisfies Schuss:2010 :
| (44) |
with the boundary conditions
| (45) |
For , a Wentzel-Kramers-Brillouin (WKB) W ; K ; B asymptotic expansion of the solution is known KNESSL:1985bs ; Matkowsky:1984 ; KNESSL:1984ij ; Schuss:2010 ; Lagache:2012vn and can be written as
| (46) |
where is the mean number of HA1 sites that are additionally protonated for a concentration , and the dependency of with respect to the concentration c in the range has been obtained by a fitting procedure (see equation 38)
| (47) |
Finally, by definition,
| (48) |
Now replacing the transition rates and by their expressions 40 in equation 48 allows us to compute the mean first passage time to the threshold. Indeed,
that is
| (49) |
where
| (50) |
leading to
| (51) |
that is,
| (52) |
Using the expressions for the binding and unbinding rates 40, we get
| (53) |
which reduces to with formula 47 to
| (54) |
Finally, with eqs 47-52 and 54, we obtain for the mean conformational change time
| (55) |
Using that and , we finally get the new expression for the conformational change time:
| (56) |
where is defined in 50.
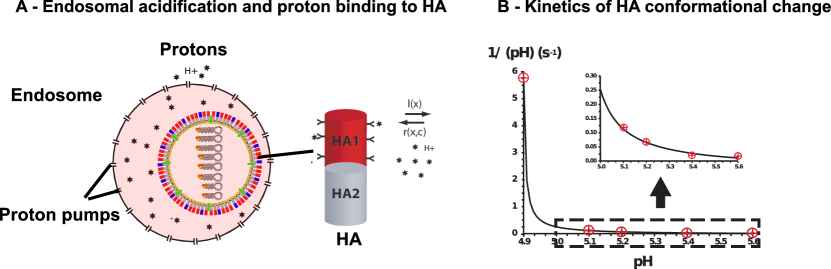
Equation 56 links the affinities between the ligand (concentration ) and the binding sites of a trimer to the conformational change mean time of the trimer. Interestingly, the reciprocal has been measured for various pH values Krumbiegel:1994bh : , ,…, . Using formula 56 and a least square optimization procedure, we have approximated the data (Figure 2-B) and obtain that the critical threshold is
| (57) |
and the forward rate
| (58) |
These two estimations can also been seen as predictions of the present model. We plotted in Figure 2-B the theoretical rate change for HA-conformational with respect to the proton concentration and compared it with the experimental values of Krumbiegel:1994bh . We found a very good agreement (Figure 2-B), validating our jump-Markov model where the cumulative binding of few protons to an activating threshold leads to HA conformational change.
4.3 A high potential barrier of HA binding sites ensures HA stability at neutral pH
We have seen in section that during endosomal acidification, a huge number of protons enter the endosome (more than and bind mostly to endosome buffers, leaving very few free protons (around at pH 6)). To test whether HAs buffer entering protons or interact with the remaining few free protons, we estimate the potential barrier generated at each HA binding site. For this purpose, we compare the reciprocal of the forward rate constant (equation 58), which is the mean time for a proton to bind a HA protein, with the free Brownian diffusion time scale. For a fixed proton concentration at a value , the proton binding time is , while the mean time for a proton to diffuse to the same binding site is WARD:1993uq ; SSH3 ; Schuss:2007fk ; bookdavid
| (59) |
. The number of endosomal protons at concentration is , while is the interacting radius between a proton and a binding site and the diffusion constant of a free proton ( measured in the cytoplasm al-Baldawi:1992ys ). For , we find a small ratio
| (60) |
confirming that the mean time for a proton to bind HA is dominated by a very high activation energy barrier at the HA binding sites, preventing rapid proton binding. Consequently, the buffering capacity of HAs can be neglected compared to the high capacity of other endosomal buffers. In addition, our model predicts that high HA1 potential barrier guarantees that the conformational change is only triggered after a cumulative binding of protons, ensuring a high stability of the protein at pH above 6, as previously characterized in Table 2 of Krumbiegel:1994bh and confirmed in Figure S1.
In summary, we found that the threshold for HA1 conformational change occurs when there are bond proton in a total of binding sites. The binding is characterized by a very high potential barrier. Thus, when protons enter an endosome, they will first be captured by endosomal buffers. The remaining pool of free protons can bind to HA1 sites when they succeed passing the high potential barrier to ultimately trigger HA conformational change.
5 A complete model of virus-endosome fusion
Combining the kinetics model of endosome acidification with the Markov jump model of HA conformational change, we now propose a kinetics model of HAs conformational change inside an endosome. We account for the protons activating a HA1 trigger leading to HA conformational change. We shall estimate the numbers of viral HAs that have bound protons at time , and compute the number of fusogenic (active) , responsible for membrane fusion. From relation 36, the forward rate of a proton to a free HA1 binding site is
| (61) |
and the backward rate is given by relation 40, thus the chemical equations for protons and HA proteins are summarized by
…
| (62) |
where the rate constant depends on each stage as given by relation 61. The stage is irreversible and the kinetic rate equations are
| (63) |
…
| (64) |
Given the proton entry rate (equation 19), these equations can be solved numerically.
5.1 Modeling the onset of fusion between virus and endosome membranes
The onset of membrane fusion is triggered by the conformational change of multiple adjacent trimer in the contact zone between virus and endosome membranes Danieli:1996ve ; Ivanovic:2013fk . However, the number of fusogenic HAs involved in formation and fusion pore enlargement is still an open question.
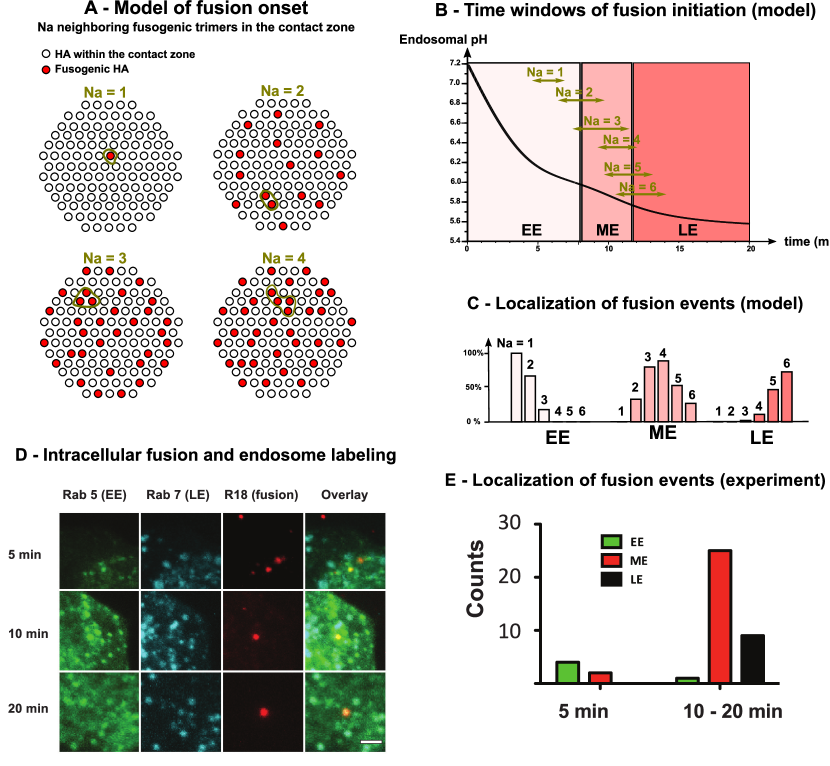
We model the contact zone between the virus and endosome membranes by HAs among the covering the virus Ivanovic:2013fk (Figure3-A). Then, using a numerical solution of equation 64, we chose randomly each new fusogenic HA and defines the onset of virus endosome fusion by the stochastic activation of adjacent HAs in the contact zone (Figure 3-A). Using Monte-Carlo simulations, we estimated the mean and confidence interval at of the fusion onset time for different .
We found that for or , most viruses fuse in EE, whereas for or viruses fuse in ME. Finally, for or , viruses mostly fuse in LE (Figure 3-B,C). The common prediction is that Danieli:1996ve ; Ivanovic:2013fk indicating that viruses shall fuse in ME.
5.2 Probing the intracellular localization of fusion with live cell imaging
To determine the localization of virus fusion, we used the fluorescent endosomal markers Rab5 (EE) and Rab7 (LE) in combination with an intracellular fusion assay to detect virus-endosome fusion so that the localization to a specific compartment can be assigned. Single virus spots were analyzed, where fusion was indicated by a pronounced increase of spot signal (Figure S2). To determine the cellular localization of virus fusion, we analyse infected Rab5- and Rab7-expressing cells with R18-labeled viruses (Figure 3-D). We classified single endosomes based on the presence of the two Rab proteins into three classes (Figure S3). Early endosomes (EE) do not show Rab7 association, such as late endosomes (LE) do not posses Rab5 signal. If endosomes possess both signals, they were counted as maturing endosomes (ME). We observe a gradual increase of Rab7 along with a decrease of Rab5 (Figure 3-D). After 5 min, we rarely observe fusion events in Rab5-only endosomes. The majority of fusion events (61%) are detected in maturing endosomes between 10-20 min post infection (Figure 3-E). At later time points, the localization of fusion events shifted towards late endosomes. However, de-quenching kinetics show that fusion mostly occurs between 10-20 min (Figure S2).
We thus conclude that virus fusion was essentially associated with maturing endosomes indicating that or adjacent fusogenic HA are needed to mediate fusion .
6 Discussion
Influenza viruses are internalized into endosomes via receptor-mediated endocytosis. During their transport along microtubules, the endosomes accumulate protons, which eventually enable virus-endosome fusion mediated by the influenza HA, resulting in release of the viral genome in the cell cytoplasm. Hence, the duration of endosomal transport as well as the localization of fusion critically depend on endosomal acidification and HA conformational change at low pH. Here we presented a a new model to investigate the role of key parameters that shape the endosomal residence time of influenza viruses.
By associating a kinetics model of endosomal acidification with a Markov-jump process model of HA conformational change, we estimated the number of fusogenic HAs as function of time inside endosomes, and we modeled the onset of fusion with the stochastic activation of adjacent HAs. Using the model, we predict the high HA stability at neutral pH due to the high activation barrier of protons binding sites. In association with , this ensures that fusion occurs in ME, preventing a premature fusion in EE. As endosomal maturation is associated with retrograde transport of endosomes along MTs, this should increase the nuclear targeting of viral genome and pathogenicity of the virus.
Acknowledgements.
This research was supported by an Marie Curie grant (D.H.), by the Deutsche Forschungsgemeinschaft (HE 3763/15-1) (A.H.) and the Bundesministerium fur Bildung und Forschung (eBio: ViroSign) (CS and AH). T.L. is funded by a Bourse Roux from Institut Pasteur.References
- (1) al Baldawi, N.F., Abercrombie, R.F.: Cytoplasmic hydrogen ion diffusion coefficient. Biophys J 61(6), 1470–9 (1992). DOI 10.1016/S0006-3495(92)81953-7
- (2) Bayer, N., Schober, D., Prchla, E., Murphy, R.F., Blaas, D., Fuchs, R.: Effect of bafilomycin a1 and nocodazole on endocytic transport in hela cells: implications for viral uncoating and infection. J Virol 72(12), 9645–55 (1998)
- (3) Brillouin, L.: La mécanique ondulatoire de schrodinger: une méthode générale de résolution par approximations successives. Comptes Rendus de l’Academie des Sciences (183)
- (4) Danieli, T., Pelletier, S.L., Henis, Y.I., White, J.M.: Membrane fusion mediated by the influenza virus hemagglutinin requires the concerted action of at least three hemagglutinin trimers. J Cell Biol 133(3), 559–69 (1996)
- (5) Fuchs, R., Schmid, S., Mellman, I.: A possible role for na+,k+-atpase in regulating atp-dependent endosome acidification. Proc Natl Acad Sci U S A 86(2), 539–43 (1989)
- (6) Grabe, M., Oster, G.: Regulation of organelle acidity. J Gen Physiol 117(4), 329–44 (2001)
- (7) Grabe, M., Wang, H., Oster, G.: The mechanochemistry of v-atpase proton pumps. Biophys J 78(6), 2798–813 (2000). DOI 10.1016/S0006-3495(00)76823-8
- (8) Huang, Q., Opitz, R., Knapp, E.W., Herrmann, A.: Protonation and stability of the globular domain of influenza virus hemagglutinin. Biophys J 82(2), 1050–8 (2002). DOI 10.1016/S0006-3495(02)75464-7
- (9) Huang, Q., Sivaramakrishna, R.P., Ludwig, K., Korte, T., Böttcher, C., Herrmann, A.: Early steps of the conformational change of influenza virus hemagglutinin to a fusion active state: stability and energetics of the hemagglutinin. Biochim Biophys Acta 1614(1), 3–13 (2003)
- (10) Hutchinson, E.C., von Kirchbach, J.C., Gog, J.R., Digard, P.: Genome packaging in influenza A virus. The Journal of general virology 91(Pt 2), 313–328 (2010)
- (11) Ivanovic, T., Choi, J.L., Whelan, S.P., van Oijen, A.M., Harrison, S.C.: Influenza-virus membrane fusion by cooperative fold-back of stochastically induced hemagglutinin intermediates. Elife 2, e00,333 (2013). DOI 10.7554/eLife.00333
- (12) Kieseritzky, G., Knapp, E.W.: Optimizing pka computation in proteins with ph adapted conformations. Proteins: Structure, Function, and Bioinformatics 71(3), 1335–1348 (2008). DOI 10.1002/prot.21820. URL http://dx.doi.org/10.1002/prot.21820
- (13) Knessl, C., Mangel, M., Matkowsky, B., Schuss, Z., Tier, C.: Solution of kramers-moyal equations for problems in chemical physics. Journal of Chemical Physics 81(3), 1285–1293 (1984)
- (14) Knessl, C., Matkowsky, B., Schuss, Z., Tier, C.: An asymptotic theory of large deviations for markov jump-processes. Siam Journal On Applied Mathematics 45(6), 1006–1028 (1985)
- (15) Kramers, H.A.: Wellenmechanik und halbzahlige quantisierung. Zeitschrift fur Physik 39 (1926)
- (16) Krumbiegel, M., Herrmann, A., Blumenthal, R.: Kinetics of the low ph-induced conformational changes and fusogenic activity of influenza hemagglutinin. Biophys J 67(6), 2355–60 (1994). DOI 10.1016/S0006-3495(94)80721-0
- (17) Lagache, T., Danos, O., Holcman, D.: Modeling the step of endosomal escape during cell infection by a nonenveloped virus. Biophys J 102(5), 980–9 (2012). DOI 10.1016/j.bpj.2011.12.037
- (18) Lamb, R., Krug, R.: Orthomyxoviridae: The viruses and replication. In: D. Knipe, P. Howley, D. Griffin (eds.) Fields Virology, 4th edn. Lippincott Wiliams and Wilkins (1996)
- (19) Lamb, R.A., Choppin, P.W.: The gene structure and replication of influenza virus. Annu Rev Biochem 52, 467–506 (1983). DOI 10.1146/annurev.bi.52.070183.002343
- (20) Leiding, T., Wang, J., Martinsson, J., DeGrado, W.F., Arsköld, S.P.: Proton and cation transport activity of the m2 proton channel from influenza a virus. Proc Natl Acad Sci U S A 107(35), 15,409–14 (2010). DOI 10.1073/pnas.1009997107
- (21) Matkowsky, B., Schuss, Z., Knessl, C., Tier, C., Mangel, M.: Asymptotic solution of the kramers-moyal equation and first-passage times for markov jump processes. Phys. Rev. A 29, 3359–3369 (1984)
- (22) Matlin, K.S., Reggio, H., Helenius, A., Simons, K.: Pathway of vesicular stomatitis virus entry leading to infection. J Mol Biol 156(3), 609–31 (1982)
- (23) Mercer, J., Schelhaas, M., Helenius, A.: Virus entry by endocytosis. Annu Rev Biochem 79, 803–33 (2010). DOI 10.1146/annurev-biochem-060208-104626
- (24) Ng, A.K.L., Zhang, H., Tan, K., Li, Z., Liu, J.h., Chan, P.K.S., Li, S.M., Chan, W.Y., Au, S.W.N., Joachimiak, A., Walz, T., Wang, J.H., Shaw, P.C.: Structure of the influenza virus a h5n1 nucleoprotein: implications for rna binding, oligomerization, and vaccine design. FASEB J 22(10), 3638–47 (2008). DOI 10.1096/fj.08-112110
- (25) Rink, J., Ghigo, E., Kalaidzidis, Y., Zerial, M.: Rab conversion as a mechanism of progression from early to late endosomes. Cell 122(5), 735–49 (2005). DOI 10.1016/j.cell.2005.06.043
- (26) Risken, H.: The Fokker-Planck Equation: Methods Of Solution And Applications. Springer (1996)
- (27) Schuss, Z.: Theory and Applications of Stochastic Processes. Springer (2010)
- (28) Schuss, Z., Holcman, D.: Stochastic Narrow Escape in Molecular and Cellular Biology: Analysis and Applications. Springer (2015)
- (29) Schuss, Z., Singer, A., Holcman, D.: The narrow escape problem for diffusion in cellular microdomains. Proc Natl Acad Sci U S A 104(41), 16,098–103 (2007). DOI 10.1073/pnas.0706599104
- (30) Singer, A., Schuss, Z., Holcman, D.: Narrow escape, part iii: Non-smooth domains and riemann surfaces. J Stat Phys 122(3), 491–509 (2006)
- (31) Stoyanov, A., Righetti, P.: Buffer properties of biopolymer solutions, as related to their behaviour in electrokinetic methodologies. Journal of Chromatography A 838, 11–18 (1999)
- (32) Van Dyke, R.W., Belcher, J.D.: Acidification of three types of liver endocytic vesicles: similarities and differences. Am J Physiol 266(1 Pt 1), C81–94 (1994)
- (33) Ward, M., Keller, J.: Strong localized perturbations of eigenvalue problems. Siam Journal On Applied Mathematics 53(3), 770–798 (1993)
- (34) Wentzel, G.: Eine verallgemeinerung der quantenbedingungen fur die zwecke der wellenmechanik. Zeitschrift fur Physik 38 (1926)
- (35) Zaraket, H., Bridges, O.A., Duan, S., Baranovich, T., Yoon, S.W., Reed, M.L., Salomon, R., Webby, R.J., Webster, R.G., Russell, C.J.: Increased acid stability of the hemagglutinin protein enhances h5n1 influenza virus growth in the upper respiratory tract but is insufficient for transmission in ferrets. J Virol 87(17), 9911–22 (2013). DOI 10.1128/JVI.01175-13
Figures and tables
| Parameters | Description | Value |
|---|---|---|
| Radius of the endosome | Rink:2005kl | |
| Volume of the endosome | ||
| Radius of the influenza virus | Lamb:1983fk | |
| Volume of the viral internal lumen | ||
| Avogadro constant | ||
| Buffering capacity of the endosomal lumen | Van-Dyke:1994bh | |
| Buffering capacity of the viral lumen | (this study) | |
| Buffering capacity of viral M1s | (this study) | |
| Buffering capacity of viral NPs | (this study) | |
| Buffering capacity of viral RNA | (figure 3-D in stoyanov ) | |
| Permeability constant of early endosomes | (this study) | |
| Permeability constant of late endosomes | (this study) | |
| Steady state pH of early endosomes | Bayer:1998cr | |
| Steady state pH of late endosomes | Bayer:1998cr | |
| Half maturation time of endosomes | (this study) | |
| Rab5/Rab7 mean conversion time | (figure 4-C in Rink:2005kl ) |
| Parameters | Description | Value |
|---|---|---|
| Binding rate | (this study) | |
| Unbinding rate | Huang:2002dq | |
| Critical threshold for the number of HA1 bound sites | (this study) | |
| Binding rate of a proton to a free HA1 binding site | (this study) | |
| Number of HA1 binding sites | Huang:2002dq | |
| Number of HAs | Ivanovic:2013fk |