Stochastic approach to phonon-assisted optical absorption
Abstract
We develop a first-principles theory of phonon-assisted optical absorption in semiconductors and insulators which incorporates the temperature dependence of the electronic structure. We show that the Hall-Bardeen-Blatt theory of indirect optical absorption and the Allen-Heine theory of temperature-dependent band structures can be derived from the present formalism by retaining only one-phonon processes. We demonstrate this method by calculating the optical absorption coefficient of silicon using an importance sampling Monte Carlo scheme, and we obtain temperature-dependent lineshapes and band gaps in good agreement with experiment. The present approach opens the way to predictive calculations of the optical properties of solids at finite temperature.
pacs:
78.40.-q, 71.15.-m, 71.38.-kIn semiconductors and insulators exhibiting indirect band gaps the optical transitions near the fundamental edge require the absorption or emission of phonons in order to fulfill the crystal momentum selection rule. This mechanism is discussed in every introduction to solid state physics Kittel (1976); Ashcroft and Mermin (1976). The theory of phonon-assisted indirect optical transitions was developed by Hall, Bardeen, and Blatt (HBB) Hall et al. (1954); Bassani and Pastori Parravicini (1975), and forms the basis for our current understanding of phonon-assisted optical processes.
Despite the popularity of the HBB theory, only very recently was this formalism combined successfully with first-principles density-functional theory calculations Noffsinger et al. (2012) powered by Wannier interpolation Giustino et al. (2007); Marzari et al. (2012). The work of Ref. Noffsinger et al., 2012 stands as the most sophisticated calculation of indirect optical absorption available today, yet it is not entirely parameter-free since an empirical shift of the absorption onset at each temperature was needed in order achieve agreement with experiment. This correction was unavoidable because the HBB theory does not take into account the temperature dependence of band structures.
A consistent theory of temperature-dependent band structures was developed by Allen and Heine (AH) Allen and Heine (1976); Cardona and Thewalt (2005). In recent years this approach was successfully demonstrated and improved within the framework of first-principles density-functional theory calculations Marini (2008); Giustino et al. (2010); Cannuccia and Marini (2011); Antonius et al. (2014). Given these recent advances it is natural to ask whether the HBB theory of indirect absorption and the AH theory of temperature-dependent band structures could be combined in a more general formalism, in view of fully predictive calculations of phonon-assisted optical processes at finite temperature.
In this manuscript we show that the quasiclassical method introduced by Williams Williams (1951) and Lax Lax (1952) (WL) provides a unified framework for calculating optical absorption spectra of solids, including phonon-assisted absorption and electron-phonon renormalization on the same footing. Indeed we show that the HBB and AH theories can be derived from the WL formalism by neglecting electron-phonon scattering beyond one-phonon processes. In order to demonstrate the power of the WL approach we calculate from first principles the phonon-assisted optical absorption spectrum of silicon at different temperatures using a stochastic importance sampling Monte Carlo method Patrick and Giustino (2013) and no adjustable parameters. Our calculations are in very good agreement with experimental spectra measured at several temperatures. We also calculate temperature-dependent band gaps and find good agreement with experiment.
The premise of the conventional HBB theory is that electrons in solids experience a time-dependent potential which arises from the oscillatory motion of the atoms around their equilibrium positions. Following this premise, indirect electronic transitions are obtained within time-dependent perturbation theory to first order in the atomic displacements Bassani and Pastori Parravicini (1975). This amounts to considering optical transitions whereby the absorption of a photon is accompanied by the emission or absorption of one phonon.
At variance with the HBB point of view, in the WL approach electrons and phonons are described on the same footing, and optical excitations correspond to transitions between Born-Oppenheimer product states of electrons and quantum nuclei Williams (1951); Lax (1952). The quantized final vibrational states are then replaced by a classical continuum, leading to an expression for the optical absorption which only involves the nuclear wavefunction of the initial state Lax (1952). This replacement can be justified using the adiabatic approximation. The temperature dependence is then obtained as a canonical average over the initial states of the system. This theory was successfully employed to explain the optical properties of cold lithium clusters Della Sala et al. (2004) and diamondoids Patrick and Giustino (2013).
The imaginary part of the WL temperature-dependent dielectric function is given by:
| (1) |
where is the photon frequency, the Boltzmann constant, and the temperature. is the canonical partition function among the quantum nuclear states with energies , and stands for the expectation value taken over the -th many-body nuclear wavefunction. denotes the imaginary part of the dielectric function evaluated with the nuclei clamped at the positions specified by the set of normal coordinates , which we indicate collectively as . In order to keep the notation light we label the normal modes of vibration and the electronic states by integer indices; accordingly the following equations will refer to a Born-von Kármán (BvK) supercell of the crystal unit cell. An intuitive interpretation of Eq. (1) is that in the adiabatic approximation the electronic and nuclear timescales are decoupled, and the measured absorption spectrum is described as an ensemble average over instantaneous absorption spectra at fixed nuclear coordinates. In the harmonic approximation Eq. (1) simplifies via Mehler’s formula Watson (1933):
| (2) |
where is a normalized Gaussian of width in the variable . represents the mean square nuclear displacement at the temperature , with the Bose-Einstein occupation factor of the mode with energy at the temperature , and the corresponding zero-point amplitude Patrick and Giustino (2014).
For simplicity we calculate the dielectric function within the independent-particle approximation, although the present formalism is general and can be used with any description of optical transitions at fixed nuclei. In the electric dipole approximation we have Yu and Cardona (2010):
| (3) |
where is the electron mass, the plasma frequency, the number of electrons in the unit cell, and the factor of two is for the spin degeneracy. is the matrix element of the momentum operator along the polarization direction of the photon, taken between the valence and conduction Kohn-Sham states and with energies and , respectively. The superscripts indicate that these states are calculated with the nuclei fixed in the configuration specified by the normal coordinates ; the same quantities evaluated at the equilibrium atomic positions will be denoted without superscripts. Equation (2) was evaluated within density functional theory using importance sampling Monte Carlo integration in a BvK supercell, as described below in the Methods.
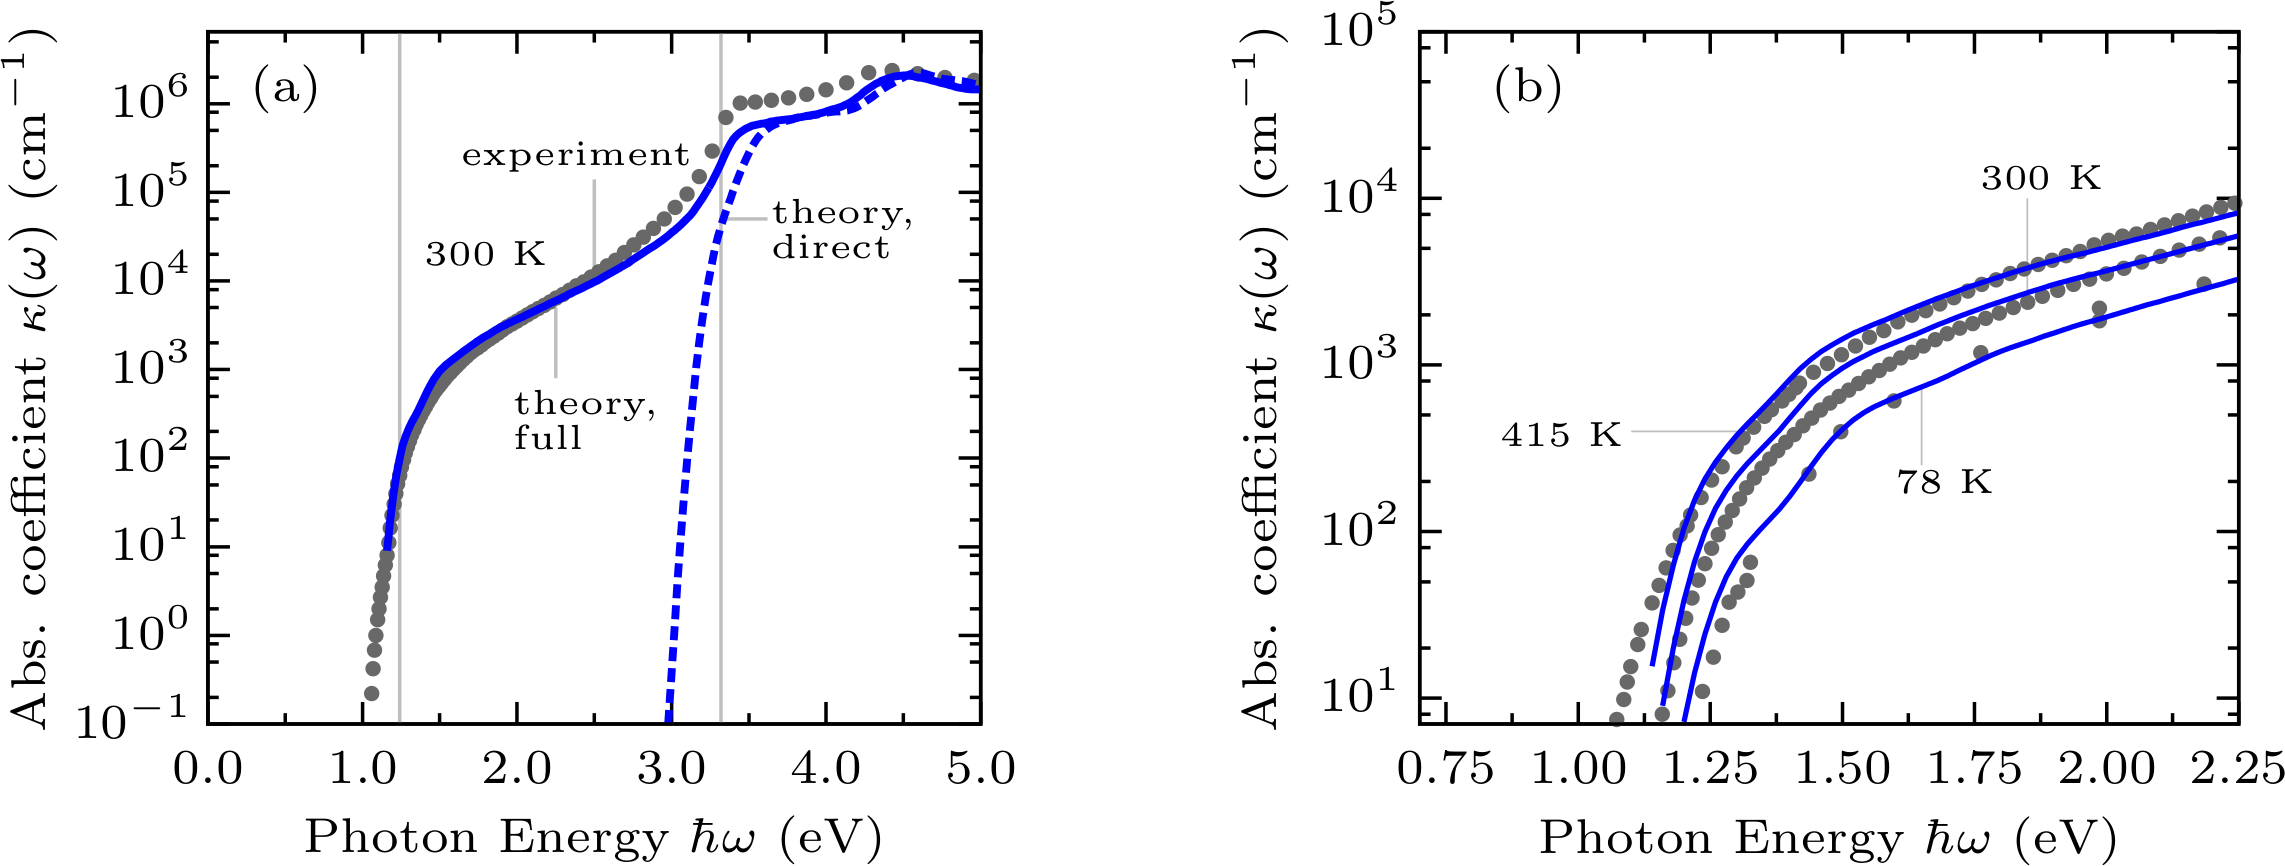
In Fig. 1(a) we compare the optical absorption coefficient of silicon calculated from first principles using Eqs. (2) and (3) with the experimental spectrum, both at 300 K. The absorption coefficient was obtained as where is the speed of light and the refractive index. The spectrum calculated with the nuclei clamped in their equilibrium positions [dashed blue line in Fig. 1(a)] exhibits an onset around 3.3 eV, corresponding to the direct transition in silicon. The sub-gap absorption between 1.1–3.3 eV observed in experiments Green and Keevers (1995) is completely missing in this calculation. At variance with this result, our WL spectrum correctly captures indirect absorption [solid blue line in Fig. 1(a)], and exhibits very good agreement with experiment without any adjustable parameters. Since we are not including excitonic effects, the strength of the transition is underestimated in our calculations, as can be seen at energies around 3.3 eV in Fig. 1(a) Benedict et al. (1998). The agreement between theory and experiment in Fig. 1 remarkably extends over five orders of magnitude.
In order to shed light on the ability of the WL theory to capture indirect optical absorption we express the dependence of the optical matrix elements on the atomic positions using time-independent perturbation theory. To first order in the atomic displacements we have:
| (4) |
where is the electron-phonon matrix element associated with the Kohn-Sham potential , and in the primed summation the terms , are skipped. The spectral range of indirect absorption corresponds to photon energies , with 3.3 eV being the direct band gap of silicon. In this range direct optical transitions are forbidden, therefore from Eq. (4) we have . If we retain only one-phonon processes and neglect the dependence of the electron energies on the nuclear coordinates, Eqs. (2)-(4) yield:
| (5) | |||||
This expression is essentially the same as given by the conventional HBB theory of indirect optical absorption Bassani and Pastori Parravicini (1975), and employed in the first-principles calculations of Ref. Noffsinger et al., 2012. The only difference is that the HBB theory contains phonon energies in the denominators and the Dirac delta functions, corresponding to phonon emission and absorption processes, respectively. In the WL approach these terms are neglected since in the adiabatic approximation . In Figure S1 sup we show that the present result agrees well with the indirect absorption spectrum of silicon calculated using the conventional HBB theory in Ref. Noffsinger et al., 2012.
In Fig. 1(b) we compare our calculated temperature dependence of the indirect optical absorption lineshape of silicon with experiment. We focus on the energy range 1.1–2.3 eV where the effect of excitonic spectral weight transfer on the dielectric function is negligible. Our calculations are in good agreement with experiment. In particular the theoretical spectra capture both the smooth increase of the absorption coefficient with temperature, and the concurrent redshift of the absorption onset. We stress that the observed redshift arises naturally in our calculations, in contrast with the HBB theory where this effect needs to be included empirically Noffsinger et al. (2012). The slight loss of intensity near the indirect edge at the highest temperature [spectrum at 415 K in Fig. 1(b)] results from the incomplete sampling of multi-phonon processes in our stochastic approach.
In order to understand the effect of temperature in the WL approach we note that temperature enters the formalism in two ways: firstly in the Bose-Einstein factors in Eq. (5), as in the conventional HBB theory. This term mainly modifies the absorption intensity. Secondly temperature enters in the electron-phonon renormalization of the electronic band structure, leading to a temperature-dependent shift of the absorption onset. The latter contribution can be analyzed by rewriting the energies inside the Dirac delta functions in Eq. (3) using time-independent perturbation theory. The result accurate to second order in the atomic displacements reads:
| (6) |
where is the Debye-Waller electron-phonon matrix element Allen and Heine (1976); Cardona and Thewalt (2005). If we evaluate the average of in Eq. (6) following the same prescription as for the dielectric function in Eq. (2) we obtain (up to third order in the displacements):
| (7) |
In the first term inside the square brackets we recognize the Fan (or self-energy) electron-phonon renormalization; the second term is the Debye-Waller renormalization Allen and Heine (1976); Cardona and Thewalt (2005); Giustino et al. (2007); Marini (2008); Cannuccia and Marini (2011); Antonius et al. (2014). Both terms can be derived from a diagrammatic analysis by considering only one-phonon processes Marini et al. (2015). Equation (7) represents precisely the AH theory of temperature-dependent band structures, and explains the temperature shift of the indirect absorption lineshapes in Fig. 1(b).
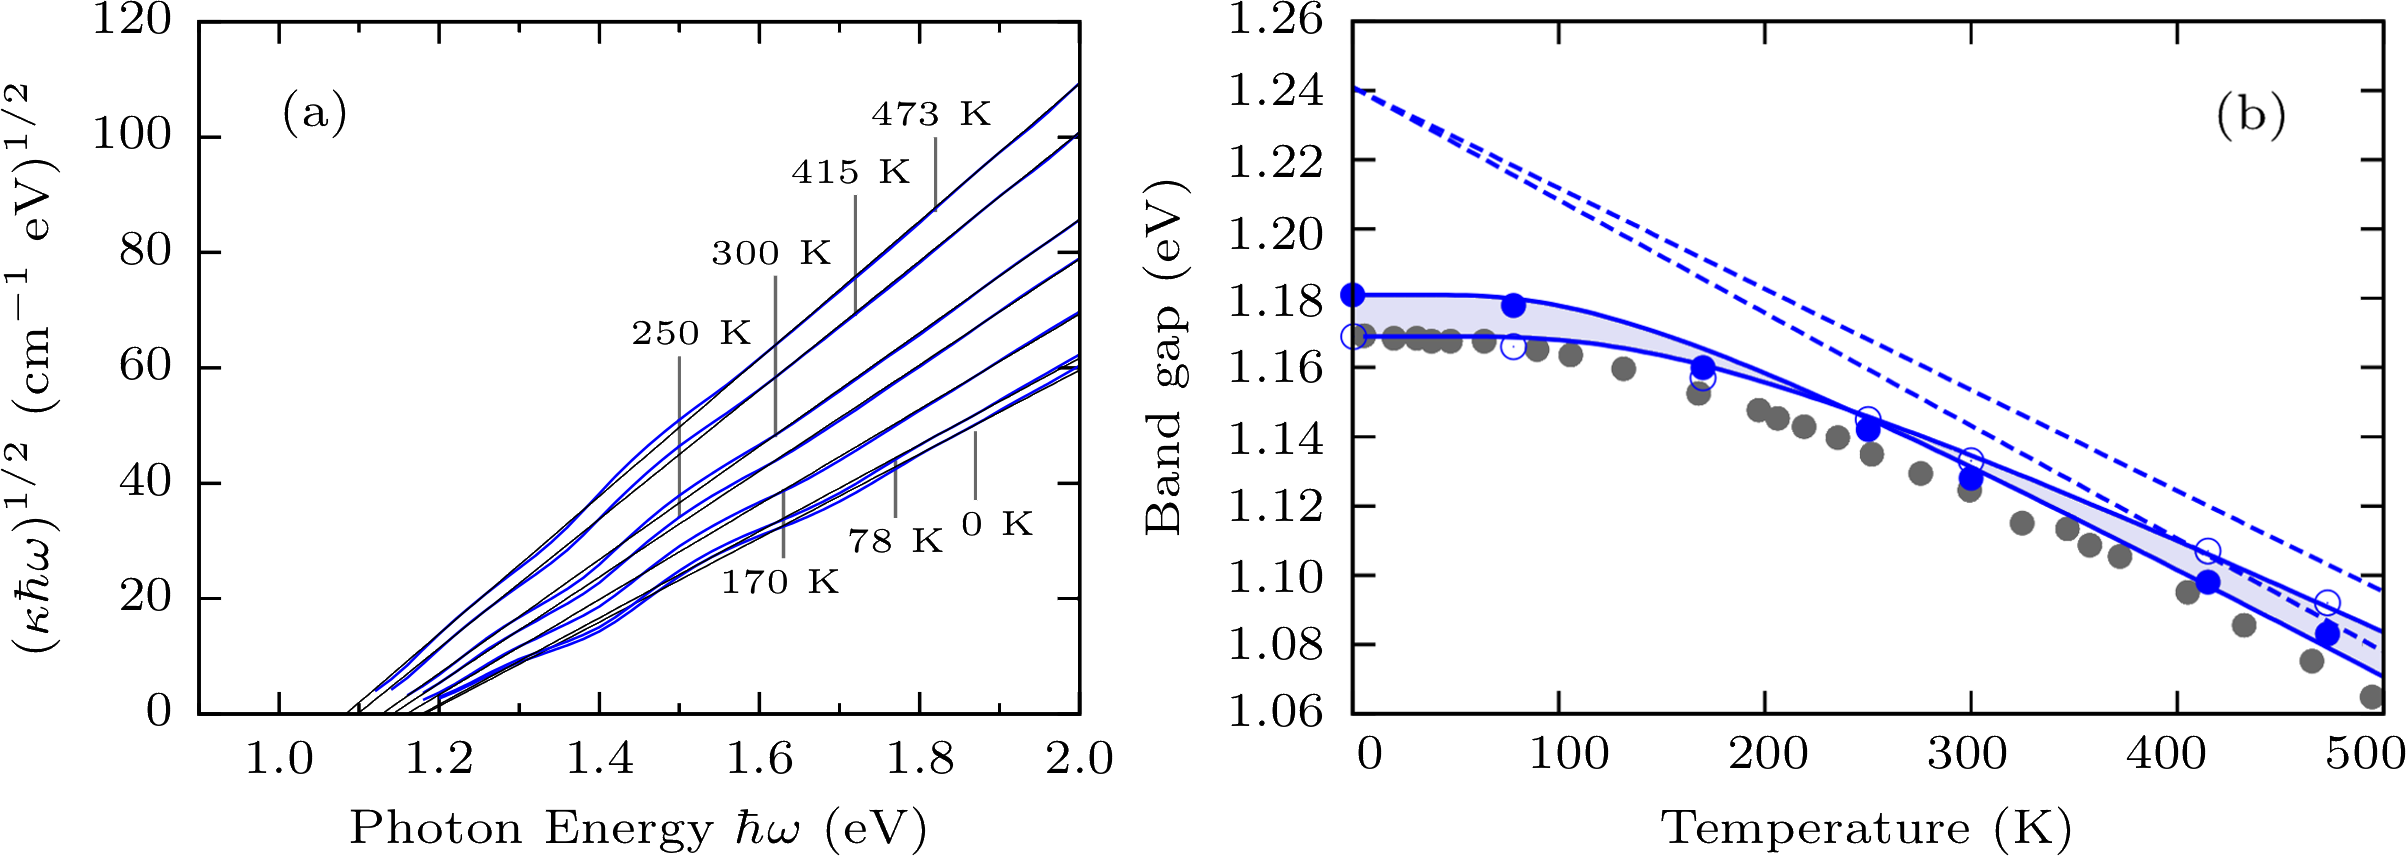
From the calculated optical absorption spectra we can extract the temperature dependence of the indirect and direct band gaps of silicon, following the standard experimental procedure. In fact within the HBB theory the absorption coefficient near the indirect edge goes like Yu and Cardona (2010); Bassani and Pastori Parravicini (1975), therefore the indirect gap is straightforwardly extracted from a linear fit to . As expected Fig. 2(a) shows that our calculated spectra follow a straight line when plotted as . The intercept of this line with the horizontal axis yields the indirect band gaps for each temperature, and the results are shown in Fig. 2(b) for two fitting ranges, 0–1.5 eV and 0–2 eV. Single-oscillator fits to our data using following Ref. Lautenschlager et al., 1987 gave a zero-point renormalization of –72 meV and an effective temperature –494 K for the two ranges considered. These values are in good agreement with the experimental data 62 meV and 395 K, respectively Cardona (2005).
In Figure S3 sup we show that the WL spectrum can also be used to extract the temperature dependence of the direct band gap of silicon using standard lineshape analysis of second-derivative spectra. Also in this case we obtain good agreement with experiment. Overall the agreement between theory and experiment in Fig. 1, Fig. 2, and Figure S3 provides strong support to the validity of the WL theory for first-principles calculations of phonon-assisted optical absorption spectra.
In future work it will be important to test the role of additional correction terms, such as nonadiabaticity Cannuccia and Marini (2011), quasiparticle corrections Antonius et al. (2014), and anharmonicity Errea et al. (2014). While these further refinements will modify the precise values of the zero-point renormalization of the band gap, it is expected that they will not change any of the features of the lineshapes in Fig. 1.
The stochastic approach employed here is remarkably efficient in sampling the vibrational phase space, to the point that the optical spectrum can be calculated using a single configuration of the nuclei (Fig. S4 sup ). This is an unexpected finding and warrants separate investigation. While the present method lacks the elegance of standard density-functional perturbation theory approaches Baroni et al. (2001), it comes with distinctive advantages: (i) the electron-phonon coupling is included to all orders, (ii) the method can be used in conjunction with higher-level theories, such as hybrid functionals Perdew et al. (1996); Heyd et al. (2003) and the GW/Bethe-Salpeter method Onida et al. (2002), and (iii) the anharmonicity of the potential energy surface can be incorporated by using the appropriate nuclear wavefunctions Monserrat et al. (2013).
In conclusion we have demonstrated a new theory of phonon-assisted optical absorption in solids, based on the Williams-Lax quasiclassical approximation. This theory incorporates for the first time the temperature-dependent electron-phonon renormalization of the electronic structure, and enables calculations of optical spectra at finite temperature over a wide spectral range. Our stochastic approach is efficient and easy to implement on top of any electronic structure package. The present work opens the way to systematic calculations of optical spectra of semiconductors and insulators at finite temperature.
Methods The calculations were performed within density functional theory in the local density approximation Ceperley and Alder (1980); Perdew and Zunger (1981), using planewave basis sets and norm-conserving pseudopotentials Fuchs and Scheffler (1999) as implemented in the Quantum ESPRESSO suite Giannozzi et al. (2009). We obtained vibrational frequencies and eigenmodes via the frozen-phonon method Kunc and Martin (1983); Ackland et al. (1997). The optical matrix elements including the non-local components of the pseudopotential Starace (1971) were evaluated using Yambo Marini et al. (2009). Calculations with/without the nonlocal components of the pseudopotential are compared in Figure S1 sup . In order to address the band gap problem we used a scissor correction eV in all calculations, close to the GW value of Ref. Lambert and Giustino, 2013. The non-locality of the scissor operator was taken into account in the oscillator strengths Starace (1971) via the renormalization factors , thereby ensuring that the -sum rule be correctly fulfilled. A comparison between the absorption spectra calculated with or without the scissor correction is shown in Figure S5 sup . We averaged over the atomic configurations using Importance Sampling Monte Carlo integration Patrick and Giustino (2013). The estimator Caflisch (1998) of in Eq. (2) was obtained using configurations generated from a random set of normal coordinates , as determined from the quantile function of the Gaussian distribution, Brown et al. (2013). The values (one for each normal coordinate, ) were generated via Sobol low-discrepancy sequences Joe and Kuo (2008) by skipping the first 100 steps. We found that 5–8 atomic configurations are enough to converge the spectra at high/low temperature, respectively. Figure S4 sup shows that even using a single configuration the spectrum is already converged. The results presented in Figs. 1 and 2 were obtained using a 888 BvK supercell of the silicon unit cell. We sampled the Brillouin zone of the supercell using 30 random points with weights determined by a Voronoi analysis Aurenhammer (1991). Convergence tests with respect to the supercell size and Brillouin zone sampling are shown in Figure S6 sup . In Fig. 2(a) the spectrum was calculated using a Gaussian broadening of 30 meV; in Figure S4(b) sup we show that even when using a broadening of only 1 meV the spectra remain essentially unaltered. Figure S7 sup shows that the variation of the band gap due to the thermal expansion of the lattice Okada and Tokumaru (1984) is smaller than 5 meV up to 500 K, and can be neglected.
The authors wish to thank E. Kioupakis, S. Poncé, A. Marini, M. Côté, and M. Ceriotti for many fruitful discussions. This work was supported by the Leverhulme Trust (Grant RL-2012-001), the European Research Council (EU FP7 / ERC grant no. 239578), and the UK Engineering and Physical Sciences Research Council (Grant No. EP/J009857/1 and DTA support). This work used the ARCHER UK National Supercomputing Service via the AMSEC project, and the Advanced Research Computing facility of the University of Oxford.
References
- Kittel (1976) C. Kittel, Introduction to solid state physics, 5th ed. (Wiley, New York, 1976).
- Ashcroft and Mermin (1976) N. W. Ashcroft and N. D. Mermin, Solid state physics (Harcourt College Publishers, New York, 1976).
- Hall et al. (1954) L. Hall, J. Bardeen, and F. Blatt, Phys. Rev. 95, 559 (1954).
- Bassani and Pastori Parravicini (1975) F. Bassani and G. Pastori Parravicini, Electronic States and Optical Transition in Solids (Pergamon Press, Oxford, 1975).
- Noffsinger et al. (2012) J. Noffsinger, E. Kioupakis, C. G. V. de Walle, S. G. Louie, and M. L. Cohen, Phys. Rev. Lett. 108, 167402 (2012).
- Giustino et al. (2007) F. Giustino, M. L. Cohen, and S. G. Louie, Phys. Rev. B 76, 165108 (2007).
- Marzari et al. (2012) N. Marzari, A. A. Mostofi, J. R. Yates, I. Souza, and D. Vanderbilt, Rev. Mod. Phys. 84, 1419 (2012).
- Allen and Heine (1976) P. B. Allen and V. Heine, J. Phys. C 9, 2305 (1976).
- Cardona and Thewalt (2005) M. Cardona and M. L. W. Thewalt, Rev. Mod. Phys. 77, 1173 (2005).
- Marini (2008) A. Marini, Phys. Rev. Lett. 101, 106405 (2008).
- Giustino et al. (2010) F. Giustino, S. G. Louie, and M. L. Cohen, Phys. Rev. Lett. 105, 265501 (2010).
- Cannuccia and Marini (2011) E. Cannuccia and A. Marini, Phys. Rev. Lett. 107, 255501 (2011).
- Antonius et al. (2014) G. Antonius, S. Poncé, P. Boulanger, M. Côté, and X. Gonze, Phys. Rev. Lett. 112, 215501 (2014).
- Williams (1951) F. E. Williams, Phys. Rev. 82, 281 (1951).
- Lax (1952) M. Lax, J. Chem. Phys. 20, 1752 (1952).
- Patrick and Giustino (2013) C. E. Patrick and F. Giustino, Nat. Commun. 4, 2006 (2013).
- Della Sala et al. (2004) F. Della Sala, R. Rousseau, A. Görling, and D. Marx, Phys. Rev. Lett. 92, 183401 (2004).
- Green and Keevers (1995) M. A. Green and M. J. Keevers, Prog. Photovolt.: Res. Appl. 3, 189 (1995).
- Braunstein et al. (1958) R. Braunstein, M. R. Arnold, and F. Herman, Phys. Rev. 109, 695 (1958).
- Weakliem and Redfield (1979) H. A. Weakliem and D. Redfield, J. Appl. Phys. 50, 1491 (1979).
- Watson (1933) G. N. Watson, J. London Math. Soc. s1-8, 194 (1933).
- Patrick and Giustino (2014) C. E. Patrick and F. Giustino, J. Phys.: Condens. Matter 26, 365503 (2014).
- Yu and Cardona (2010) P. Y. Yu and M. Cardona, Fundamentals of semiconductors, 4th ed. (Springer, Heidelberg, 2010) pp. 200 – 343.
- Benedict et al. (1998) L. X. Benedict, E. L. Shirley, and R. B. Bohn, Phys. Rev. B 57, R9385 (1998).
- (25) See Supplemental Material at [URL] for Supplemental Figures S1–S7, and Supplemental Reference [49].
- Alex et al. (1996) V. Alex, S. Finkbeiner, and J. Weber, J. Appl. Phys. 79, 6943 (1996).
- Marini et al. (2015) A. Marini, S. Poncé, and X. Gonze, Phys. Rev. B 91, 224310 (2015).
- Lautenschlager et al. (1987) P. Lautenschlager, M. Garriga, L. Vina, and M. Cardona, Phys. Rev. B 36, 4821 (1987).
- Cardona (2005) M. Cardona, Solid State Commun. 133, 3 (2005).
- Errea et al. (2014) I. Errea, M. Calandra, and F. Mauri, Phys. Rev. B 89, 064302 (2014).
- Baroni et al. (2001) S. Baroni, S. de Gironcoli, A. Dal Corso, and P. Giannozzi, Rev. Mod. Phys. 73, 515 (2001).
- Perdew et al. (1996) J. P. Perdew, M. Ernzerhof, and K. Burke, J. Chem. Phys. 105, 9982 (1996).
- Heyd et al. (2003) J. Heyd, G. E. Scuseria, and M. Ernzerhof, J. Chem. Phys. 118, 8207 (2003).
- Onida et al. (2002) G. Onida, L. Reining, and A. Rubio, Rev. Mod. Phys. 74, 601 (2002).
- Monserrat et al. (2013) B. Monserrat, N. D. Drummond, and R. J. Needs, Phys. Rev. B 87, 144302 (2013).
- Ceperley and Alder (1980) D. M. Ceperley and B. J. Alder, Phys. Rev. Lett. 45, 566 (1980).
- Perdew and Zunger (1981) J. P. Perdew and A. Zunger, Phys. Rev. B 23, 5048 (1981).
- Fuchs and Scheffler (1999) M. Fuchs and M. Scheffler, Comput. Phys. Commun. 119, 67 (1999).
- Giannozzi et al. (2009) P. Giannozzi et al., J. Phys.: Condens. Matter 21, 395502 (2009).
- Kunc and Martin (1983) K. Kunc and R. M. Martin, in Ab initio calculation of phonon spectra, edited by J. Devreese, V. Van Doren, and P. Van Camp (Plenum, New York, 1983) p. 65.
- Ackland et al. (1997) G. J. Ackland, M. C. Warren, and S. J. Clark, J. Phys.: Condens. Matter 9, 7861 (1997).
- Starace (1971) A. F. Starace, Phys. Rev. A 3, 1242 (1971).
- Marini et al. (2009) A. Marini, C. Hogan, M. Grüning, and D. Varsano, Comput. Phys. Commun. 180, 1392 (2009).
- Lambert and Giustino (2013) H. Lambert and F. Giustino, Phys. Rev. B 88, 075117 (2013).
- Caflisch (1998) R. E. Caflisch, Acta Numer. 7, 1 (1998).
- Brown et al. (2013) S. E. Brown, I. Georgescu, and V. A. Mandelshtam, J. Chem. Phys. 138, 044317 (2013).
- Joe and Kuo (2008) S. Joe and F. Y. Kuo, SIAM J. Sci. Comput. 30, 2635 (2008).
- Aurenhammer (1991) F. Aurenhammer, ACM Comput. Surv. 23, 345 (1991).
- Okada and Tokumaru (1984) Y. Okada and Y. Tokumaru, J. Appl. Phys. 56, 314 (1984).
Supplemental Material for
“Stochastic approach to phonon-assisted optical absorption”
![[Uncaptioned image]](/html/1510.06352/assets/figS1.png)
FIG. S1: (a) Comparison between the optical absorption spectrum of silicon calculated in the present work (blue solid line), the spectrum calculated in Ref. [5] using the HBB theory (red solid line), and the experimental data from Ref. [19] (gray filled discs). All spectra are for K. The contributions to the optical matrix elements arising from the nonlocal components of the pseudopotential were not included in Ref. [5]. For consistency in this figure we calculated spectra without such contributions. (b) and (c) Imaginary part of the dielectric function of silicon calculated in the present work at 78 K, with (blue) or without (gray) including the contributions to the optical matrix elements arising from the nonlocal components of the pseudopotential. We note that the scale in (a) is logarithmic, while in (b) and (c) we use a linear scale for clarity. The inclusion of the nonlocal components of the pseudopotential leads to a modification of the oscillator strength in the order of 10–15%. We note that in Figs. 1 and 2 of the main text the non-local contributions are correctly included. The pseudopotential used for these calculations has the local component in the channel.
![[Uncaptioned image]](/html/1510.06352/assets/figS2.png)
FIG. S2: Dependence of the calculated indirect band gap of silicon on the energy cutoff used in the linear fits of Fig. 2. The fits were performed in the energy range , and the temperature considered in this example is 300 K.
![[Uncaptioned image]](/html/1510.06352/assets/figS3.png)
FIG. S3: (a) Calculated second-derivative spectra of the real part of the dielectric function of silicon at K within the WL formalism. In experiment the direct band gap of silicon is determined by identifying the transition with the first dip in this spectrum [28]. (b) Calculated temperature dependence of the direct gap of silicon within the WL theory (blue filled discs), using the second-derivative method illustrated in panel (a). For comparison the experimental data from Ref. [28] are shown as gray filled discs. A single-oscillator fit (see main text) describes adequately the calculated temperature dependence (thin blue line), and we obtain meV and K, which are compatible with the experimental ranges meV and K [28], respectively. The high-temperature asymptote is shown as a straight blue dashed line. Above 350 K the and transitions merge (both in experiments and in our calculated spectra) and the direct band gap cannot be determined using this procedure.
![[Uncaptioned image]](/html/1510.06352/assets/figS4.png)
FIG. S4: (a) Sensitivity of the calculated imaginary part of the dielectric function of silicon to the number of nuclear configurations used for evaluating the Monte Carlo estimator. The thin blue line and the thick gray line correspond to averages over 6 and 1 random configurations, respectively. (b) Absorption coefficient of silicon calculated using two different Gaussian broadening parameters, 30 meV (blue line) and 1 meV (black line). These calculations are for a 888 BVK supercell and 300 K.
![[Uncaptioned image]](/html/1510.06352/assets/figS5.png)
FIG. S5: Calculated absorption coefficient of bulk silicon at 300 K with (black sold line) and without (blue solid line) the scissor operator. The experimental data are from Ref. [18] (gray filled discs). The thin vertical lines indicate the indirect and direct band gaps (without scissor), with nuclei in their equilibrium positions. It is seen that the scissor yields essentially a rigid blue-shift of the entire spectrum, and does not introduce any artifacts. We can rationalize this observation as follows. The scissor correction modifies the imaginary part of the dielectric function in two ways: firstly by rigidly shifting the transition energies, and secondly by renormalizing the oscillator strengths. This latter aspect is important since the scissor operator is a projection over the unoccupied manifold, and its non-locality needs to be taken into account in order to obtain the correct dipole matrix element, see Ref. [42]. Let us call the dielectric function without scissor , and that with scissor as . Based on the previous considerations, in the independent-particle approximation the imaginary parts are related as follows: . From this expression it is immediate to verify that the dielectric function after scissor correction correctly fulfills the same -sum rule as the original function. Using the above relation we find that the absorption coefficients with/without scissor are related as follows: . In the present case the ratio of the refractive indices with/without scissor is found to be approximately equal to unity in the photon energy range of interest (0.91–1.01 for energies up to 4.5 eV). This reflects the fact that below the direct gap the refractive index is dominated by the real part of the dielectric function, and that there is no sharp structure in below the direct gap. As a result the absorption spectrum in the presence of scissor correction appears simply as a blue-shifted version of the un-modified spectrum, as shown in the figure.
![[Uncaptioned image]](/html/1510.06352/assets/figS6.png)
FIG. S6: (a) Numerical convergence of the calculated absorption coefficient of silicon with respect to the size of the BVK supercell (blue lines), compared with the experimental data from Ref. [18] (gray filled discs). Dotted, dash-dotted, and solid lines refer to 222, 444, and 888 BVK supercells, respectively. Larger supercells are expected to further improve the agreement between our calculations and experiment at a very fine scale. (b) Numerical convergence of the calculated absorption coefficient of silicon with respect to the sampling of the Brillouin zone. Solid blue lines indicate spectra calculated within a 888 BVK supercell using 1 (dotted), 5 (dashed), 30 (solid) random -points.
![[Uncaptioned image]](/html/1510.06352/assets/figS7.png)
FIG. S7: Calculated indirect band gap of silicon at clamped nuclei as a function of temperature. For each temperature we used the experimental lattice parameters from Ref. [49]. The discs show the change in band gap relative to the value at 100 K, and the lines are guides to the eye. As expected the change between 100 K and 500 K is very small ( meV) as compared to the variation due to electron-phonon renormalization [100 meV, Fig. 2(b)].