A New Constraint on the Physical Nature of Damped Lyman Alpha Systems
Abstract
The formation and evolution of galaxies require large reservoirs of cold, neutral gas. The damped Lyman- systems (DLAs), seen in absorption toward distant quasars and gamma-ray bursts, are predicted to be the dominant reservoirs for this gas. Detailed properties of DLAs have been studied extensively for decades with great success. However, their size, fundamental in understanding their nature, has remained elusive, as quasar and gamma-ray-burst sightlines only probe comparatively tiny areas of the foreground DLAs. Here, we introduce a new approach to measure the full extent of DLAs in the sightlines toward extended background sources. We present the discovery of a high-column-density (log (Hi) = 21.1 cm-2) DLA at covering 90–100% of the luminous extent of a line-of-sight background galaxy. Estimates of the size of the background galaxy range from a minimum of a few kpc2, to 100 kpc2, and demonstrate that high-column density neutral gas can span continuous areas 108–1010 times larger than previously explored in quasar or gamma-ray burst sightlines. The DLA presented here is the first from a sample of DLAs in our pilot survey that searches Lyman break and Lyman continuum galaxies at high redshift. The low luminosities, large sizes, and mass contents (106–109 ) implied by this DLA and the early data suggest that DLAs contain the necessary fuel for galaxies, with many systems consistent with relatively massive, low-luminosity primeval galaxies.
Subject headings:
galaxies: evolution — galaxies: high redshift — intergalactic medium — quasars: absorption lines1. Introduction
Damped Ly absorption systems (DLAs) contain the bulk of the neutral hydrogen (Hi) in the Universe and play a dominant role in cosmic star formation (Wolfe et al., 2005; Wolfire et al., 2003). High-resolution spectra of DLAs in bright quasar and gamma-ray burst sightines yield a wealth of information, such as their chemical composition, ionization states, and gas kinematics (e.g., Prochaska et al., 2007). However, these background sources probe areas of 0.01 parsec2 at the DLA redshift and, as a result, the size of DLAs has remained elusive for 40 years. Only by their spatial correlation with a known galaxy population has the average mass of DLAs been constrained (Gawiser et al., 2001; Adelberger et al., 2003; Bouché & Lowenthal, 2004; Cooke et al., 2006). The situation improves dramatically when the background light source has a large spatial extent, such as a galaxy. Extended background sources can distinguish between DLAs that have large or small spatial extents via differences in their observed absorption-line depths and profiles, reflecting their covering fractions and column densities, respectively. In this Letter, we present the detection of a high-redshift DLA as the first result of a new program to determine DLA spatial extents as a population by searching comparatively high signal-to-noise ratio (S/N), low-resolution 2 galaxy spectra. We assume an 70, 0.3, 0.7 cosmology throughout this paper, and all magnitudes are in the AB system (Fukugita et al., 1996).
2. Data
Our program utilizes the publicly available VLT Vimos Deep Survey (VVDS) UltraDeep 111cesam.lam.fr/vvds/vvds_download.php (Le Fèvre et al., 2003, 2013) using the 8.2m Very Large Telescope. To date, we searched for DLAs in 54 2–4 galaxy spectra that meet Lyman continuum galaxy (LCG; Cooke et al., 2014) criteria. The VVDS-UltraDeep consists of deep, 18 hr spectroscopic integrations (1200 s per exposure) that result in S/N 5–20 in the Ly forest region of the galaxy spectra to search for absorption-line systems. VVDS-UltraDeep provides a bluer wavelength coverage (3650–9350 Å) as compared to the parent VVDS survey necessary for 2–4 DLA searches. In addition, we searched for DLAs in 260 2–4 Lyman break galaxy (LBG; Steidel et al., 1995) spectra using LRIS (Oke et al., 1995; Steidel et al., 2004) and DEIMOS (Faber et al., 2003) on the 10m Keck telescopes between 2001 March to 2014 June as primary or secondary science for several programs (hereafter the Keck programs). Details of the observations and the color selection criteria are outlined in previous work (Cooke et al., 2005, 2013).
The Keck programs color select 25.5 (or 25.5) galaxies following the standard Lyman break technique that assumes little to no escaping Lyman continuum (912Å) flux. Galaxies that produce Lyman continuum flux have observed colors inconsistent with Lyman break expectations with respect to their redshifts, but are found within, and outside of, the standard color selection criteria (Cooke et al., 2014). As a result, the Keck programs are only sensitive to galaxies with foreground DLAs having a combined color that remains within the standard LBG selection criteria. In contrast, VVDS-UltraDeep selects 24.75 galaxies solely based on their magnitude (i.e., no color selection). We focus on the VVDS-UltraDeep spectra that exhibit excess -band flux (LCGs), with most galaxies having colors outside of the standard LBG color selection criteria. These spectra are more likely to include lower-redshift line-of-sight systems with detectable emission as compared to LBGs.
We use the five-year stacked images (m 27) of the Canada-France-Hawaii Telescope Legacy Survey (CFHTLS) Deep Fields high-quality images222www.cfht.hawaii.edu/Science/CFHLS/ (seeing FWHM ) for photometric and morphological analysis. The imaging and spectroscopic data were reduced using standard IRAF and IDL procedures and the reduction pipelines of the facilities providing the data.
3. VVDS 910298177
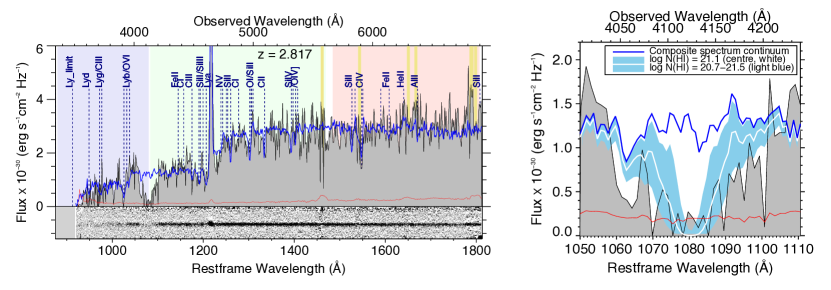
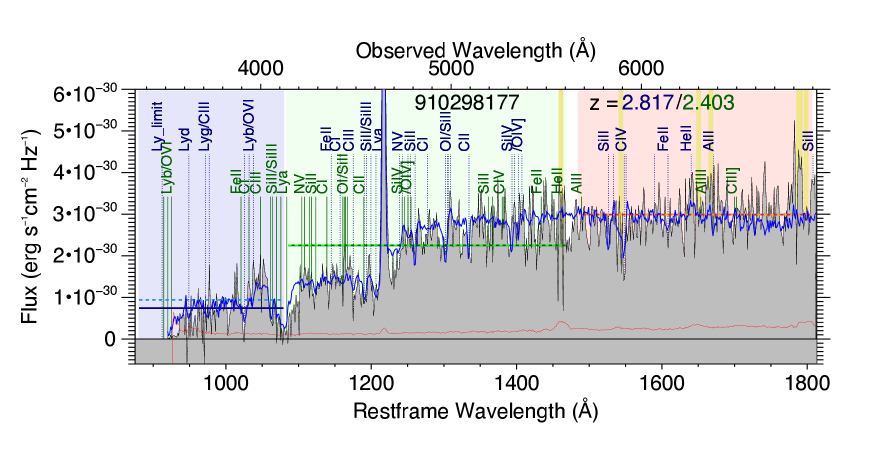
Figure 1 presents the 1D and 2D spectra of the 2.8 galaxy VVDS 910298177 from the VVDS-UltraDeep survey. The spectral profile is typical of LBGs with Ly in emission. As seen in Figure 1, the spectra show a strong absorption feature near 4124Å. We interpret the feature as Hi Ly absorption. Visual inspection of the broad width of the absorption feature, which we refer to as EG1 for convenience, places it in the DLA regime.
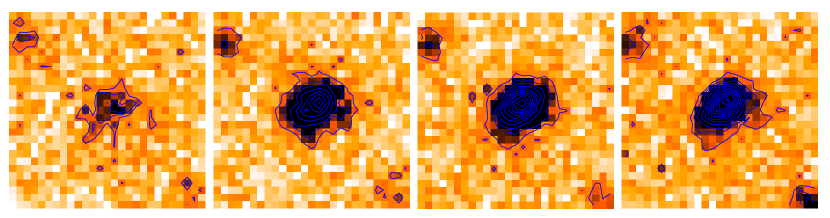
Figure 2 presents CFHTLS image cutouts centered on VVDS 910298177, with its properties listed in Table 1. The contours in Figure 2 suggest a non-point-source, asymmetric morphology that may be the result of either the extended morphology of the background galaxy or a blending of two sources corresponding to the background galaxy and emission from the DLA. In the latter case, the consistency of the image contours suggest that the DLA may reside at a projected separation of 1′′ (8 physical kpc) to the southeast of the flux contour peaks.
3.1. The DLA in the spectrum of VVDS 910298177
We first estimate the Hi content of EG1 by measuring its equivalent width. The feature is centered near = 4124 Å ( = 2.391), and we choose a conservative wavelength window 2500 km s-1 on either side (4088.1–4156.9 Å) so as to avoid contaminating absorption (specifically, the feature near 4055 Å). These parameters result in a Ly rest equivalent width 17.0 Å and a column density of log (Hi) 20.8 cm-2. We stress that this value underestimates the Hi content as the damping wings have been neglected.
Next, we use a Voigt profile model centered at = 2.391 and adopt the flux level of the composite spectrum as an estimate of the continuum level. We find that the feature is well modeled at log N(Hi) 21.1 cm-2. Uncertainties resulting from the S/N, low resolution, contaminating flux and absorption, and continuum level allow for a range of model fits. Thus, we conservatively adopt an Hi content estimate of log (Hi) = 21.1 as illustrated in Figure 1.
We stress that the models and our simulations of the feature require that EG1 have this Hi column density covering 90% of the background galaxy (i.e., a covering factor, 0.9). If EG1 had an equivalent Hi column density but only covered a small region of the background galaxy, the damping wings would not be as pronounced and the core region would deviate significantly from zero (i.e., much shallower than observed) because of the low resolution of the VVDS-UltraDeep spectrum (Schaye, 2001; Heckman et al., 2001).
4. The physical nature of EG1
The size of VVDS 910298177 cannot be determined accurately using seeing-limited ground-based data. However, we can place meaningful constraints on its size as follows. The most physically compact morphology to produce the star-forming luminosity of VVDS 910298177 (M 21) would be that of a highly dense 1 kpc super-star-forming clump. Such a compact background galaxy would probe continuous areas of the DLAs 100,000,000 larger than that probed by quasars and gamma-ray-burst sightlines. Galaxies at 2–3 with luminosities similar to, and fainter than, VVDS 910298177 have average half-light radii of 1–3 kpc and a variety of morphologies – from single compact star-forming regions to extended diffuse emission with multiple star-forming clumps – and include systems with radii of 10 kpc to the surface brightness limits of the deep VVDS-UltraDeep spectroscopy (Förster Schreiber et al., 2009; Elmegreen & Elmegreen, 2005; Law et al., 2012b, a). If VVDS 910298177 is typical of 3 galaxies, the continuous area of EG1 probed would range from a few to 100 kpc2. Previous research using the radio structure of quasars, radio mapping, infrared adaptive optics observations, and quasar close pair sightlines (Briggs et al., 1989; Zwaan et al., 2005; Ellison et al., 2007; Monier et al., 2009; Cooke et al., 2010; Krogager et al., 2012; Jorgenson & Wolfe, 2014) suggests that DLAs span these extents.
Under the simple assumption that the DLA gas resides in a uniform slab, the range of background galaxy sizes (1–100 kpc2) and 1 column densities correspond to neutral gas masses of 106–109 using .
The mass estimate only considers the area probed by the background galaxy flux and, because gas densities in DLA clouds should diminish toward their outer radii, a significant fraction of the gas may extend over larger areas. The mass estimate is consistent with DLA gas associated with 3 DLA dark matter halos from observation (Cooke et al., 2006) and theory (e.g., Fumagalli et al., 2011; Rahmati & Schaye, 2014).
Such large reservoirs of self-shielded neutral gas are protogalaxies, or extended components of established galaxies, and are expected to produce significant star formation as the system evolves. Inspection of the images reveals a subtle elongation in the shape of VVDS 910298177 and, interestingly, faint flux may be present in the 2D spectrum offset from the Ly absorption (below the spectrum as shown in Figure 1) and spatially consistent with the elongation. If real, these features may result from emission by EG1 and imply that it is a faint galaxy.
To test this hypothesis, we conservatively assume that the background galaxy produces zero Lyman continuum flux (which, here, falls in the -band) following the Lyman break expectations (Steidel & Hamilton, 1993; Steidel et al., 2003). We note that some 3 galaxies are theorized, and observed, to exhibit Lyman continuum flux of a few percent as compared to their flux near 1500Å (Steidel et al., 2001; Cooke et al., 2014). A photometric and spectroscopic comparison of VVDS 910298177 finds that the slit spectroscopy acquired 52% of the total galaxy flux in the filters. We apply this correction to the -band and conservatively assign all excess -band flux of the background galaxy to the DLA. This approach yields a DLA brightness of m(1000 Å) 27.1, corresponding to roughly m(1500 Å) = 26.3, a star formation rate of 2 yr-1, and a halo mass 1011 (Berrier & Cooke, 2012). These upper limits are consistent with the offset flux observed in the images, the values found in DLA emission searches in quasar sightlines (Møller et al., 2002; Fynbo et al., 2011; Péroux et al., 2012; Krogager et al., 2012; Jorgenson & Wolfe, 2014; Fumagalli et al., 2015), and the number density of 27 3 galaxies (Schaye, 2001). The above test demonstrates that an interpretation of EG1 as a high-redshift galaxy is plausible (see also §6).
5. The occurrence rate of DLAs in galaxy spectra
As a first step to estimate the occurrence rate of DLAs in galaxy spectra, we assess the frequency of absorbers having similar Hi column densities as EG1 in quasar spectra. The VVDS 910298177 spectrum provides a redshift path 1.96–2.81 to search for DLA Ly absorption, corresponding to a cosmological pathlength of . The DLA incidence frequency is , where the number of DLAs in pathlength is given by . If we adopt the 2.5 Hi column density distribution function of Noterdaeme et al. (2012), we find 0.025 for DLAs in the allowed N(Hi) range of EG1 (log (Hi) = 21.1 0.4 cm-2). Thus, we would have to observe 14 quasars probing redshift range to detect one DLA with the same Hi content. If we restrict ourselves to the range log (Hi) 21.1 0.05 cm-2, the number of quasars needed increases to 150, owing to the steep shape of the Hi column density distribution function. Thus, while uncommon, absorbers like EG1 are not exceedingly rare when observed in quasar spectra. Current simulations indicate that absorbers with sizes and column densities similar to EG1 comprise 1% of the DLA population (Fumagalli et al., 2011; Rahmati & Schaye, 2014).
While the full analysis for our program sample will appear in later papers, we can make initial estimates of the incidence frequency of DLAs in galaxy sightlines. From the 54 secure VVDS-UltraDeep LCG spectra that we assessed, we find two additional DLA candidate systems ((Ly) Å), providing a coarse 6% occurrence rate estimate for systems with log (Hi) 20.3 cm-2 and 2% for systems with log (Hi) 21.1 cm-2. Depending on significance level, we find 6 DLA candidate systems in the lower S/N Keck programs LBG spectra. Under the assumption that these 6 systems are DLAs, their occurrence rates are 3–5 lower than the VVDS-UltraDeep LCGs.
As described in §4, excess Lyman continuum flux in LCGs with DLAs could result from DLA galaxy emission. If the difference in the estimated LCG and LBG occurrence rates persists with larger statistical samples, the results would support the scenario in which DLAs often produce detectable flux and, thus, are associated with star-forming galaxies (Møller et al., 2002; Cooke et al., 2006; Fynbo et al., 2011; Péroux et al., 2012; Krogager et al., 2012; Jorgenson & Wolfe, 2014). DLAs in galaxy sightlines provide opportunities to measure their host galaxy properties without the glare typically present from bright quasars.
6. Galaxies with dominant Ly in absorption and the nature of the neutral gas
Previous work analysing 25.5 LBG spectra (e.g., Shapley et al., 2003; Cooke et al., 2006) find that roughly 25% exhibit dominant Ly in absorption, 25% show dominant Ly in emission, and the remainder exhibit a combination of Ly emission and absorption. Many LBGs with dominant Ly absorption show evidence for damped absorption (Pettini et al., 2000; Shapley et al., 2003). Finally, a population of faint, high-redshift Ly emitting galaxies (LAEs) have been identified via the detection of Ly emission in narrowband imaging surveys (e.g., Hu et al., 1998) and appear to be similar to the 25% of LBGs that show Ly in emission but have bluer UV continuum slopes and lower star formation rates (Gawiser et al., 2006; Cooke, 2009; Cooke et al., 2013; Garel et al., 2015).
Spectra of faint ( 25.5) LBGs with an S/N of more than a few are difficult to obtain with 8 m class telescope in reasonable integration times. The spectra acquired to date show a trend for a larger fraction of galaxies showing Ly in emission. This trend may be an observational bias because very faint galaxy spectra are easier to identify when Ly emission is present. As a result, the identification of r 25 galaxies with dominant Ly in absorption (LAAs) and their properties remain largely unknown. DLAs randomly sample all galaxies with sufficient neutral gas, including very faint and low-mass galaxies. Here, we examine the likelihood that EG1 is an LAA.
To model the VVDS 910298177 spectrum as two galaxies, we first use a composite spectrum constructed from 200 25.5 LBG spectra with dominant Ly in emission to model the background galaxy (hereafter eLBG spectrum). To model EG1, we use a composite spectrum constructed from 200 25.5 LBGs with dominant Ly in absorption (hereafter aLBG spectrum). We place the eLBG spectrum at the redshift of the background galaxy and scale it to the 1500 Å flux of the background galaxy minus the upper limit flux of EG1 ( = 26.3). We then overlay and scale the aLBG spectrum to the redshift and 1500 Å flux of EG1. Finally, we note that EG1 is in the foreground and its damped Ly absorption feature will absorb the background galaxy flux (i.e., not be convolved with it). We scale the template to reflect a 90% absorption to match the lower limit of the data. Figure 3 shows the resulting composite spectrum (eLBG+aLBG) overlaid onto the data.
The Ly feature of the aLBG spectrum is in very good agreement with the Ly feature of EG1 in profile, depth, and width (i.e., EG1 is similar to an LAA) when considered in the proper context. The Ly absorption in the composite aLBG spectrum results largely from absorption foreground to star-forming regions in the LBGs that compose it. In contrast, all the gas in EG1 absorbs the background galaxy, including advancing and receding gas as a result of outflows. The red portion of the aLBG spectrum Ly feature does not include absorption from receding gas nor the circumgalactic material on the far side of EG1 and includes Ly flux from resonantly scattered photons of the LBGs with higher star formation rates that compose it.
Interestingly, VVDS 910298177 exhibits a strong absorption feature blueward of EG1 Ly similar to the Si ii 1193 Å, Si iii 1200, 1207 Å feature in the aLBG spectrum, and there is low S/N evidence for Si ii 1260, 1304, 1527 Å and Si iv 1393, 1403 Å absorption by EG1. If real, this behavior implies a large Si covering fraction for EG1 and similar properties to 25.5 LAAs.
Finally, we test the assumption that DLAs are galaxies like LBGs using their number density. Previous work shows that the number density of DLAs and 3 27 LBGs (i.e., n = 0.016 h3Mpc-3; 1011 ) are consistent if DLAs have average radii of 19 kpc (Schaye, 2001). However, most DLAs are likely fainter than 27, as our sample and unbiased searches indicate (Fumagalli et al., 2015).
If, instead, we assume DLAs have average radii of 5.7 kpc (i.e., average areas of 100 kpc2), they would sample 30 LBGs (M -15.5; 1010.7 ) with an extrapolation of the LBG luminosity function (e.g., Reddy & Steidel, 2009). This speculation is plausible, given the estimated areas of DLAs in our sample and because log (Hi) 20.3 gas likely extends to areas larger than that probed by the background galaxies.
Finally, we note that UV-luminous LBGs do not comprise all galaxies at high redshift, and there is evidence that they may constitute as little as 15–20% (Berrier & Cooke, 2012; Spitler et al., 2014). Because DLAs randomly probe galaxies independent of their UV luminosities, average radii of 5.7 kpc would probe 28 galaxies at 3 in such a scenario, allowing much smaller average DLA radii when probing average galaxies by number.
7. The Future
The discovery of high-redshift DLAs in sightlines to galaxies provides the first means to uncover their true sizes. Our approach of searching LBG and LCG sightlines exploits commonly occurring galaxies, as opposed to rare quasars and gamma ray bursts, while probing continuous areas more than 10 million times larger. Future analysis of our full DLA sample will include background galaxy sizes determined from Cycle 23 Hubble Space Telescope imaging (GO 14160; PI: O’Meara).
The general approach pushes the capabilities of 8 m class telescope
facilities to their limits. However, searches for DLAs in the
sightlines to background galaxies will likely become the dominant
method of study in the upcoming era of 30 m class telescopes. Nominal
first light instruments enable spectroscopy of m 24.5
galaxies at S/N 35 in 4.5 hr (e.g., WFOS on the Thirty Meter
Telescope). The increase in both resolution and S/N would enable more
accurate (Hi) and metallicity measurements. In addition,
lower-resolution spectroscopy ( 1000), enables 5
DLA detection in m 26.5 galaxy spectra in 1 hr. Probing to
fainter galaxies dramatically increases the number density, enabling a
tomographic neutral gas mass reconstruction of the early Universe,
while helping to complete our understanding of galaxy formation and
evolution.
JC thanks Olivier Le Fèvre and Michael Murphy for helpful discussions. JC acknowledges support from Australian Research Council grant FF130101219. JMO thanks the Swinburne Visiting Scientist scheme that helped make this work possible. This research uses data from the VIMOS VLT Deep Survey, obtained from the VVDS database operated by Cesam, Laboratoire d’Astrophysique de Marseille, France. In addition, some of the data presented here are based on observations obtained with MegaPrime/MegaCam, a joint project of CFHT and CEA/IRFU, at the Canada-France-Hawaii Telescope (CFHT) which is operated by the National Research Council (NRC) of Canada, the Institut National des Science de l’Univers of the Centre National de la Recherche Scientifique (CNRS) of France, and the University of Hawaii. This work is based in part on data products produced at Terapix available at the Canadian Astronomy Data Centre as part of the Canada-France-Hawaii Telescope Legacy Survey, a collaborative project of NRC and CNRS. Finally, some of the data presented herein were obtained at the W.M. Keck Observatory, which is operated as a scientific partnership among the California Institute of Technology, the University of California and the National Aeronautics and Space Administration. The Observatory was made possible by the generous financial support of the W.M. Keck Foundation. The authors wish to recognize and acknowledge the very significant cultural role and reverence that the summit of Mauna Kea has always had within the indigenous Hawaiian community. We are most fortunate to have the opportunity to conduct observations from this mountain.
References
- Adelberger et al. (2003) Adelberger, K. L., Steidel, C. C., Shapley, A. E., & Pettini, M. 2003, ApJ, 584, 45
- Berrier & Cooke (2012) Berrier, J. C., & Cooke, J. 2012, MNRAS, 426, 1647
- Bouché & Lowenthal (2004) Bouché, N., & Lowenthal, J. D. 2004, ApJ, 609, 513
- Briggs et al. (1989) Briggs, F. H., Wolfe, A. M., Liszt, H. S., Davis, M. M., & Turner, K. L. 1989, ApJ, 341, 650
- Cooke et al. (2005) Cooke, J., Wolfe, A. M., Prochaska, J. X., & Gawiser, E. 2005, ApJ, 621, 596
- Cooke et al. (2006) Cooke, J., Wolfe, A. M., Gawiser, E., & Prochaska, J. X. 2006, ApJ, 652, 994
- Cooke (2009) Cooke, J. 2009, ApJ, 704, L62
- Cooke et al. (2013) Cooke, J., Omori, Y., & Ryan-Weber, E. V. 2013, MNRAS, 433, 2122
- Cooke et al. (2014) Cooke, J., Ryan-Weber, E. V., Garel, T., & Díaz, C. G. 2014, MNRAS, 441, 837
- Cooke et al. (2010) Cooke, R., Pettini, M., Steidel, C. C., King, L. J., Rudie, G. C., & Rakic, O. 2010, MNRAS, 409, 679
- Ellison et al. (2007) Ellison, S. L., Hennawi, J. F., Martin, C. L., & Sommer-Larsen, J. 2007, MNRAS, 378, 801
- Elmegreen & Elmegreen (2005) Elmegreen, B. G., & Elmegreen, D. M. 2005, ApJ, 627, 632
- Faber et al. (2003) Faber, S. M., et al. 2003, in Society of Photo-Optical Instrumentation Engineers (SPIE) Conference Series, Vol. 4841, Instrument Design and Performance for Optical/Infrared Ground-based Telescopes, ed. M. Iye & A. F. M. Moorwood, 1657–1669
- Förster Schreiber et al. (2009) Förster Schreiber, N. M., et al. 2009, ApJ, 706, 1364
- Fukugita et al. (1996) Fukugita, M., Ichikawa, T., Gunn, J. E., Doi, M., Shimasaku, K., & Schneider, D. P. 1996, AJ, 111, 1748
- Fumagalli et al. (2011) Fumagalli, M., Prochaska, J. X., Kasen, D., Dekel, A., Ceverino, D., & Primack, J. R. 2011, MNRAS, 418, 1796
- Fumagalli et al. (2015) Fumagalli, M., O’Meara, J. M., Prochaska, J. X., Rafelski, M., & Kanekar, N. 2015, MNRAS, 446, 3178
- Fynbo et al. (2011) Fynbo, J. P. U., et al. 2011, MNRAS, 413, 2481
- Garel et al. (2015) Garel, T., Blaizot, J., Guiderdoni, B., Michel-Dansac, L., Hayes, M., & Verhamme, A. 2015, MNRAS, 450, 1279
- Gawiser et al. (2001) Gawiser, E., Wolfe, A. M., Prochaska, J. X., et al. 2001, ApJ, 562, 628
- Gawiser et al. (2006) Gawiser, E., et al. 2006, ApJ, 642, L13
- Heckman et al. (2001) Heckman, T. M., Sembach, K. R., Meurer, G. R., Leitherer, C., Calzetti, D., & Martin, C. L. 2001, ApJ, 558, 56
- Hu et al. (1998) Hu, E. M., Cowie, L. L., & McMahon, R. G. 1998, ApJ, 502, L99
- Jorgenson & Wolfe (2014) Jorgenson, R. A., & Wolfe, A. M. 2014, ApJ, 785, 16
- Krogager et al. (2012) Krogager, J.-K., Fynbo, J. P. U., Møller, P., Ledoux, C., Noterdaeme, P., Christensen, L., Milvang-Jensen, B., & Sparre, M. 2012, MNRAS, 424, L1
- Law et al. (2012a) Law, D. R., Steidel, C. C., Shapley, A. E., Nagy, S. R., Reddy, N. A., & Erb, D. K. 2012a, ApJ, 759, 29
- Law et al. (2012b) —. 2012b, ApJ, 745, 85
- Le Fèvre et al. (2003) Le Fèvre, O., et al. 2003, in Society of Photo-Optical Instrumentation Engineers (SPIE) Conference Series, Vol. 4841, Instrument Design and Performance for Optical/Infrared Ground-based Telescopes, ed. M. Iye & A. F. M. Moorwood, 1670–1681
- Le Fèvre et al. (2013) Le Fèvre, O., et al. 2013, A&A, 559, A14
- Møller et al. (2002) Møller, P., Warren, S. J., Fall, S. M., Fynbo, J. U., & Jakobsen, P. 2002, ApJ, 574, 51
- Monier et al. (2009) Monier, E. M., Turnshek, D. A., & Rao, S. 2009, MNRAS, 397, 943
- Noterdaeme et al. (2012) Noterdaeme, P., et al. 2012, A&A, 547, L1
- Oke et al. (1995) Oke, J. B., Cohen, J. G., Carr, M., Cromer, J., Dingizian, A., Harris, F. H., Labrecque, S., Lucinio, R., Schaal, W., Epps, H., & Miller, J. 1995, PASP, 107, 375
- Péroux et al. (2012) Péroux, C., Bouché, N., Kulkarni, V. P., York, D. G., & Vladilo, G. 2012, MNRAS, 419, 3060
- Pettini et al. (2000) Pettini, M., Steidel, C. C., Adelberger, K. L., Dickinson, M., & Giavalisco, M. 2000, ApJ, 528, 96
- Prochaska et al. (2007) Prochaska, J. X., Chen, H.-W., Dessauges-Zavadsky, M., & Bloom, J. S. 2007, ApJ, 666, 267
- Rahmati & Schaye (2014) Rahmati, A., & Schaye, J. 2014, MNRAS, 438, 529
- Reddy & Steidel (2009) Reddy, N. A., & Steidel, C. C. 2009, ApJ, 692, 778
- Schaye (2001) Schaye, J. 2001, ApJ, 559, L1
- Shapley et al. (2003) Shapley, A. E., Steidel, C. C., Pettini, M., & Adelberger, K. L. 2003, ApJ, 588, 65
- Spitler et al. (2014) Spitler, L. R., et al. 2014, ApJ, 787, L36
- Steidel & Hamilton (1993) Steidel, C. C., & Hamilton, D. 1993, AJ, 105, 2017
- Steidel et al. (1995) Steidel, C. C., Pettini, M., & Hamilton, D. 1995, AJ, 110, 2519
- Steidel et al. (2001) Steidel, C. C., Pettini, M., & Adelberger, K. L. 2001, ApJ, 546, 665
- Steidel et al. (2003) Steidel, C. C., Adelberger, K. L., Shapley, A. E., Pettini, M., Dickinson, M., & Giavalisco, M. 2003, ApJ, 592, 728
- Steidel et al. (2004) Steidel, C. C., Shapley, A. E., Pettini, M., Adelberger, K. L., Erb, D. K., Reddy, N. A., & Hunt, M. P. 2004, ApJ, 604, 534
- Wolfe et al. (2005) Wolfe, A. M., Gawiser, E., & Prochaska, J. X. 2005, ARA&A, 43, 861
- Wolfire et al. (2003) Wolfire, M. G., McKee, C. F., Hollenbach, D., & Tielens, A. G. G. M. 2003, ApJ, 587, 278
- Zwaan et al. (2005) Zwaan, M. A., van der Hulst, J. M., Briggs, F. H., Verheijen, M. A. W., & Ryan-Weber, E. V. 2005, MNRAS, 364, 1467
| VVDS-UltraDeep Name | R.A. (J2000) | Decl. (J2000) | ||||
| h m s | d m s | (AB) | (AB) | (AB) | (AB) | |
| VVDS 910298177 | 02 26 54.699 | -04 18 45.77 |