The SFR Relation and Empirical Star-Formation Histories from ZFOURGE∗∗\ast∗∗\astThis paper includes data gathered with the 6.5 meter Magellan Telescopes located at Las Campanas Observatory, Chile. at
Abstract
We explore star-formation histories (SFHs) of galaxies based on the evolution of the star-formation rate stellar mass relation (SFR). Using data from the FourStar Galaxy Evolution Survey (ZFOURGE) in combination with far-IR imaging from the Spitzer and Herschel observatories we measure the SFR relation at . Similar to recent works we find that the average infrared SEDs of galaxies are roughly consistent with a single infrared template across a broad range of redshifts and stellar masses, with evidence for only weak deviations. We find that the SFR relation is not consistent with a single power-law of the form at any redshift; it has a power-law slope of at low masses, and becomes shallower above a turnover mass (M0) that ranges from , with evidence that M0 increases with redshift. We compare our measurements to results from state-of-the-art cosmological simulations, and find general agreement in the slope of the SFR relation albeit with systematic offsets. We use the evolving SFR sequence to generate SFHs, finding that typical SFRs of individual galaxies rise at early times and decline after reaching a peak. This peak occurs earlier for more massive galaxies. We integrate these SFHs to generate mass-growth histories and compare to the implied mass-growth from the evolution of the stellar mass function. We find that these two estimates are in broad qualitative agreement, but that there is room for improvement at a more detailed level. At early times the SFHs suggest mass-growth rates that are as much as 10 higher than inferred from the stellar mass function. However, at later times the SFHs under-predict the inferred evolution, as is expected in the case of additional growth due to mergers.
1. Introduction
Over the past two decades our understanding of the buildup of stellar matter in the universe has advanced markedly through a wealth of multiwavelength galaxy surveys (for a review see Madau & Dickinson, 2014). However, inferring star formation and mass growth histories of individual galaxies is a non-trivial undertaking, and a variety of methods have been used in the literature. One class of methods involves “archeological” studies of nearby galaxies, either by studying resolved stellar populations or by detailed modeling of high signal-to-noise spectra (e.g. Dolphin et al., 2003; Heavens et al., 2004; Thomas et al., 2005). However degeneracies in age, metallicity, and extinction complicate modeling with these techniques. Furthermore, these techniques become difficult or impossible to apply at appreciable redshifts.
This has provided motivation for lookback studies that utilize observed relations of galaxies at discrete epochs in the universe to infer how individual galaxies evolve. One such type of study is to trace the mass-growth of galaxies selected in bins of constant cumulative co-moving number density (e.g. van Dokkum et al., 2010; Papovich et al., 2011; Patel et al., 2013). This method assumes that the rank-ordering of a population of galaxies by stellar mass does not change as they evolve with time. In reality this rank-ordering will change due to mergers and stochastic variations in star-formation rates, but it is possible to approximately correct for these effects using an evolving number density criterion (Leja et al., 2013; Behroozi et al., 2013).
Another type of lookback study involves using the observed correlation between stellar mass and star-formation rate, hereafter referred to as the SFR relation (e.g. Brinchmann et al., 2004; Noeske et al., 2007; Gilbank et al., 2011; Whitaker et al., 2012; Speagle et al., 2014). By tracing along this evolving star-formation sequence it is possible to predict how galaxies should evolve due to star-formation (e.g. Leitner, 2012; Speagle et al., 2014). In general some disagreement between this approach and the number density selection (NDS) is expected since the former does not include growth due to mergers; indeed, Drory & Alvarez (2008) use this difference to derive the merger rate. Disagreements may also be caused by systematic errors in mass and/or SFR estimates, as emphasized by Weinmann et al. (2012) and Leja et al. (2015).
The most commonly used parameterization for the SFR relation in the literature has been a power-law of the form log() = log() + with and representing the slope and normalization respectively. At low stellar masses ( ) this slope needs to be close to unity in order to maintain the roughly constant low-mass slope in the observed galaxy stellar mass function (SMF). Many early studies, however, typically find a significantly shallower slope (see Table 4 of Speagle et al. (2014)). Furthermore, Leja et al. (2015) argue that the sequence must also flatten at higher masses in order to be consistent with the SMF. Fortunately, recent new measurements of the SFR relation find it to be more consistent with this picture (Whitaker et al., 2014; Lee et al., 2015; Schreiber et al., 2015; Tasca et al., 2015).
Many early works relied on estimating SFRs from rest-frame UV with assumed correction factors to account for extinction from dust. The launch of the Spitzer Space Telescope (Werner et al., 2004) allowed us to directly probe the attenuated UV light of star-forming regions in galaxies emitted in the far-IR for statistically large samples of galaxies at . However, due to technical challenges, data quality in the far-IR were much poorer than in the optical/near-IR. The launch of the Herschel Space Observatory (Pilbratt et al., 2010) expanded observational studies in the far-IR with improved data quality at longer wavelengths. Combinations of Spitzer and Herschel data make it possible to constrain IR SEDs for large enough samples of galaxies to complement modern optical/near-IR galaxy surveys (e.g. Elbaz et al., 2011; Wuyts et al., 2011).
We use the FourStar Galaxy Evolution Survey (ZFOURGE) in concert with deep far-IR imaging from Spitzer and Herschel to make new measurements of the SFR relation and use this to perform an analysis of the two types of lookback studies previously mentioned. The longer wavelength data from Spitzer and Herschel allow for robust SFR measurements (e.g. Kennicutt, 1998; Chary & Elbaz, 2001; Papovich et al., 2007; Elbaz et al., 2011). Combining this with accurate photometric redshifts and deep stellar mass functions provided by ZFOURGE leads to improved constraints on the evolution of the SFR relation and galaxy growth histories. Throughout this paper we use a Chabrier (2003) IMF and CDM cosmological parameters of , and . The symbol will be used in reference to star-formation rates with subscripts to indicate how they were calculated.
2. Data and Methods
2.1. ZFOURGE
The FourStar Galaxy Evolution Survey (ZFOURGE111http://zfourge.tamu.edu: Straatman et al. submitted) is a deep near-IR survey conducted with the FourStar imager (Persson et al., 2013) covering one 11′11′ pointing in each of the three legacy fields CDF-S (Giacconi et al., 2002), COSMOS (Capak et al., 2007) and UDS (Lawrence et al., 2007) reaching depths of 26 mag in , , , and 25 mag in , , and (5 in apertures). The medium-bandwidth filters utilized by this survey offer spectral resolutions , roughly twice that of their broadband counterparts. This increase provides for finer sampling of the Balmer/4000Å spectral break at , leading to well-constrained photometric redshifts. In combination with ancillary imaging, the full photometric dataset covers the observed 0.38m wavelength range.
2.2. Redshifts and Stellar Masses
Photometric redshifts and rest-frame colors were measured using the public SED-fitting code EAZY (Brammer et al., 2008) on PSF-matched optical-NIR photometry. EAZY utilizes a default set of six spectral templates that include prescriptions for emission lines derived from the PEGASE models (Fioc & Rocca-Volmerange, 1997) plus an additional dust-reddened template derived from the Maraston (2005) models. Linear combinations of these templates are fit to the m photometry for each galaxy to estimate redshifts.
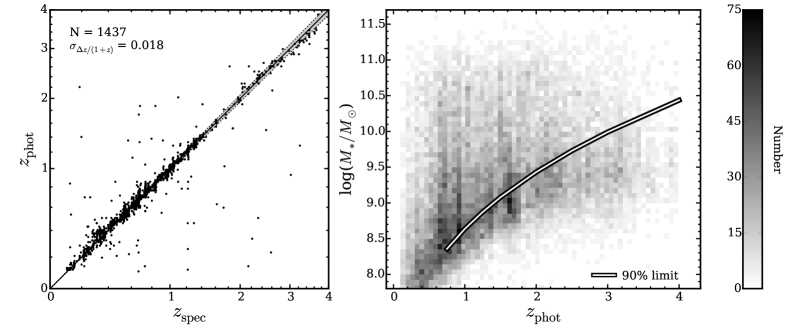
A comparison of our derived photometric redshifts to a sample of 1437 galaxies with secure spectroscopic redshifts is shown in Figure 1. We calculate a scatter of at and fraction of catastrophic outliers () of . At these rise to and respectively. An additional analysis of accuracy can be found in Section 2 of Kawinwanichakij et al. (2014) and Straatman et al. (submitted). Spectroscopic redshifts from CDF-S are taken from Vanzella et al. (2008), Le Fèvre et al. (2005), Szokoly et al. (2004), Doherty et al. (2005), Popesso et al. (2009), and Balestra et al. (2010). For COSMOS spectroscopic redshifts come from Lilly et al. (2009) and Trump et al. (2009). Spectroscopic redshifts for UDS come from Simpson et al. (2012) and Smail et al. (2008).
Stellar masses were derived by fitting stellar population synthesis templates to the m photometry using the SED-fitting code FAST (Kriek et al., 2009). FAST was run using a grid of Bruzual & Charlot (2003) models assuming a Chabrier (2003) IMF and solar metallicity. Exponentially declining star-formation histories () are used with log(/yr) ranging between in steps of 0.2 and allowing log(age/yr) to vary between in steps of 0.1. A Calzetti et al. (2000) extinction law is also incorporated with values of AV varying between in steps of 0.1.
Mass-completeness limits are estimated using a method similar to Quadri et al. (2012). Briefly, we estimate the distribution of mass-to-light ratios of galaxies that are somewhat above our K magnitude limit, and use this distribution to estimate the 90% mass-completeness limit of galaxies at K. These mass-completeness limits are shown in Figure 1 along with the distribution of stellar masses and redshifts of galaxies in the ZFOURGE catalogs. A more complete discussion of the mass-completeness limits will be presented by Straatman et al. (submitted).
2.3. Far-Infrared Imaging
We make use of Spizer/MIPS (GOODS-S: PI Dickinson, COSMOS: PI Scoville, UDS: PI Dunlop) and Herschel/PACS data (GOODS-S: Elbaz et al., 2011, COSMOS & UDS: PI Dickinson) for measuring total infrared luminosities (LIR) to derive SFRs. Imaging from these observatories used in this study include 24, 100 and 160m. Median 1 flux uncertainties for CDF-S/COSMOS/UDS are approximately 3.9/10.3/10.1 Jy in the 24m imaging, 0.20/0.43/0.45 mJy in the 100m imaging and 0.35/0.70/0.93 mJy in the 160m imaging respectively.
Due to the large PSFs of the MIPS/PACS imaging (FWHM 4″) source blending is a considerable effect. Therefore we use the Multi-Resolution Object PHotometry oN Galaxy Observations (MOPHONGO) code written by I. Labbé to extract deblended photometry in these far-IR data (for a detailed discussion see Labbé et al., 2006; Wuyts et al., 2007). The algorithm uses higher resolution imaging to generate a segmentation map containing information on the locations, sizes and extents of objects. In this work we use deep Ks band as the prior (FWHM 0.46″). Point-sources coincident in both images are used to construct a convolution kernel that maps between the high and low resolution PSFs. Objects used to construct this kernel need to be hand selected as many point-sources in the imaging are frequently undetected at far-IR wavelengths. A model of each far-IR image is generated by convolving the high-resolution segmentation map with the corresponding kernel allowing the intensities of individual objects to vary freely. Background and RMS maps are generated locally for each object on scales that are three times the 30″ tile-size used. By subtracting the modeled light of neighboring sources, “cleaned” image tiles of individual objects are produced which will be used in the stacking analysis discussed in the following section.
2.4. Sample Selection and Stacking
Modern near-infrared galaxy surveys have made it possible to detect approximately mass-complete samples of galaxies to high redshifts (). Unfortunately however, imaging used to probe obscured star-formation (typically far-IR and radio) rarely ever reach complementary depths. Thus, many studies over the past several years have turned to measuring SFRs from stacked data in order to compensate for this disparity (e.g. Dunne et al., 2009; Rodighiero et al., 2010; Karim et al., 2011; Whitaker et al., 2014; Schreiber et al., 2015). However it is important to keep in mind that the interpretation of stacked results may be complicated by the fact that the intrinsic distribution of SFRs may not be unimodal or symmetric.
We classify galaxies as either actively star-forming or quiescent using the UVJ color-color diagram (Labbé et al., 2005; Wuyts et al., 2007; Williams et al., 2009). The rest-frame (UV) and (VJ) colors are estimated using EAZY (Section 2.2). The advantage of this diagram is that it effectively separates the two reddening vectors caused by aging and dust extinction, decreasing the likelihood of dust-enshrouded star-forming galaxies being identified as quiescent. The UVJ diagram is thus a more effective tool for categorizing galaxies into star-forming and quiescent subsamples than a simple color-magnitude criterion.
The deep near-IR photometry (K) of ZFOURGE allows us to reliably select galaxies based on stellar mass. Across the entire redshift range considered in this work () we detect 12,433 galaxies in the Ks band imaging that lie above our estimated mass-completeness limits. From this mass-complete sample, we find that 5,875 (47%), 8,542 (69%) and 8,630 (69%) are not detected in the 24, 100 and 160m images respectively (where detection is defined as S/N 1). As such, we resort to stacking of the far-IR photometry for our Ks-selected sample in order to more precisely measure fluxes for ensembles of galaxies. In bins of redshift and stellar mass, we average-combine “cleaned” image tiles (see Section 2.3) of individual galaxies for each of the far-IR bandpasses. Stacking of “cleaned” imaging has been shown to significantly decrease contamination from blended sources (see also Fumagalli et al., 2014; Whitaker et al., 2014). Finally, photometry is measured in apertures of 3.5″, 4.0″and 6.0″ for the 24, 100 and 160m respectively with a background subtraction as measured from an annulus of radii 15″19″ on each stack. PSFs generated from bright objects are used to derive aperture corrections of 2.21, 1.76, and 1.61 respectively for the 24, 100 and 160m imaging. Because these PSFs were constructed on the same 30” tile-size these are not corrections to total flux, thus, we adopt additional correction factors of 1.2, 1.38, and 1.54 to account for flux that falls outside the tile.
In order to estimate the error on the mean flux measured for each stack we perform 100 bootstrap resamplings on each mass-redshift subsample. Stacks of the 24, 100, and 160m tiles are generated from these resamplings from which fluxes are measured as described above. We take the inter-68th percentile of these flux distributions as the corresponding uncertainties on the estimated IR fluxes. In Section 3 we describe how these uncertainties are propagated to estimates of LIR. It is worth mentioning that fluxes measured from stacking are subject to biases due to the clustering of galaxies. However, detailed simulations have shown this effect to be negligible at the image resolution of our dataset (Viero et al., 2013; Schreiber et al., 2015) and using “cleaned” image tiles also helps to minimize contamination from neighboring sources.
We remove sources suspected of hosting active galactic nuclei (AGN) from all samples based on radio, X-ray and IR indicators. Radio AGN are identified as sources with 1.4 GHz excess having where is the radio-inferred SFR based on equation 6 of Bell (2003) and is the IR-inferred SFR discussed in Section 2.5. More discussion of the selection and properties of radio AGN will be provided in Rees et al. (submitted). Unobscured X-ray AGN are identified as having and where and HR are the rest-frame X-ray luminosity in erg/s and hardness ratio respectively. All objects with are classified as QSOs and also rejected. Infrared AGN are identified based on an adaptation from the criteria of Messias et al. (2012) and will be presented in more detail by Cowley et al. (submitted).
2.5. Star-Formation Rate Measurements
We calculate total star-formation rates by adding contributions from UV and IR light. This approach assumes that the IR emission of galaxies (LIR) originates from dust heated by the obscured UV light of young, massive stars. Thus by adding its contribution to that of the unobscured UV luminosity (LUV) the total SFR for galaxies can be calculated. We use the conversion from Bell et al. (2005) scaled to a Chabrier (2003) IMF to derive SFRs from our data:
| (1) |
where LIR is the integrated 81000m luminosity and LUV represents the rest-frame 12163000Å luminosity, both in units of L⊙.
For our stacking analysis we aim to measure the average star-formation rate of galaxies in bins of redshift and stellar mass. In each mass-redshift bin we use the median rest-frame 2800Å luminosity output by EAZY for LUV and estimate 1 uncertainties from 100 bootstrap resamplings. We estimate bolometric infrared luminosities () by fitting an IR spectral template to the stacked 24-160m photometry. The template introduced by Wuyts et al. (2008), hereafter referred to as the W08 template, was constructed by averaging the logarithm of the spectral template library from Dale & Helou (2002) motivated by results from Papovich et al. (2007). The validity of this luminosity-independent conversion has been demonstrated by Muzzin et al. (2010) through comparison SFRs derived from H versus 24m fluxes for a sample of galaxies at .
Furthermore, Wuyts et al. (2011) find that at this luminosity-independent conversion yields consistent LIR estimates from 24m when compared to LIR derived from PACS photometry from the Herschel PEP survey (Lutz et al., 2011). For our stacking analysis, we smooth the W08 template by the redshift distribution of the galaxies in each mass-redshift bin prior to fitting.
Errors on LIR were estimated from 100 Monte Carlo simulations of the stacked IR fluxes. For each mass-redshift bin we perturb the stacked m fluxes by a normal probability density function (PDF) of width given by the estimated uncertainties described in Section 2.4. Infrared luminosities are calculated for each iteration in the same way as described above. Errors for LIR are derived from the 68th percentile range of each LIR distribution. We combine these with the uncertainties estimated for LUV to derive uncertainties on . All measurements of UV and IR luminosities, star-formation rates, and corresponding errors can be found in Table 1.
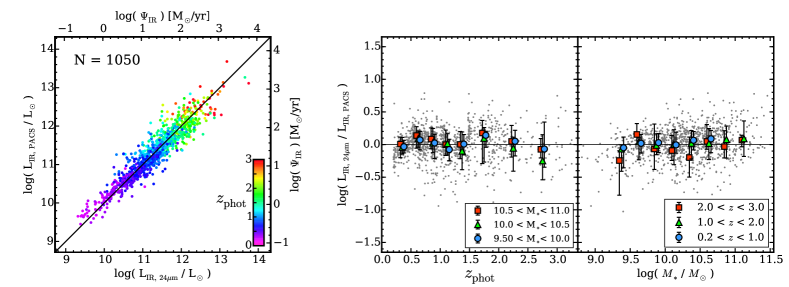
We test the W08 template against the present dataset using a sample of 1050 well-detected galaxies ( in all FIR bands). For each galaxy we fit the W08 template separately to the MIPS (24m) and the PACS (100+160m) photometry. In Figure 2 we show a comparison between the MIPS-only and PACS-only cases. Although we observe a general scatter of 0.2 dex we find an overall consistency with no dominant systematic trends. Even when subsampling in redshift and stellar mass the mean offset is nearly always within the scatter. We do note, however, the presence of a weak systematic trend with redshift in the middle panel of Figure 2 which is likely caused by PAH features shifting through the MIPS 24m passband. Nevertheless, the consistency between the MIPS-only and the PACS-only estimates of LIR suggests that the W08 template effectively describes the average IR SED of galaxies. It further suggests that reasonably reliable SFR estimates can be made with just a single IR band. In this section we have focused only on galaxies that are individually detected in the FIR bands. In section 3.1 we present evidence that the systematic errors become slightly larger for our fainter stacked samples.
3. The SFR Relation
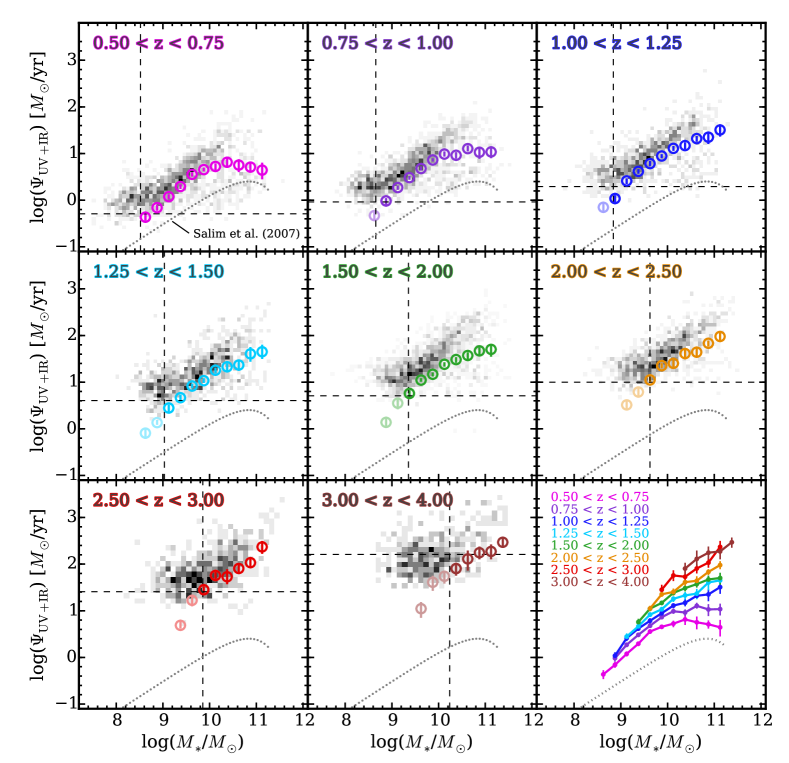
In Figure 3 we show our measurements of the SFR relation for all galaxies in eight redshift bins spanning . Evaluating completeness limits for is complicated since the depth of the far-IR imaging in CDF-S is deeper than in COSMOS and UDS. Furthermore, the ratio of IR to UV flux (infrared excess: IRX LIR/LUV) is strongly correlated with mass (e.g. Papovich et al., 2006; Whitaker et al., 2014), therefore, the completeness in will also be a function of stellar mass. Thus, to provide a visual guide in Figure 3 we plot the 1 MIPS 24m flux uncertainty converted to as horizontal dashed lines. Due to the different depths in the three fields we use the average of the estimated 1 flux variances in each of the fields for this conversion: Jy. We then scale the W08 template to this flux value, shifted to the upper redshift of each bin to calculate approximate limiting SFRs. Errors on stacked SFRs are determined from 100 bootstrap resamplings of their respective UV+IR stacks. The 68th-percintile range from the resulting distribution of SFRs is used to derive the 1 error (see Table LABEL:tab:sfrmass).
3.1. Comparison to Literature
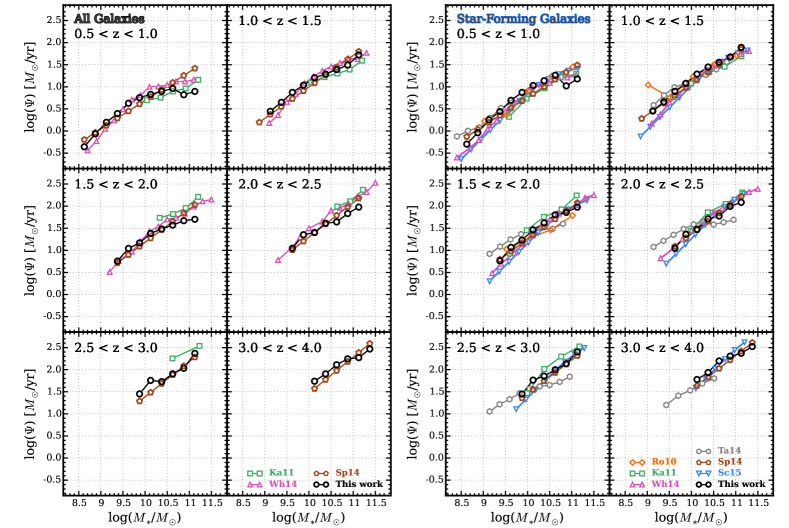
In Figure 4 we compare our SFR relations to recent results from the literature. The chosen SFR relations come from Rodighiero et al. (2010), Karim et al. (2011), Whitaker et al. (2014), Tasca et al. (2015), Speagle et al. (2014), and Schreiber et al. (2015). All works have been scaled to a Chabrier (2003) IMF for consistency. Overall there is good agreement among all of the measurements presented in Figure 4. For the full sample of galaxies (star-forming plus quiescent), the median inter-survey discrepancy at fixed stellar mass is 0.2, 0.17, 0.15, 0.16, 0.21, and 0.13 dex in the redshift bins (), (), (), (), (), and () respectively. For the star-forming sample these median discrepancies are 0.24, 0.17, 0.32, 0.17, 0.30, and 0.17 dex respectively. These differences are consistent with the inter-publication scatter found by Speagle et al. (2014) which draws on a larger sample of published SFR relations. Furthermore, differences of this order are comparable to variations in stellar mass estimates produced by SED fitting assuming different stellar population synthesis models (Conroy, 2013)
It is worth mentioning cosmic variance as a potential source for differences between SFR relations from different surveys. Whitaker et al. (2014) investigated this in detail by comparing the SFR relation as measured from each of the five CANDELS/3D-HST fields individually (see Appendix B of their paper). The field-to-field variation they find is comparable to the inter-survey variation that we find. Given that ZFOURGE covers less area ( arcmin2 versus arcmin2 for 3D-HST) we acknowledge that cosmic variance could explain the differences mentioned in the previous paragraph. Furthermore, Tomczak et al. (2014) quantify cosmic variance among the three ZFOURGE fields in their measurement of the stellar mass function, finding it to range from % over roughly the same mass and redshift ranges as used in this work.
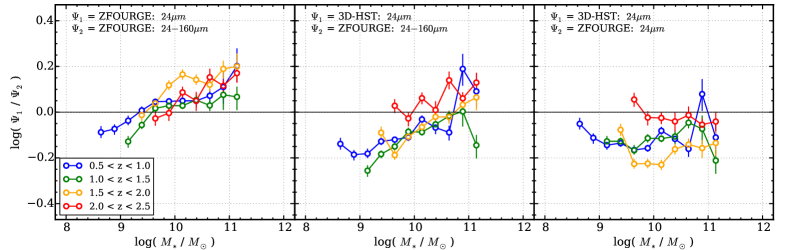
We do note, however, that for the full sample in Figure 4 at and our SFRs are systematically below the others. This offset goes away when we recalculate from our sample excluding the Herschel PACS 100 & 160m photometry but keeping the Spitzer MIPS 24m photometry. In Figure 5 we further investigate the impact that the Herschel PACS imaging has on our stacked SFRs. For this comparison we only consider star-forming galaxies. We first perform an internal comparison where we calculate both including and excluding the Herschel stacks. Interestingly we find a systematic trend wherein the SFRs of higher mass galaxies tend to be overestimated when relying on the MIPS 24m stacks alone for the IR contribution. This result contrasts what was found for galaxies that are individually detected in the far-IR images which show no strong evidence of a systematic trend (see Fig. 2). This suggests that the fainter, non-detected galaxies have SEDs that are not consistent with their more luminous counterparts (Muzzin et al., 2010; Wuyts et al., 2011). Nevertheless, this discrepancy is not dominant, but comparable to the level of scatter between surveys noted earlier ( dex).
We look into this difference in more detail by making use of the library of IR templates from Chary & Elbaz (2001, hereafter CE01). For each mass-redshift bin we find the individual best-fit CE01 template to the stacked m photometry. Comparing the IR luminosities derived from these best-fit templates to those derived from the W08 template we find a small scatter of dex with a similar offset in log(LIR/L⊙), and a hint that this offset increases to dex at . However, we don’t correct for this effect because these discrepancies are poorly constrained given that the FIR data do not probe the peak of the dust emission. We also note that this difference is less than the intrinsic uncertainty in individual star-formation rate calibrations (e.g. Bell et al. 2003, 2005).
The differences between the 24m-derived star-formation rates for 3D-HST and ZFOURGE in Figure 5 are particularly interesting. These surveys cover the same fields (although ZFOURGE only covers half the area), rely on much of the same public imaging in the optical and IR bands, have had photometry performed using similar methods, and use the same conversions to calculate the star-formation rates from the 2800Å and 24m flux. Thus the systematic differences in star-formation rates are indicative of the minimal differences that can be expected in inter-survey comparisons.
3.2. Comparison to Simulations
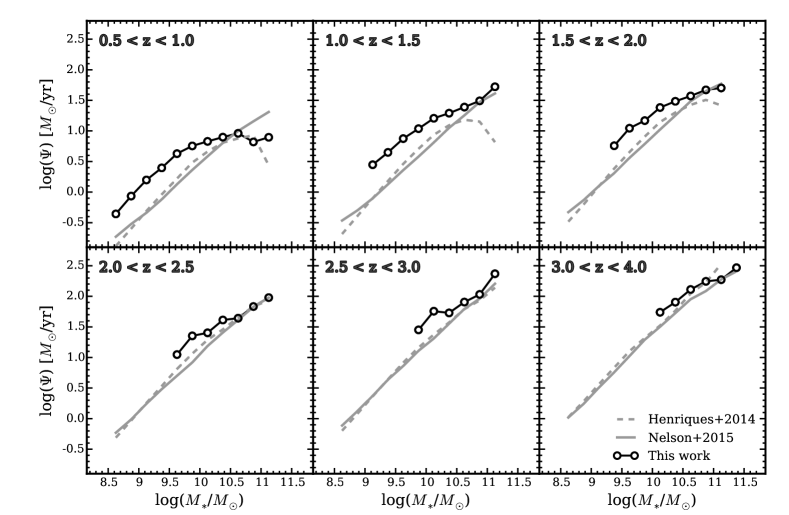
In Figure 6, we compare our measured SFR relations for the full sample of galaxies with results from the recent Illustris hydrodynamic simulation (Nelson et al., 2015) and the Munich semi-analytic galaxy formation model (Henriques et al., 2014). Gray lines correspond to the mean SFR in bins of stellar mass for each redshift interval indicated. Except at log(/) , both simulations are consistently in good agreement with each other (for further discussion of this point see Weinmann et al., 2012). In general, the simulations reproduce the roughly constant slope at albeit with an offset. This offset ranges between dex at fixed stellar mass and decreases with redshift (Sparre et al., 2015). At higher masses, however, Illustris and the Munich galaxy formation model tend to under-predict and over-predict the strength of the turnover at respectively.
3.3. Parameterizing the SFR- Relation
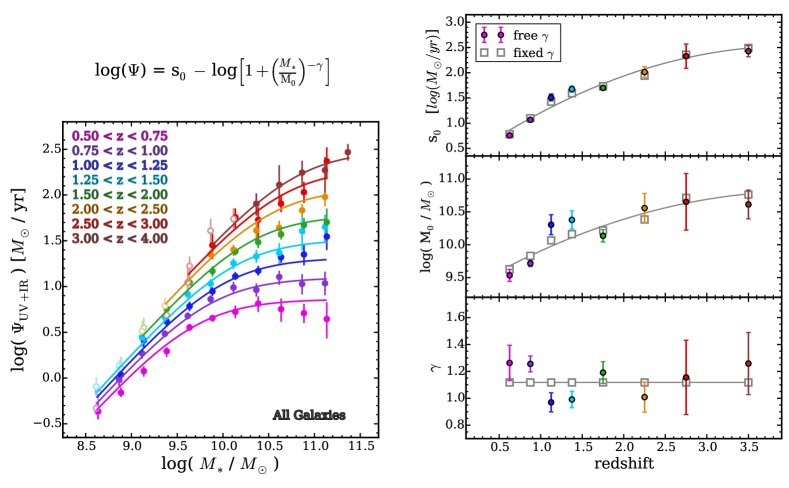
In Figure 7 we parameterize the SFR relation as a function of redshift. For this we adopt the same parameterization as Lee et al. (2015):
| (2) |
where s0 and M0 are in units of log(/yr) and respectively. This function behaves as a power-law of slope at low masses which asymptotically approaches a peak value s0 above a transitional stellar mass M0. Originally this parameterization was defined for the SFR relation of star-forming galaxies, though we find it works similarly well for the SFR relation of all galaxies (star-forming plus quiescent) at the redshifts and stellar masses considered for this study. The righthand panels of Figure 7 show the best-fit parameters vs. redshift. We consider two cases for fitting: “free ” and “fixed ”. In the “free ” case, we allow all three parameters to vary independently for each redshift bin. Noticing that does not show strong evidence for evolution, we perform the “fixed ” case by refitting with fixed to its mean value from the “free ” fits. We then parameterize the evolution of s0 and M0 with second-order polynomials.
| (3) |
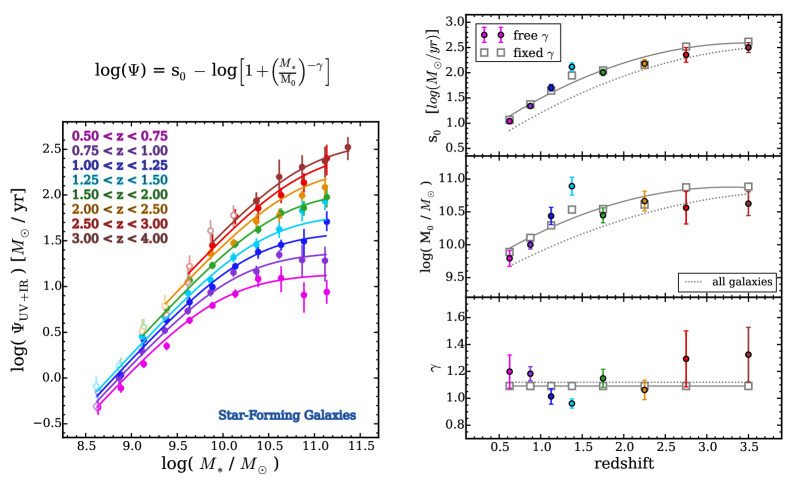
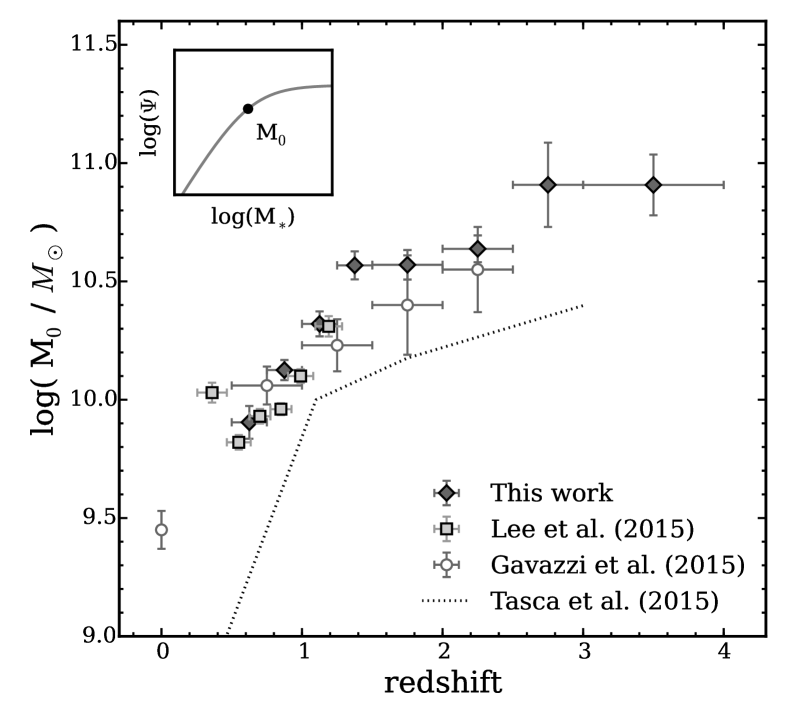
Evolution in the transition mass is a new discovery, first reported quantitatively at by Lee et al. (2015) from a study of the COSMOS 2 deg2 field. Recent results from Gavazzi et al. (2015) show that this evolution extends to and that extrapolating to coincides with a break observed in the local SFR relation. Results from the VUDS spectroscopic survey have also found a redshift dependence for the turnover mass (Tasca et al., 2015). However, because we include all galaxies in the analysis presented here the observed evolution of M0 may be a consequence of the increasing population of massive quenched galaxies at low-. Therefore, we repeat this analysis for a sample of actively star-forming galaxies selected based on rest-frame (UV) and (VJ) colors (see Section 2.4). Evolution in M0 is still apparent; results are shown in Figure 8. In Figure 9 we compare our measured values of the turnover mass to those of Lee et al. (2015), Gavazzi et al. (2015), and Tasca et al. (2015).
| (4) |
We remind the reader that these parameterizations may not extrapolate well outside of the redshift and/or stellar mass ranges used here. Nevertheless, our low-mass slope of is consistent with the relative constancy of the low-mass slope of the SMF (Tomczak et al., 2014); if deviated significantly from unity then would be expected to evolve strongly with redshift (Peng et al., 2010; Weinmann et al., 2012; Leja et al., 2015).
Figure 8 shows that (s0, M0, ) follow similar trends with redshift between the star-forming and total samples indicating that the presence and evolution of the turnover mass is intrinsic to the star-forming population and is not simply due to a growing quiescent population diluting the star-formation rates at the high mass end. We also point out that the apparent similarity in the fitted parameters does not suggest a redshift-independent quiescent fraction; in fact, the difference between the SFR-M* relations at between the star-forming and the total sample are roughly consistent with the evolution of the quiescent fraction as derived from the Tomczak et al. (2014) mass functions, and assuming negligible star formation in the quiescent galaxies.
4. Inferring Stellar Mass Growth
4.1. Growth of the Stellar Mass Function
The growth of galaxies as predicted from the SFR relation can be compared directly to the evolution of the stellar mass function. Leja et al. (2015) performed such an analysis using stellar mass functions from Tomczak et al. (2014) and SFR relations from Whitaker et al. (2012) finding that the inferred growth from star-formation greatly over-predicts the observed number densities of galaxies, even on short cosmic timescales ( Gyr). Those authors suggest that the SFR relation must have a steeper slope () at masses below at , which is consistent with measurements from this work and recent literature (Whitaker et al., 2014; Lee et al., 2015; Schreiber et al., 2015).
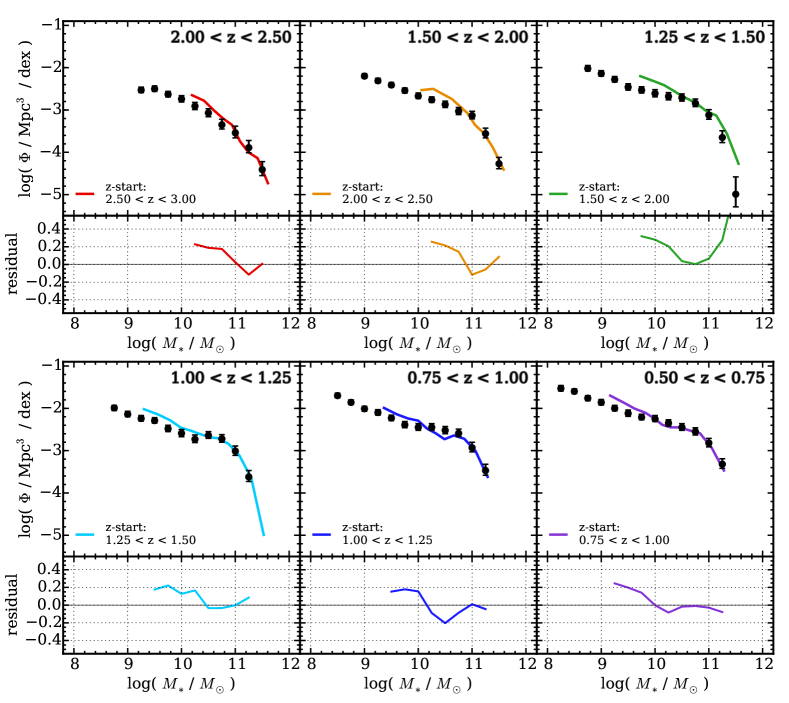
Thus, we perform the same comparison using our updated SFR relation. At each stellar mass for a given SMF at a given redshift, SFRs are calculated from the parameterized SFR relation for all galaxies (Equations 2 and 3). In times steps of 80 Myr each mass bin is shifted by the amount of star formation added to that bin. SFRs are recalculated at each new time step. Mass loss due to stellar evolution is accounted for according to Equation 16 of Moster et al. (2013). Using this technique, we evolve the observed SMF in each redshift bin forward and compare it to the observed SMF in the next redshift bin; results are shown in Figure 10
In general, we typically find reasonable agreement at intermediate stellar masses (). At lower masses, however, we find a consistent systematic offset in number density rising to dex. It is important to note that this method does not incorporate the effect of galaxy-galaxy mergers whereas the observed evolution galaxy SMF necessarily does. Therefore, the disparity between these two curves inherently includes a signature of merging; in fact, Drory & Alvarez (2008) use this difference to constrain galaxy growth rates due to merging. Mergers will help to alleviate the discrepancy we observe if these low-mass galaxies are merging with more massive galaxies, thereby reducing their number density. However this would require between % of these galaxies to merge with a more massive galaxy per Gyr, which substantially exceeds current estimates of galaxy merger rates (e.g. Lotz et al., 2011; Williams et al., 2011; Leja et al., 2015). This disagreement thus implies that the SFRs are overestimated and/or the growth of the Tomczak et al. (2014) SMF is too slow. Similar issues were previously discussed by Weinmann et al. (2009) and Leja et al. (2015), but in contrast to the drastic discrepancies between star-formation rates and stellar masses reported by those authors, here we show that using new data sets greatly reduces – but does not eliminate – the discrepancies.
4.2. Empirical Star-Formation Histories
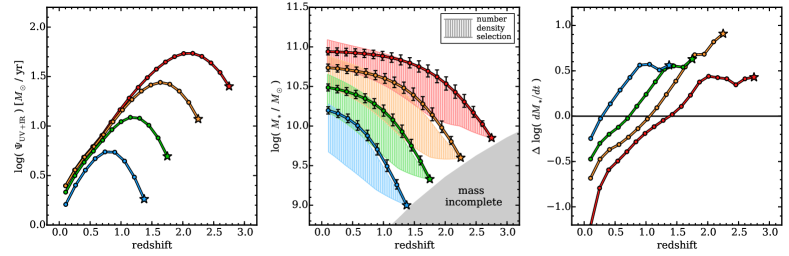
The evolution of the SFR relation can be used to infer typical star-formation histories and stellar mass-growth histories for individual galaxies. However, as seen in the previous subsection, there is tension between the growth of the galaxy population as inferred from the SFR relation when comparing to the observed stellar mass function. Here we explore two different approaches for empirically deriving galaxy mass-growth histories: (1) integrating differential star-formation histories extracted from the SFR relation and (2) identifying descendents of high- galaxies based on number density selected (NDS) samples (Figure 11). For the former, we start with the four sets of initial conditions (, , ) indicated by the star symbols, where is determined by our SFR parameterizations (Equations 2 and 3). Stellar mass is then incrementally added assuming constant star-formation over small time intervals of Myr. At the end of each time step adjusted according to the SFR parameterization . At lower redshifts we interpolate between our lowest redshift SFR relation and Equation 13 of Salim et al. (2007). Mass loss due to stellar evolution is accounted for according to Equation 16 of Moster et al. (2013).
In order to get a rough estimate of the scatter in these SFHs we run 1000 Monte Carlo simulations, resampling from a log-normal PDF with a mean value given by and 0.3 dex scatter. The approximate range of mass-growth for each galaxy sample is calculated from the 16th and 84th percentiles of the distribution.
A number of studies have used this technique to estimate galaxy growth histories (e.g. Renzini, 2009; Peng et al., 2010; Leitner, 2012). An important point that should be kept in mind is that in this section we use the SFR relation for all galaxies not just actively star-forming ones as is appropriate for a comparison to NDS samples. Some other studies investigate the growth histories of galaxies that remain star-forming without ever quenching (Renzini, 2009; Leitner, 2012).
Also shown in the middle panel of Figure 11 are mass-growth profiles predicted from the NDS approach. Using the same initial conditions shown by the star symbols, we calculate the corresponding cumulative co-moving number density from the stellar mass functions of Tomczak et al. (2014) as parameterized by Leja et al. (2015). Note, this parameterization is limited to , beyond which we interpolate between it and the best-fit Schechter function to the SMF at .
Using abundance matching with a dark matter simulation, whereby dark matter halos are assigned stellar masses from observations in a rank ordering fashion, Behroozi et al. (2013) have studied the number density evolution of galaxies. These authors demonstrate that galaxy descendants do not evolve in the same way as their progenitors, mainly due to scatter in dark matter accretion rates of halos. Thus, Behroozi et al. (2013) have provided a numerical recipe for estimating the number density evolution of galaxies, which we use to generate predictions for the number density evolution from the initial conditions given in Figure 11. These predictions include the median estimated number density as well as the 68th percentile range. The hatched regions in Figure 11 show these 68th percentile ranges converted to stellar masses by mapping number densities to the observed stellar mass function.
On average we find that these two approaches agree within their combined 1 confidence intervals. However there is a common systematic difference wherein the differential SFHs produce a steeper mass-growth rate for the same progenitor galaxy at early times which provides us with a different view of the discrepancy shown in Figure 10. This disparity is illustrated in the rightmost panel of Figure 11 which shows the difference in the mass-growth rates of both techniques from the middle panel. The differential SFHs build stellar mass more quickly at early times, but then slow down and are eventually overtaken by the NDS growth rates. We tested a wide range of initial conditions spanning and , always finding this systematic trend. Papovich et al. (2015) find similar results in their analysis of the progenitors of galaxies with present-day masses of the Milky Way and M31 galaxies. Finally, we have repeated this comparison using the SFR parameterizations provided by Whitaker et al. (2014) and Schreiber et al. (2015) and in both cases we find similar disagreements. This suggests that the discrepancies between the star-formation rates and mass evolution that were previously reported by Leja et al. (2015) have not been completely resolved using the more up-to-date data sets.
5. Conclusions
In this paper we present new measurements of the evolution of the SFR relation using deep imaging and high-quality photometric redshifts from the FourStar Galaxy Evolution Survey (ZFOURGE) in combination with ancillary far-IR imaging at 24, 100, and 160m from Spitzer and Herschel. Bolometric IR luminosities (LIR), used for calculating obscured star-formation rates, are obtained by scaling the IR spectral template introduced by Wuyts et al. (2008) to the m photometry. This luminosity-independent conversion of flux to LIR has been shown to be more appropriate than techniques that apply different IR templates for different LIR regimes (Muzzin et al., 2010; Wuyts et al., 2011).
Utilizing star-formation rates derived from a UV+IR stacking analysis we examine evolution of the SFR relation at . We perform this analysis for all galaxies as well as a sample of actively star-forming galaxies as selected by their rest-frame (UV) and (VJ) colors. In agreement with recent results, we find that SFRs are roughly proportional to stellar mass at low masses ( ), but that this trend flattens at higher masses (see also Whitaker et al., 2014; Lee et al., 2015; Schreiber et al., 2015; Tasca et al., 2015). Furthermore, although the evolution of the SFR relation is still predominantly in normalization, the slope at high masses ( ) is also changing. Similar to Lee et al. (2015) and Tasca et al. (2015) we find that the transition mass at which this flattening occurs evolves with redshift; this is true whether or not quenched galaxies are included. Full parameterizations of the SFR relation with respect to redshift, , for both all and star-forming galaxies are presented in Section 3.3 and shown in Figures 7 and 8.
By integrating along the evolving SFR sequence we estimate how galaxies should grow due to star-formation. We find that galaxies with a present-day mass of roughly have grown in mass by about 10 since . In contrast, galaxies have grown by only about 1.5 since , but show more rapid evolution at higher redshifts, growing by 15 between over . Furthermore, we find that SFHs rise at early times and fall at late times. The peak of a galaxy’s SFH occurs earlier for galaxies with larger present-day masses; for example galaxies with a present-day stellar mass around peak at , whereas galaxies peak at . Several recent studies have also found evidence in support of rising SFHs in individual galaxies at early times (e.g. Papovich et al., 2011; Reddy et al., 2012; Lee et al., 2011; Abramson et al., 2015).
A standard question in galaxy evolution has been whether integrated star-formation rates are consistent with evolution of the global stellar mass density (e.g. Wilkins et al. 2008, Reddy & Steidel 2009), with recent measurements suggesting that these quantities may be in reasonable – though not perfect – agreement (Madau & Dickinson 2014). Here we have taken a step further, using new data to ask whether the star-formation rates agree with the mass density evolution in bins of stellar mass. We use the evolution of the SFR relation to predict the growth of galaxies due to star formation which we directly compare to the observed galaxy stellar mass function (Figure 10). At intermediate stellar masses () in the redshift range we find reasonable agreement. However at lower masses the star-formation rates suggest a buildup that is too large in comparison to the evolution of the mass function. This discrepancy may be partially explained by mergers, in which the lower-mass galaxies merge with more massive ones. However the merger rates required to resolve this discrepancy are unreasonably large (roughly % per Gyr). This disagreement, also reported by Leja et al. (2015), implies that the SFRs are overestimated and/or that the growth of the Tomczak et al. (2014) mass function is too slow.
Looking further into the buildup of stellar mass, we use two techniques to extract empirical star-formation and mass-growth histories from observations (see Figure 11). The first is the method described earlier whereby SFHs are derived by integrating along the evolving SFR relation from a set of initial conditions. The second technique estimates mass-growth histories from measurements of the galaxy stellar mass function using an evolving number density selection (NDS) criterion (Behroozi et al. 2013). It is worthwhile to note that both techniques provide typical SFHs along with a rough indication of the scatter, but that individual galaxies may follow very different evolutionary pathways (Kelson 2014; Abramson et al. 2015). We find that these two methods for deriving galaxy growth histories provide qualitatively similar results, but that they do disagree in detail. In general we observe a systematic difference wherein the integrated SFHs suggest more rapid mass evolution at higher redshifts than is inferred from the NDS samples. This disagreement in mass-growth rates reaches to dex at the highest redshifts that we can probe. At lower redshifts the NDS predict more rapid evolution; this can be naturally explained by galaxy mergers, and the size of the difference can be taken as a measure of the growth rate due to mergers (e.g. Drory & Alvarez, 2008; Moustakas et al., 2013). Nevertheless, these two approaches on average agree within their combined 1 confidence intervals.
The disagreement at suggests that either our SFRs are overestimated, that the rate of mass-growth inferred from the stellar mass function is underestimated, or both. Errors in star-formation rate measurements may arise from low-level AGN activity, an incorrect conversion of flux to bolometric UV/IR luminosities, the assumed IMF, and variations in star-forming duty cycles as probed by UV and IR indicators. Stellar masses were estimated by fitting models to the observed spectral energy distributions (SEDs) of individual galaxies. Various assumptions that go into the SED-fitting process that are possible sources for systematic errors include smooth exponentially declining SFHs, a single dust screen, a constant IMF, solar metallicity, and assuming that emission lines do not contribute significantly to the observed photometry (for detailed discussions see Marchesini et al., 2009; Conroy, 2013; Courteau et al., 2014). Analyzing the scatter introduced into the star-formation rate and stellar mass estimates by varying these assumptions would inform the range of possible stellar mass growth histories, but is beyond the scope of this work.
The measurements on which this study is based were performed using high-quality data and standard methods. Moreover, the use of the same ZFOURGE sample for measuring both the SMF and the SFR relations helps provide internal consistency for this work. Although the broad qualitative agreement that we find in mass-growth histories is encouraging for current studies of galaxy evolution, the disagreements highlight the need to move beyond the simplistic assumptions that underly current data analysis methods.
| (1) | (2) | (3) | (4) | (5) | (6) | (7) | (8) | (9) | (10) |
| redshift | log() | log(LUV)all | log(LIR)all | log()all | log(LUV)sf | log(LIR)sf | log()sf | ||
| range | [] | [L⊙] | [L⊙] | [/yr] | [L⊙] | [L⊙] | [/yr] | ||
| 8.625 | 493 | 456 | |||||||
| 8.875 | 391 | 343 | |||||||
| 9.125 | 300 | 260 | |||||||
| 9.375 | 261 | 234 | |||||||
| 9.625 | 203 | 175 | |||||||
| 9.875 | 146 | 111 | |||||||
| 10.125 | 147 | 93 | |||||||
| 10.375 | 101 | 56 | |||||||
| 10.625 | 67 | 30 | |||||||
| 10.875 | 46 | 27 | |||||||
| 11.125 | 18 | 8 | |||||||
| 8.625 | 599 | 583 | |||||||
| 8.875 | 477 | 452 | |||||||
| 9.125 | 376 | 351 | |||||||
| 9.375 | 298 | 268 | |||||||
| 9.625 | 202 | 178 | |||||||
| 9.875 | 162 | 137 | |||||||
| 10.125 | 128 | 85 | |||||||
| 10.375 | 107 | 64 | |||||||
| 10.625 | 77 | 44 | |||||||
| 10.875 | 42 | 22 | |||||||
| 11.125 | 23 | 12 | |||||||
| 8.625 | 371 | 368 | |||||||
| 8.875 | 379 | 376 | |||||||
| 9.125 | 284 | 282 | |||||||
| 9.375 | 248 | 239 | |||||||
| 9.625 | 157 | 146 | |||||||
| 9.875 | 113 | 99 | |||||||
| 10.125 | 123 | 95 | |||||||
| 10.375 | 92 | 57 | |||||||
| 10.625 | 83 | 59 | |||||||
| 10.875 | 36 | 22 | |||||||
| 11.125 | 12 | 8 | |||||||
| 8.625 | 287 | 286 | |||||||
| 8.875 | 429 | 426 | |||||||
| 9.125 | 354 | 348 | |||||||
| 9.375 | 269 | 265 | |||||||
| 9.625 | 205 | 197 | |||||||
| 9.875 | 151 | 141 | |||||||
| 10.125 | 148 | 128 | |||||||
| 10.375 | 121 | 90 | |||||||
| 10.625 | 77 | 45 | |||||||
| 10.875 | 56 | 37 | |||||||
| 11.125 | 14 | 8 | |||||||
| 8.875 | 645 | 644 | |||||||
| 9.125 | 752 | 747 | |||||||
| 9.375 | 616 | 607 | |||||||
| 9.625 | 438 | 416 | |||||||
| 9.875 | 316 | 287 | |||||||
| 10.125 | 239 | 199 | |||||||
| 10.375 | 179 | 133 | |||||||
| 10.625 | 142 | 94 | |||||||
| 10.875 | 119 | 83 | |||||||
| 11.125 | 30 | 19 | |||||||
| 9.125 | 475 | 475 | |||||||
| 9.375 | 514 | 513 | |||||||
| 9.625 | 403 | 400 | |||||||
| 9.875 | 250 | 236 | |||||||
| 10.125 | 197 | 173 | |||||||
| 10.375 | 124 | 103 | |||||||
| 10.625 | 107 | 81 | |||||||
| 10.875 | 79 | 55 | |||||||
| 11.125 | 36 | 29 | |||||||
| 9.125 | 242 | 240 | |||||||
| 9.375 | 327 | 323 | |||||||
| 9.625 | 269 | 265 | |||||||
| 9.875 | 151 | 150 | |||||||
| 10.125 | 104 | 97 | |||||||
| 10.375 | 86 | 67 | |||||||
| 10.625 | 66 | 56 | |||||||
| 10.875 | 29 | 24 | |||||||
| 11.125 | 15 | 14 | |||||||
| 9.625 | 256 | 253 | |||||||
| 9.875 | 166 | 161 | |||||||
| 10.125 | 122 | 111 | |||||||
| 10.375 | 65 | 58 | |||||||
| 10.625 | 34 | 28 | |||||||
| 10.875 | 30 | 24 | |||||||
| 11.125 | 14 | 12 | |||||||
| 11.375 | 7 | 7 | |||||||
| Notes: A downloadable ascii version of this table will be hosted at http://zfourge.tamu.edu/ | |||||||||
References
- Abramson et al. (2015) Abramson, L. E., Gladders, M. D., Dressler, A., et al. 2015, ApJ, 801, L12
- Balestra et al. (2010) Balestra, I., Mainieri, V., Popesso, P., et al. 2010, A&A, 512, A12
- Behroozi et al. (2013) Behroozi, P. S., Marchesini, D., Wechsler, R. H., et al. 2013, ApJ, 777, L10
- Bell (2003) Bell, E. F. 2003, ApJ, 586, 794
- Bell et al. (2005) Bell, E. F., Papovich, C., Wolf, C., et al. 2005, ApJ, 625, 23
- Brammer et al. (2008) Brammer, G. B., van Dokkum, P. G., & Coppi, P. 2008, Astrophysical Journal, 686, 1503
- Brinchmann et al. (2004) Brinchmann, J., Charlot, S., White, S. D. M., et al. 2004, Monthly Notices of the Royal Astronomical Society, 351, 1151–1179
- Bruzual & Charlot (2003) Bruzual, G., & Charlot, S. 2003, Monthly Notices RAS, 344, 1000
- Calzetti et al. (2000) Calzetti, D., Armus, L., Bohlin, R. C., et al. 2000, ApJ, 533, 682
- Capak et al. (2007) Capak, P., Aussel, H., Ajiki, M., et al. 2007, ASTROPHYS J SUPPL S, 172, 99
- Chabrier (2003) Chabrier, G. 2003, Publications of the Astronomical Society of the Pacific, 115, 763
- Chary & Elbaz (2001) Chary, R., & Elbaz, D. 2001, ApJ, 556, 562
- Conroy (2013) Conroy, C. 2013, ARA&A, 51, 393
- Courteau et al. (2014) Courteau, S., Cappellari, M., de Jong, R. S., et al. 2014, Reviews of Modern Physics, 86, 47
- Cowley et al. (submitted to MNRAS) Cowley, M., et al. 2015, MNRAS, submitted
- Dale & Helou (2002) Dale, D. A., & Helou, G. 2002, ApJ, 576, 159
- Doherty et al. (2005) Doherty, M., Bunker, A. J., Ellis, R. S., & McCarthy, P. J. 2005, MNRAS, 361, 525
- Dolphin et al. (2003) Dolphin, A. E., Saha, A., Skillman, E. D., et al. 2003, AJ, 126, 187
- Drory & Alvarez (2008) Drory, N., & Alvarez, M. 2008, ApJ, 680, 41
- Dunne et al. (2009) Dunne, L., Ivison, R. J., Maddox, S., et al. 2009, MNRAS, 394, 3
- Elbaz et al. (2011) Elbaz, D., Dickinson, M., Hwang, H. S., et al. 2011, A&A, 533, A119
- Fioc & Rocca-Volmerange (1997) Fioc, M., & Rocca-Volmerange, B. 1997, A&A, 326, 950
- Fumagalli et al. (2014) Fumagalli, M., Labbé, I., Patel, S. G., et al. 2014, ApJ, 796, 35
- Gavazzi et al. (2015) Gavazzi, G., Consolandi, G., Dotti, M., et al. 2015, A&A, 580, A116
- Giacconi et al. (2002) Giacconi, R., Zirm, A., Wang, J., et al. 2002, ASTROPHYS J SUPPL S, 139, 369
- Gilbank et al. (2011) Gilbank, D. G., Bower, R. G., Glazebrook, K., et al. 2011, MNRAS, 414, 304
- Heavens et al. (2004) Heavens, A., Panter, B., Jimenez, R., & Dunlop, J. 2004, Nature, 428, 625
- Henriques et al. (2014) Henriques, B., White, S., Thomas, P., et al. 2014, ArXiv e-prints, arXiv:1410.0365
- Karim et al. (2011) Karim, A., Schinnerer, E., Martínez-Sansigre, A., et al. 2011, ApJ, 730, 61
- Kawinwanichakij et al. (2014) Kawinwanichakij, L., Papovich, C., Quadri, R. F., et al. 2014, ApJ, 792, 103
- Kelson (2014) Kelson, D. D. 2014, ArXiv e-prints, arXiv:1406.5191
- Kennicutt (1998) Kennicutt, Jr., R. C. 1998, ARA&A, 36, 189
- Kriek et al. (2009) Kriek, M., van Dokkum, P. G., Labbé, I., et al. 2009, ApJ, 700, 221
- Labbé et al. (2006) Labbé, I., Bouwens, R., Illingworth, G. D., & Franx, M. 2006, ApJ, 649, L67
- Labbé et al. (2005) Labbé, I., Huang, J., Franx, M., et al. 2005, ApJ, 624, L81
- Lawrence et al. (2007) Lawrence, A., Warren, S. J., Almaini, O., et al. 2007, Monthly Notices of the Royal Astronomical Society, 379, 1599
- Le Fèvre et al. (2005) Le Fèvre, O., Vettolani, G., Garilli, B., et al. 2005, A&A, 439, 845
- Lee et al. (2011) Lee, K.-S., Dey, A., Reddy, N., et al. 2011, ApJ, 733, 99
- Lee et al. (2015) Lee, N., Sanders, D. B., Casey, C. M., et al. 2015, ApJ, 801, 80
- Leitner (2012) Leitner, S. N. 2012, ApJ, 745, 149
- Leja et al. (2015) Leja, J., van Dokkum, P. G., Franx, M., & Whitaker, K. E. 2015, ApJ, 798, 115
- Leja et al. (2013) Leja, J., van Dokkum, P. G., Momcheva, I., et al. 2013, ApJ, 778, L24
- Lilly et al. (2009) Lilly, S. J., Le Brun, V., Maier, C., et al. 2009, ApJS, 184, 218
- Lotz et al. (2011) Lotz, J. M., Jonsson, P., Cox, T. J., et al. 2011, ApJ, 742, 103
- Lutz et al. (2011) Lutz, D., Poglitsch, A., Altieri, B., et al. 2011, A&A, 532, A90
- Madau & Dickinson (2014) Madau, P., & Dickinson, M. 2014, ARA&A, 52, 415
- Maraston (2005) Maraston, C. 2005, MNRAS, 362, 799
- Marchesini et al. (2009) Marchesini, D., van Dokkum, P. G., Förster Schreiber, N. M., et al. 2009, ApJ, 701, 1765
- Messias et al. (2012) Messias, H., Afonso, J., Salvato, M., Mobasher, B., & Hopkins, A. M. 2012, ApJ, 754, 120
- Moster et al. (2013) Moster, B. P., Naab, T., & White, S. D. M. 2013, MNRAS, 428, 3121
- Moustakas et al. (2013) Moustakas, J., Coil, A. L., Aird, J., et al. 2013, ApJ, 767, 50
- Muzzin et al. (2010) Muzzin, A., van Dokkum, P., Kriek, M., et al. 2010, ApJ, 725, 742
- Nelson et al. (2015) Nelson, D., Pillepich, A., Genel, S., et al. 2015, ArXiv e-prints, arXiv:1504.00362
- Noeske et al. (2007) Noeske, K. G., Weiner, B. J., Faber, S. M., et al. 2007, The Astrophysical Journal, 660, L43–L46
- Papovich et al. (2011) Papovich, C., Finkelstein, S. L., Ferguson, H. C., Lotz, J. M., & Giavalisco, M. 2011, MNRAS, 412, 1123
- Papovich et al. (2006) Papovich, C., Moustakas, L. A., Dickinson, M., et al. 2006, ApJ, 640, 92
- Papovich et al. (2007) Papovich, C., Rudnick, G., Floc’h, E. L., et al. 2007, ApJ, 668, 45
- Papovich et al. (2015) Papovich, C., Labbé, I., Quadri, R., et al. 2015, ApJ, 803, 26
- Patel et al. (2013) Patel, S. G., Fumagalli, M., Franx, M., et al. 2013, ApJ, 778, 115
- Peng et al. (2010) Peng, Y.-j., Lilly, S. J., Kovač, K., et al. 2010, ApJ, 721, 193
- Persson et al. (2013) Persson, S. E., Murphy, D. C., Smee, S., et al. 2013, Publications of the Astronomical Society of the Pacific, 125, 654
- Pilbratt et al. (2010) Pilbratt, G. L., Riedinger, J. R., Passvogel, T., et al. 2010, A&A, 518, L1
- Popesso et al. (2009) Popesso, P., Dickinson, M., Nonino, M., et al. 2009, A&A, 494, 443
- Quadri et al. (2012) Quadri, R. F., Williams, R. J., Franx, M., & Hildebrandt, H. 2012, ApJ, 744, 88
- Reddy et al. (2012) Reddy, N. A., Pettini, M., Steidel, C. C., et al. 2012, ApJ, 754, 25
- Reddy & Steidel (2009) Reddy, N. A., & Steidel, C. C. 2009, ApJ, 692, 778
- Rees et al. (submitted to MNRAS) Rees, G. A., et al. 2015, MNRAS, submitted
- Renzini (2009) Renzini, A. 2009, MNRAS, 398, L58
- Rodighiero et al. (2010) Rodighiero, G., Cimatti, A., Gruppioni, C., et al. 2010, A&A, 518, L25
- Salim et al. (2007) Salim, S., Rich, R. M., Charlot, S., et al. 2007, ApJS, 173, 267
- Schreiber et al. (2015) Schreiber, C., Pannella, M., Elbaz, D., et al. 2015, A&A, 575, A74
- Simpson et al. (2012) Simpson, C., Rawlings, S., Ivison, R., et al. 2012, MNRAS, 421, 3060
- Smail et al. (2008) Smail, I., Sharp, R., Swinbank, A. M., et al. 2008, MNRAS, 389, 407
- Sparre et al. (2015) Sparre, M., Hayward, C. C., Springel, V., et al. 2015, MNRAS, 447, 3548
- Speagle et al. (2014) Speagle, J. S., Steinhardt, C. L., Capak, P. L., & Silverman, J. D. 2014, ApJS, 214, 15
- Straatman et al. (submitted to ApJ) Straatman, C. M. S., et al. 2015, ApJ, submitted
- Szokoly et al. (2004) Szokoly, G. P., Bergeron, J., Hasinger, G., et al. 2004, ApJS, 155, 271
- Tasca et al. (2015) Tasca, L. A. M., Le Fèvre, O., Hathi, N. P., et al. 2015, A&A, 581, A54
- Thomas et al. (2005) Thomas, D., Maraston, C., Bender, R., & Mendes de Oliveira, C. 2005, ApJ, 621, 673
- Tomczak et al. (2014) Tomczak, A. R., Quadri, R. F., Tran, K.-V. H., et al. 2014, ApJ, 783, 85
- Trump et al. (2009) Trump, J. R., Impey, C. D., Elvis, M., et al. 2009, ApJ, 696, 1195
- van Dokkum et al. (2010) van Dokkum, P. G., Whitaker, K. E., Brammer, G., et al. 2010, ApJ, 709, 1018
- Vanzella et al. (2008) Vanzella, E., Cristiani, S., Dickinson, M., et al. 2008, A&A, 478, 83
- Viero et al. (2013) Viero, M. P., Moncelsi, L., Quadri, R. F., et al. 2013, ApJ, 779, 32
- Weinmann et al. (2012) Weinmann, S. M., Pasquali, A., Oppenheimer, B. D., et al. 2012, MNRAS, 426, 2797
- Werner et al. (2004) Werner, M. W., Roellig, T. L., Low, F. J., et al. 2004, ApJS, 154, 1
- Whitaker et al. (2012) Whitaker, K. E., van Dokkum, P. G., Brammer, G., & Franx, M. 2012, The Astrophysical Journal, 754, L29
- Whitaker et al. (2014) Whitaker, K. E., Franx, M., Leja, J., et al. 2014, ApJ, 795, 104
- Wilkins et al. (2008) Wilkins, S. M., Trentham, N., & Hopkins, A. M. 2008, MNRAS, 385, 687
- Williams et al. (2011) Williams, R. J., Quadri, R. F., & Franx, M. 2011, ApJ, 738, L25
- Williams et al. (2009) Williams, R. J., Quadri, R. F., Franx, M., van Dokkum, P., & Labbé, I. 2009, ApJ, 691, 1879
- Wuyts et al. (2008) Wuyts, S., Labbé, I., Schreiber, N. M. F., et al. 2008, ApJ, 682, 985
- Wuyts et al. (2007) Wuyts, S., Labbé, I., Franx, M., et al. 2007, ApJ, 655, 51
- Wuyts et al. (2011) Wuyts, S., Förster Schreiber, N. M., Lutz, D., et al. 2011, ApJ, 738, 106