Simulating feedback from nuclear clusters: the impact of multiple sources
Abstract
Nuclear star clusters (NCs) are found to exist in the centres of many galaxies and appear to follow scaling relations similar to those of super-massive black holes. Previous analytical work has suggested that such relations are a consequence of feedback regulated growth. We explore this idea using high resolution hydrodynamical simulations, focusing on the validity of the simplifying assumptions made in analytical models. In particular, we investigate feedback emanating from multiple stellar sources rather than from a single source, as is usually assumed, and show that collisions betweens shells of gas swept up by feedback leads to momentum cancellation and the formation of high density clumps and filaments. This high density material is resistant both to expulsion from the galaxy potential and to disruption by feedback; if it falls back onto the NC, we expect the gas to be available for further star formation or for feeding a central black hole. We also note our results may have implications for the evolution of globular clusters and stellar clusters in high redshift dark matter halos.
keywords:
galaxies: formation - galaxies: evolution - galaxies: nuclei - galaxies: star clusters1 Introduction
Nuclear star clusters (NCs) are commonly observed in the centres of a range of galaxies; including late type spirals (Böker et al., 2002; Walcher et al., 2005), early type spirals (Carollo et al., 1997) and dwarf ellipticals (Côté et al., 2006). They have typical half light radii of a few parsecs (Geha et al., 2002; Böker et al., 2004; Côté et al., 2006) and masses of M⊙ (Walcher et al., 2005). Further, while late type galaxies tend only to host a NC (Satyapal et al., 2009), some more massive galaxies host both a supermassive black hole (SMBH) and NC (Seth et al., 2008). In fact there appears to be a dichotomy between NCs and SMBHs with the ratio varying from in low mass galaxies ( M⊙) to in high mass galaxies ( M⊙) with some overlap in between (Graham & Spitler, 2009).
Like SMBHs, NC properties are found to scale with the properties of host galaxy bulge. Ferrarese et al. (2006) observed that NC masses scale with bulge velocity dispersion as,
| (1) |
The similarity of Eq 1 to the relation for SMBHs have led some (e.g. McLaughlin et al., 2006) to speculate an origin driven by a common process (e.g. King, 2005; Murray et al., 2005) – mass growth self-regulated by means of feedback. However, although this picture is physically compelling for reasons we describe below, it is important to note that it is (1) deduced from analytical arguments drawing on idealised assumptions, which are likely to break down when more realistic assumptions are made (e.g. Nayakshin & Power, 2010; Bourne et al., 2014), and (2) difficult to reconcile with recent studies (e.g. Graham, 2012; Leigh et al., 2012; Scott & Graham, 2013), which suggest that the logarithmic slope of Eq 1 may be shallower () than that found by Ferrarese et al. (2006).
In this Letter, we use hydrodynamical simulations to address (1) and to establish the conditions under which the analytical solutions might hold, deferring (2) to future work. For example, McLaughlin et al. (2006) modeled a NC forming from a central gas reservoir in the early stages of its host galaxy’s evolution and regulating its mass by means of momentum-conserving feedback from stellar winds and supernovae (cf. §2), which gives rise naturally to a scaling relation between and of the form given by equation 1. Nayakshin et al. (2009) showed that the dichotomy between NCs and SMBHs can be explained if they co-evolve; in systems with km s-1, the dynamical time is sufficiently short compared to the Salpeter time, the characteristic timecale for black hole growth, that gas accumulates and forms stars preferentially, whereas in systems with km s-1, the dynamical time exceeds the Salpeter time and so SMBH growth is favoured over star formation. Although both of these analytical studies offer an attractive explanation for the origin of NCs and their relationship with SMBHs, they make important simplifying assumptions that do not necessarily hold in more realistic circumstances.
We revisit McLaughlin et al. (2006) and test the validity of the assumption that stellar feedback in the form of winds and supernovae can be treated as emission from a single central point source. Using hydrodynamical simulations of a live NC embedded in the core of a dark matter halo, which we describe in § 3, we compare and contrast results of feedback from both single and multiple sources separately. If feedback is momentum-driven, resolving it as emanating from multiple sources rather than a single source results in a drop in its efficiency, to the extent that it is not clear whether it could regulate NC growth, as we discuss in § 4. Finally, we discuss the significance of this work in § 5, commenting on both its applicability to star cluster formation in general and its implications for the growth of SMBHs in the early Universe.
2 Feedback from nuclear clusters
Here we briefly outline the momentum-feedback model of McLaughlin et al. (2006) that we implement (see also, Silk & Rees, 1998; King, 2003; McQuillin & McLaughlin, 2012). The momentum outflow rate arising from NC feedback is calculated as a fraction of the Eddington rate , i.e.
| (2) |
where is the mass outflow rate from stars, is the wind velocity, is the fraction of momentum flux in terms of the equivalent , is the Eddington luminosity, is the mass of the central massive object (CMO) and is the electron scattering opacity. Taking into account the expected momentum output due to stellar winds and SN II, McLaughlin et al. (2006) found for a Chabrier (2003) initial mass function (IMF).
The equation of motion of the shell of material swept up by an outflow with momentum flux is
| (3) |
where is given by equation 2, and are the shell radius and radial velocity respectively, is the mass of the swept up shell at and is equal to the mass of ambient gas originally enclosed within and is the total mass of material remaining within i.e. any dark matter and stars. Neglecting 111This assumes that . in the 2nd term on the RHS of equation 3, for an isothermal potential the terms on the right hand side of equation 3 balance when
| (4) |
where is the critical mass above which feedback from the NC is able to drive clear the swept up shell of material. Whilst for an isothermal profile one can find a simple analytical solution involving the velocity dispersion of the halo (which is a constant everywhere in this case) a more suitable halo property for non-isothermal halos is the peak circular velocity, . In this case, for large halo masses, tends to (McQuillin & McLaughlin, 2012):
| (5) |
which is analogous to equation 4.
3 Simulation Set-up
Our simulations are run with the SPH code Gadget-3, which has been modified to use the SPHS formulation (Read & Hayfield, 2012), as well as the Wendland C2 kernel (Wendland, 1995; Dehnen & Aly, 2012) with 100 neighbours. Simulations are run in a static Hernquist potential,
| (6) |
where M⊙ and kpc are the total mass and scale radius of the potential respectively. A gaseous component modelled by SPH particles is also included, extending from the centre of the halo to pc. The gas follows the same profile as the halo potential with a gas fraction and is initially in hydrostatic equilibrium. The total gas mass is M⊙ and hence the mass of an SPH particle is M⊙.
We perform two sets of simulations; the first consists of 250 star particles, set up in equilibrium with the background potential out to a radius or pc. The particles follow a Hernquist profile such that , where M⊙ is taken from equation 5. Given that we only model the cluster out to pc, the total mass of star particles in these runs is M⊙ and hence each star particle has a mass of M⊙. The second set of runs are performed with a single star particle at the centre of the potential with a mass of either or .
Feedback is produced by all star particles using a kernel weighted scheme similar to the momentum feedback method of Costa et al. (2014). During a time step of length SPH particles neighbouring a star particle receive a momentum kick of
| (7) |
where is the mass of an SPH particle, is the kernel weight of a SPH particle relative to a star particle, is the star’s smoothing length, calculated over neighbours, and is the gas density at the location of the star. Kicks are directed radially away from star particles.
We perform all simulations with and without radiative cooling, which is included using the optically thin cooling functions of Katz et al. (1996) and Mashchenko et al. (2008) above and below K respectively. While we find this has an effect for the multiple source runs, the impact is negligible in the single source runs. Therefore, for simplicity, all results for single source runs are without radiative cooling. We summarize the four simulations presented in table 1.
| Run | cooling | |||
|---|---|---|---|---|
| S100N | M⊙ | M⊙ | none | |
| S025N | M⊙ | M⊙ | none | |
| M025N | M⊙ | M⊙ | none | |
| M025C | M⊙ | M⊙ | included |
4 Results
4.1 Feedback from a single source
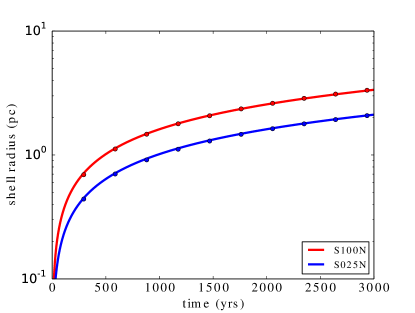
As discussed in section 2, the evolution of a shell of gas swept up by a single source of feedback can be calculated analytically. Assuming a Hernquist background potential, as given in equation 6, we numerically solve equation 3 for a single central source. For simplicity we assume that the gas also follows the Hernquist profile with a gas fraction of . The results are shown by the solid lines in Fig. 1 where the the red and blue lines are for CMO masses of and respectively. In both cases the shell of swept up gas is pushed outwards.
We can compare the analytical solutions to the single source feedback simulations that we have run. The solid points in Fig. 1 show the time evolution of the inner radius of the gas in the S100N and S025N simulations. We can see that they match the analytical solution remarkably well, suggesting that the feedback scheme we have implemented is able to reproduce the analytical solution, at least in the simple, spherically symmetric case. We note that the solution from the simulations also holds if radiative cooling is included.
4.2 Feedback from multiple sources
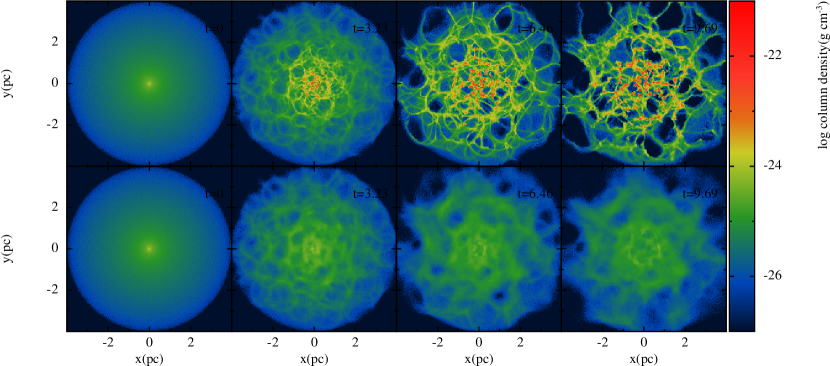
Having validated our feedback scheme in the single source regime, we now consider the effects of using multiple feedback sources. Each source emits feedback at the rate described by equation 7 such that the total momentum injected over the pc region is equal to that produced in our single source runs with . The effect of including multiple feedback sources is evident in Fig. 2, which shows the evolution of gas column density with time – from left to right, at time intervals of kyrs, with the top and bottom rows showing runs with and without radiative cooling respectively.
In both cases a filamentary structure forms as feedback from the multiple sources leads to shells of swept up gas colliding and shocking against each other, resulting in the cancellation of momentum. These results are in stark contrast to the single source regime in which all of the gas is swept up into a well defined outflowing shell.
Also evident is that the inclusion of radiative cooling has an impact on the exact properties of the filaments that form. Gas that is able to cool and radiate away any thermalised energy produced in shocks is much more easily compressed and can reach higher densities. As we show in the next section, this results in the gas being far more resilient to expulsion by the feedback.
4.3 Single versus multiple sources
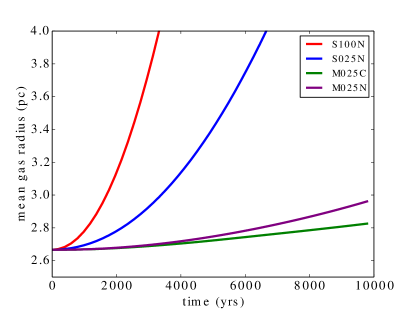
While it is possible to calculate the swept up shell radius in the single feedback source runs, which thus provides a useful diagnostic, this is not possible for the multiple source runs in which there is no well defined shell of gas. This also means that there is no simple analytical solution with which to compare the results of the multiple source runs, as we did for the single source runs in Fig. 1. Therefore, as a proxy for the effectiveness with which the feedback is able to clear out gas we compare the mean radial position of the gas particles for all of the runs over a kyr period. This is shown in Fig. 3, where, as in Fig. 1, the red and blue curves are for the S100N and S025N runs respectively while the green and purple lines are for the M025C and M025N runs respectively.
The single source runs are clearly far more effective at clearing out the gas on a short timescale whilst for the multiple source runs the mean radius increases only slowly with time. We also note that although similar initially, the mean radius for the M025N run becomes larger than the M025C run at later times. As mentioned previously, radiative cooling allows the gas in the M025C runs to be compressed to higher densities which makes it far more resilient to the feedback and hence hard to push out.
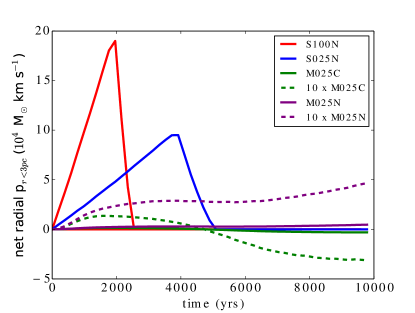
While Fig. 3 hints at the importance of radiative cooling for the multiple source runs, a clearer diagnostic is to consider the net radial momentum of the gas. In order to avoid particles with unphysical velocities caused by boundary effects, in this analysis we only include particles within the central 3 pc. This is plotted in Fig. 4 and shows the difference between the multiple source runs much more clearly. Firstly, however, let us compare the single source runs (red and blue) with the multiple source runs (green and purple). While the net radial momentum grows rapidly for the single source runs, with the swept up shell of gas being accelerated out of the centre of the galaxy, the net radial momentum for the multi-source runs remains very small. Given this we also plot the net radial momentum multiplied by a factor of for the multi-source runs (dashed lines). The cancellation of momentum within the NC itself reduces the overall budget of momentum that could potentially escape the cluster, therefore, despite only simulating the central 4 pc, feedback at larger radii must also be reduced for multiple source runs.
Finally, focussing on the multi-source runs, what is also evident is that when radiative cooling is included the net gas flow becomes negative, however when there is no radiative cooling the gas, in general, is still swept up and pushed out. This illustrates the importance of cooling when considering the efficiency of feedback.
5 Discussion
Simple analytical arguments have been used to suggest that NCs regulate their growth by means of momentum-driven feedback – winds and supernovae – from the stars that they form. In this letter we have assessed the validity of such arguments by using hydrodynamical simulations designed to explore the importance of the assumption that feedback emanates from a single source. By studying the evolution of a shell of gas within a dark matter halo and subjected to stellar feedback from a live star cluster, we have found that feedback from multiple sources is less effective than from a single source at sweeping up and clearing out gas from the central regions of the halo. Feedback from multiple sources seed formation of filamentary structures and high density clumps that are difficult to expel; this effect is accentuated when ambient gas is allowed to cool.
We found that the analytical model of McLaughlin et al. (2006) breaks down when more realistic assumptions are adopted and, consequently, it is unclear whether or not NCs and SMBHs should share similar relations. Indeed it may be that the observed difference between the power law index of for SMBHs and for NCs is a signature of a single source versus multiple sources of feedback, however this is beyond the scope of this work. We further highlight that our results suggest that the model developed by Nayakshin et al. (2009), although physically compelling, needs revision. In that study, NCs grow at the expense of SMBHs in low-mass galaxies by expelling gas efficiently that would otherwise fuel the growth of an SMBH. However, in this study, the efficiency of expulsion is reduced because clumps and filaments form in the gas that are resistant to feedback; these fall back onto the NC and either form new stars or potentially fuel the SMBH. Determining the ultimate fate of these clumps and filaments will form the basis of future work.
Our aim in this letter was to assess how simplifying assumptions made in analytical studies of NC formation and evolution might affect the validity of the predictions. However, we have made some simplifying assumptions of our own, which we briefly consider here. First, as in McLaughlin et al. (2006), we combined all feedback into one continuous injection of momentum at a fraction () of the equivalent Eddington momentum for the stellar population; in reality, the amount of feedback released by a stellar population will be time dependent, with stellar winds dominating the initial feedback phases and SNII becoming more important at later times. This may have the effect of modifying or enhancing the clumpiness and filamentarity within the gas distribution, as a result of spatial inhomogeneities and time dependence of the feedback. We will study this effect in future work that includes self-consistent star formation and stellar lifetimes, although our intuition suggests that it strengthens our conclusions. Second, we included only momentum-driven feedback in our models, but it is likely that energy-driven feedback, especially due to SNII, will also play a role; however, if an inhomogeneous and clumpy ambient medium is able to form, even energy driven feedback can be ineffective at removing the gas from the central regions of the galaxy (e.g., Bourne et al., 2014). Finally we note that our results also complement understanding of globular cluster formation in which multiple stellar populations are expected to form during separate star formation episodes (e.g., Krause et al., 2012; Leigh et al., 2013).
Acknowledgments
We thank the referee for useful comments that helped to improve the clarity of this letter. MAB acknowledges an STFC grant and an STFC research studentship support. CP acknowledges support of ARC Discovery Project DP140100198 and an ARC Future Fellowship ARC FT130100041. This research used the DiRAC Complexity system, operated by the University of Leicester IT Services, which forms part of the STFC DiRAC HPC Facility (www.dirac.ac.uk). This equipment is funded by BIS National E-Infrastructure capital grant ST/K000373/1 and STFC DiRAC Operations grant ST/K0003259/1. DiRAC is part of the UK National E-Infrastructure. Figure 2 was produced using SPLASH (Price, 2007).
References
- Böker et al. (2002) Böker T., Laine S., van der Marel R. P., Sarzi M., Rix H.-W., Ho L. C., Shields J. C., 2002, AJ, 123, 1389
- Böker et al. (2004) Böker T., Sarzi M., McLaughlin D. E., van der Marel R. P., Rix H.-W., Ho L. C., Shields J. C., 2004, AJ, 127, 105
- Bourne et al. (2014) Bourne M. A., Nayakshin S., Hobbs A., 2014, MNRAS, 441, 3055
- Carollo et al. (1997) Carollo C. M., Stiavelli M., de Zeeuw P. T., Mack J., 1997, AJ, 114, 2366
- Chabrier (2003) Chabrier G., 2003, PASP, 115, 763
- Costa et al. (2014) Costa T., Sijacki D., Haehnelt M. G., 2014, MNRAS, 444, 2355
- Côté et al. (2006) Côté P., et al., 2006, ApJS, 165, 57
- Dehnen & Aly (2012) Dehnen W., Aly H., 2012, MNRAS, 425, 1068
- Ferrarese et al. (2006) Ferrarese L., et al., 2006, ApJ, 644, L21
- Geha et al. (2002) Geha M., Guhathakurta P., van der Marel R. P., 2002, AJ, 124, 3073
- Graham (2012) Graham A. W., 2012, MNRAS, 422, 1586
- Graham & Spitler (2009) Graham A. W., Spitler L. R., 2009, MNRAS, 397, 2148
- Katz et al. (1996) Katz N., Weinberg D. H., Hernquist L., 1996, ApJS, 105, 19
- King (2003) King A., 2003, ApJ, 596, L27
- King (2005) King A., 2005, ApJ, 635, L121
- Krause et al. (2012) Krause M., Charbonnel C., Decressin T., Meynet G., Prantzos N., Diehl R., 2012, A&A, 546, L5
- Leigh et al. (2012) Leigh N., Böker T., Knigge C., 2012, MNRAS, 424, 2130
- Leigh et al. (2013) Leigh N. W. C., Böker T., Maccarone T. J., Perets H. B., 2013, MNRAS, 429, 2997
- Mashchenko et al. (2008) Mashchenko S., Wadsley J., Couchman H. M. P., 2008, Science, 319, 174
- McLaughlin et al. (2006) McLaughlin D. E., King A. R., Nayakshin S., 2006, ApJ, 650, L37
- McQuillin & McLaughlin (2012) McQuillin R. C., McLaughlin D. E., 2012, MNRAS, 423, 2162
- Murray et al. (2005) Murray N., Quataert E., Thompson T. A., 2005, ApJ, 618, 569
- Nayakshin & Power (2010) Nayakshin S., Power C., 2010, MNRAS, 402, 789
- Nayakshin et al. (2009) Nayakshin S., Wilkinson M. I., King A., 2009, MNRAS, 398, L54
- Price (2007) Price D. J., 2007, Publ. Astron. Soc. Australia, 24, 159
- Read & Hayfield (2012) Read J. I., Hayfield T., 2012, MNRAS, 422, 3037
- Satyapal et al. (2009) Satyapal S., Böker T., Mcalpine W., Gliozzi M., Abel N. P., Heckman T., 2009, ApJ, 704, 439
- Scott & Graham (2013) Scott N., Graham A. W., 2013, ApJ, 763, 76
- Seth et al. (2008) Seth A., Agüeros M., Lee D., Basu-Zych A., 2008, ApJ, 678, 116
- Silk & Rees (1998) Silk J., Rees M. J., 1998, A&A, 331, L1
- Walcher et al. (2005) Walcher C. J., et al., 2005, ApJ, 618, 237
- Wendland (1995) Wendland H., 1995, Advances in computational Mathematics, 4, 389