Dense Gas Fraction and Star Formation Efficiency Variations in the Antennae Galaxies
Abstract
We use the CARMA millimeter interferometer to map the Antennae Galaxies (NGC 4038/39), tracing the bulk of the molecular gas via the 12CO(1-0) line and denser molecular gas via the high density transitions HCN(1-0), HCO+(1-0), CS(2-1), and HNC(1-0). We detect bright emission from all tracers in both the two nuclei and three locales in the overlap region between the two nuclei. These three overlap region peaks correspond to previously identified “supergiant molecular clouds.” We combine the CARMA data with Herschel infrared (IR) data to compare observational indicators of the star formation efficiency (SFR/HIR/CO), dense gas fraction (HCN/CO), and dense gas star formation efficiency (IR/HCN). Regions within the Antennae show ratios consistent with those seen for entire galaxies, but these ratios vary by up to a factor of 6 within the galaxy. The five detected regions vary strongly in both their integrated intensities and these ratios. The northern nucleus is the brightest region in mm-wave line emission, while the overlap region is the brightest part of the system in the IR. We combine the CARMA and Herschel data with ALMA CO data to report line ratio patterns for each bright point. CO shows a declining spectral line energy distribution, consistent with previous studies. HCO+ (1-0) emission is stronger than HCN (1-0) emission, perhaps indicating either more gas at moderate densities or higher optical depth than is commonly seen in more advanced mergers.
Subject headings:
ISM: molecules — radio lines: galaxies — galaxies: ISM — galaxies: star formation — galaxies: individual (NGC4038/39)1. Introduction
The influence of local physical conditions on how efficiently gas forms stars plays a key role shaping galaxies morphologically, kinematically, and chemically. This has prompted many studies of both the Milky Way and other galaxies aimed at linking the gas abundance and physical properties of the gaseous ISM to the observed star formation rate. Such studies provide key information to understand the physical processes governing star formation on small and large scales and serve as input and the essential point of comparison for simulations on galactic or cosmological scales.
Many of these studies have focused on the relationship between H2 mass, traced by CO emission, and the recent star formation rate (SFR), often traced using, e.g., H, UV or infrared (IR) emission (e.g., Kennicutt, 1998; Bigiel et al., 2008, 2011; Leroy et al., 2008, 2013). Those studies find a basic scaling between the molecular gas traced by CO (typical densities cm-3 and temperatures K) and the SFR. However, in detail there are important variations of the ratio between SFR and CO including more efficient star formation in compact, dense systems (e.g., Daddi et al., 2010; Genzel et al., 2010; García-Burillo et al., 2012), more efficient star formation in galaxy centers (e.g., Leroy et al., 2013), a dependence on local dynamics (Meidt et al., 2013), and large samples revealing global trends with stellar mass and morphology (e.g., Saintonge et al., 2011). The contrast between vigorous starbursts and main sequence galaxies has drawn particular attention (Gao & Solomon, 2004a, b; Kennicutt, 1998), but all of these studies show that physical conditions within the molecular gas change systematically across the universe and that these changes in turn affect the star formation process.
On scales of individual clouds in the Milky Way, stars actually form in a small part of a cloud with the highest surface and volume densities (e.g., Heiderman et al., 2010; Lada et al., 2010). At the distances of other galaxies, this high surface density (A, M⊙ pc-2) gas is best picked out by studying transitions like HCN(1-0) or HCO+(1-0). Due to their higher dipole moments compared to CO, these lines have higher critical densities, around cm-3 compared to cm-3 for CO. Accounting for radiative trapping lowers the critical density for exciting emission, so that these lines are tracers of gas with effective density cm-3. Analogously, observations of higher-J CO lines have been used to trace gas at densities intermediate between that traced by low-J CO emission and high critical density tracers like HCN (Yao et al., 2003; Mao et al., 2010; Ueda et al., 2012; Wilson et al., 2012, and references therein). Focusing on studies comparing emission from high critical density tracers such as HCN to signatures of embedded star formation, these have found a roughly linear correlation that spans from Milky Way cloud cores (Wu et al., 2005, 2010) to the integrated emission from star forming galaxies and (U)LIRGs (Solomon et al., 1992; Gao & Solomon, 2004b), a range of ten orders of magnitude in luminosity. This correlation has been interpreted as entire galaxies and individual dense cloud cores having a fixed SFR per unit dense gas mass, at least on average. In turn, this suggests that a main variation driving the changes in the overall star formation efficiency of H2 may be largely the fraction of the gas mass in this dense phase.
These observations prompt two questions: how does the fraction of gas that is dense depend on the host galaxy and local conditions within an individual galaxy? And is the rate at which stars form from dense gas really constant or does it vary systematically? The former quantity, the fraction of dense gas, is related to the observable intensity ratio . The latter quantity, the star formation efficiency of dense gas, is traced by the ratio. Work by Gao & Solomon (2004b) and García-Burillo et al. (2012) indicate that the dense gas fraction is higher in starburst galaxies. Despite initial indications that the IR-to-HCN ratio was quite constant (see also Zhang et al., 2014), other recent work, including studies by García-Burillo et al. (2012) and Kepley (2014) indicate that this quantity, too, may show important environmental variations (see also Usero et al., accepted).
Much insight can be gained in these topics from resolved observations of galaxies, especially those that host extreme conditions not readily accessible in the Milky Way (e.g., Paglione et al., 1997). With this in mind, this paper presents new Combined Array for Research in Millimeter-wave Astronomy (CARMA) observations of the high effective density transitions HCN(1-0), HCO+(1-0), HNC(1-0), and CS(2-1) and of 12CO(1-0) emission in the Antennae galaxies (NGC 4038/4039). We use these tracers to study dense gas fractions and scaling relations, placing individual regions within this nearest major galaxy merger onto the scaling relations discussed above. The relationships among the various lines also suggest variations in physical conditions from place to place within the Antennae.
The Antennae are the nearest major galaxy merger, at a distance of Mpc (Schweizer et al., 2008). The colliding galaxies exhibit bright CO emission (Stanford et al., 1990; Wilson et al., 2000, 2003; Wei et al., 2012; Ueda et al., 2012; Whitmore et al., 2014) at each of the two nuclei and in the “overlap” region where the two systems are colliding. The collision has led to abundant star formation and numerous young stellar clusters (e.g., Whitmore et al., 1999). The proximity of the galaxies and the extreme environment induced by the galaxy merger make the Antennae an ideal target for spatially resolved dense gas observations. Gao et al. (2001) made a first study of HCN in the Antennae using single-dish observations. These exclude much of the overlap region where most of the star formation takes place, however, and their resolution of 72″ is more than a factor of 10 coarser than that of our new CARMA observations. With improved resolution and a field of view covering the entire system, we are able to study individual regions within the galaxies.
| Region | R.A. | Dec. | Integrated Intensity at HCN Peak | IR Intensity | Notes | ||||||
|---|---|---|---|---|---|---|---|---|---|---|---|
| ID | (J2000) | 12CO | 12CO | 12CO | HCN | HCO+ | CS | HNC | 70 | ||
| (1-0) | (2-1) | (3-2) | (1-0) | (1-0) | (2-1) | (1-0) | |||||
| [K km s-1] | [MJy sr-1] | ||||||||||
| 1 | 12:01:53.03 | -18:52:02.3 | 502.0 | 223.4 | 146.6 | 27.7 | 28.4 | 11.5 | 14.4 | 2799.9 | Northern Nucleus |
| 2 | 12:01:53.32 | -18:53:10.3 | 207.6 | 109.9 | 46.6 | 7.8 | 10.8 | 5.3 | 3.2 | 1049.7 | Southern Nucleus |
| 3 | 12:01:54.93 | -18:53:05.3 | 265.8 | 142.6 | 72.8 | 8.7 | 14.5 | 8.2 | 6.3 | 6034.1 | Overlap, SGMC 4-5 |
| 4 | 12:01:54.80 | -18:52:52.3 | 325.4 | 114.7 | 51.0 | 10.6 | 16.9 | 7.0 | 6.0 | 1779.7 | Overlap, SGMC 2 |
| 5 | 12:01:55.36 | -18:52:46.3 | 239.9 | 88.6 | 50.7 | 9.0 | 17.3 | 7.5 | 6.1 | 3046.4 | Overlap, SGMC 1 |
Note. — All line intensities come from CARMA except for 12CO(2-1) and 12CO(3-2), which we measure from ALMA Science Verification data. The 70m intensity comes from the SHINING Survey with Herschel. SGMC refers to the supergiant molecular complex designation by Wilson et al. (2000). The velocity windows for the 5 regions within which the intensities are integrated are 1450-1750, 1500-1750, 1400-1700, 1350-1700 and 1300-1600 km s-1, respectively.
2. Data
2.1. Observations
We used CARMA to observe HCN(1-0), HCO+(1-0), HNC(1-0) and CS(2-1) emission from the Antennae galaxies during 2011. We observed a 7-point hexagonal mosaic that covered the two nuclei and the overlap region using CARMA’s C and D configurations (16 hr and 26 hr total observing time, respectively). The FWHM of the final synthesized beam is (for ), corresponding to pc at our adopted distance of 22 Mpc. We covered each line with a 250 MHz ( km s-1) wide band that had native channel width of 1.3 MHz (4.3 km s-1), which we smoothed to 8 km s-1 for all subsequent analysis. The 1 sensitivity per channel in the final data cubes at our working resolution of 6.5″(see below) is typically 6 mJy beam-1 (22 mK).
For complex gain and phase calibration, we observed the quasar 1130-148 every min. 3C273 was observed for bandpass calibration. We set the flux scale either by setting the flux of the secondary calibrator based on recent measurements in the CARMA calibrator flux archive (CALFIND111http://carma.astro.umd.edu/cgi-bin/calfind.cgi) or by using planet observations combined with a planetary model. The two approaches yield results consistent within 15%, which we adopt as the uncertainty on the flux scale. The data reduction was carried out using MIRIAD.
To provide a view of the total molecular gas reservoir that complements the high critical density transitions, we observed using CARMA in its C (2009) and D configurations (2011) for a total of 30 hr and 7.5 hr, respectively. The D configuration observations were carried out using the same setup and calibrators that we used for the high critical density transitions. The older C configuration observations used a correlator mode with a channel width of MHz (2.6 km s-1) and a bandwidth of 62 MHz (160 km s-1), with two spectral windows combined to cover the line. The data reduction followed the same procedure described above. The synthesized beam of the combined C+D configuration CO cube is (FWHM), or 300 pc at the distance of the Antennae galaxies. At its native resolution, the resulting cube is roughly a factor of two deeper and higher resolution than the OVRO observations of Wilson et al. (2000, 2003), though the two maps do not cover exactly the same area. The final data cube (at resolution) has a sensitivity (1) of 25 mJy beam-1 (54 mK) in each 5 km s-1 wide channel.
We compare our results to ALMA observations of higher- CO lines and Herschel mapping of the dust continuum. From ALMA, we use science verification observations222http://almascience.eso.org/alma-data/science-verification of and . We performed some additional self-calibration on these data that moderately improved the dynamic range of the images, but this reprocessing does not affect the results of this paper. As an indicator of recent star formation, we use the publicly available Herschel (PACS) 70µm intensity map obtained as part of the SHINING Survey (P.I.: E. Sturm).
We convolve all data sets to a common circular Gaussian beam with a FWHM of 6.5″, 700 pc at the distance of the Antennae. For the Herschel PACS map we use the kernel from Aniano et al. (2011) to convert from the PACS map to a Gaussian PSF. We put all cubes and maps on the astrometric grid of the CARMA HCN data set, which has 1″pixels.
2.2. Measurements
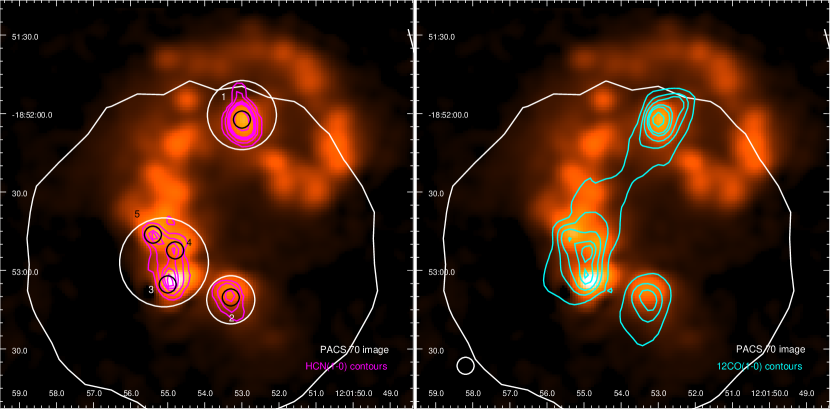
We detect each transition towards both nuclei and the overlap region (see Figure 1 and Table 1). We quantify the line emission in two ways. First, we measure integrated intensities for all lines along lines of sight towards the five bright peaks. Second, we measure the luminosities for individual bright regions, the whole overlap region, and our whole map from integrating data cubes masked to contain only significant emission.
In Table 1 we report integrated intensities for all lines towards the five lines of sight that show the brightest HCN emission. These lines of sight correspond to the two galaxy nuclei and three previously known supergiant molecular clouds in the overlap region. We measure the intensities from the common-resolution data cubes by integrating the line emission, in Kelvins, across a velocity window selected by hand to encompass all bright line emission. Typically this line width is about 300 km s-1. For these measurements, no additional masking is applied beyond the choice of velocity window. For these integrated intensities, we calculate statistical uncertainties of K km s-1 for the 90 GHz lines and K km s-1 for . We also estimate an uncertainty of due to choice of methodology; i.e., choice of integration window and a systematic gain calibration uncertainty of . The Herschel data have a calibration uncertainty of according to the PACS Observer’s Manual. This is almost always larger than the uncertainties due to statistical noise.
We also measure and HCN(1-0) luminosities from masked data cubes and report these values in Table 2. We derive these from integrated intensity maps produced by integrating signal-to-noise masked data cubes along the velocity axis. We produce one three-dimensional mask for the 90 GHz lines and one for CO. To do so, we select regions of the cube that have a signal-to-noise ratio greater than 3.5 (5) for the HCN or HCO+ (CO) over at lease two adjacent velocity channels. We remove small regions (those less than a beam size in volume) because these likely represent statistical fluctuations. We then apply the mask to the cube and integrate to produce a map of integrated intensity. From these integrated intensity maps, we measure the flux summed in several different regions: beam-sized, 6.5″-diameter apertures centered on the HCN peak positions from Table 1; larger circular apertures that encompass the entire northern nucleus, southern nucleus, and overlap region; and a sum over the whole map. Figure 1 shows the apertures and Table 2 reports the aperture positions and sizes and the luminosities derived from the measured fluxes and our adopted distance.
Our interferometer measurements with CARMA may resolve out emission on large spatial scales and the need to mask may cause us to miss low signal to noise emission. To check how much flux we may miss, we compare our luminosities (Table 2) to the single dish measurements presented in Gao et al. (2001). Accounting for differences in the adopted distance, we recover about 70% and 50% of the total 12CO(1-0) and HCN(1-0) luminosity, respectively, found by Gao et al. (2001). Note that the Gao et al. (2001) CO observations cover the entire system and thus a significantly larger area compared to our map (see their Figure 2); from earlier work, we know that a significant amount of CO emission arises from the northern arm that is not included in our coverage. The flux in our CARMA CO map is about higher than the integrated result from the earlier OVRO (interferometer) work by Wilson et al. (2003). Overall, missing flux does not appear to be an enormous concern for the CO.
For the HCN, the amount of flux missed is less clear: the discrepancy with the single dish result reflects some combination of calibration uncertainties in both telescopes, statistical noise in the Gao et al. (2001) measurement, the limited coverage of our map, and flux missed due to the need to clip the data based on signal-to-noise. There is not a strong reason to expect the 90 GHz lines to be more spatially filtered than CO; they were observed with the same two CARMA configurations and to first order the structure of the galaxy should be similar in these two tracers of the molecular gas. The Gao et al. (2001) luminosity is computed from two pointings, one of which would include the northern arm not covered in our observations. Those measurements also have comparatively low signal to noise, as do our own data.
For the most part the faint thermal radio continuum at 90 GHz remains undetected. However, the HCN and HCO+ spectra in region ID 3 do show some hints of thermal continuum emission, though at low-significance. We remove this component during data processing.
3. Results and Discussion
3.1. HCN-Selected Lines-of-Sight
Our observations cover both nuclei and the overlap region and following Wilson et al. (2000, 2003) we detect abundant molecular gas across the galaxies, with concentrations at both nuclei and a large mass of molecular gas in the overlap region. Figure 1 shows our new 12CO(1-0) map in contour. The emission from the overlap region is brightest in three peaks labeled “supergiant molecular complexes” (SGMCs) by Wilson et al. (2000). Figure 1 also shows HCN intensity contours. The faintness of the HCN line compared to CO means that we detect HCN at high signal-to-noise ratio over a smaller area than CO with bright HCN mainly seen in the three SGMCs in the overlap region and the two nuclei. A similar picture emerges for the other high critical density transitions, with high signal-to-noise emission concentrated in these five regions: the two nuclei and three bright complexes in the overlap region (SGMC #1, #2, and #4+5 from Wilson et al., 2000). In Table 1, we report integrated intensities of each of our high critical density lines and IR emission at 70m for each of these five peaks.
| Region | Position | Aperture | Luminosities | |||
|---|---|---|---|---|---|---|
| R.A. | Dec. | Diameter | 12CO(1-0) | HCN(1-0) | TIR | |
| J(2000) | [″] | [107 K km s-1 pc2] | [109 L⊙] | |||
| ID 1 | 12:01:53.03 | -18:52:02.3 | 6.5 | 16.4 | 0.81 | 2.5 |
| ID 2 | 12:01:53.32 | -18:53:10.3 | 6.5 | 7.5 | 0.19 | 1.1 |
| ID 3 | 12:01:54.93 | -18:53:05.3 | 6.5 | 9.2 | 0.25 | 4.7 |
| ID 4 | 12:01:54.80 | -18:52:52.3 | 6.5 | 11.7 | 0.21 | 1.8 |
| ID 5 | 12:01:55.36 | -18:52:46.3 | 6.5 | 8.0 | 0.18 | 2.5 |
| Nuc. N | 12:01:53.03 | -18:52:00.6 | 26.4 | 79.8 | 2.08 | 8.8 |
| Nuc. S | 12:01:53.32 | -18:53:11.2 | 18.4 | 31.8 | 0.38 | 4.5 |
| Overlap | 12:01:55.10 | -18:52:56.9 | 34.0 | 113.0 | 1.41 | 28 |
| System | 264.8 | 3.87 | 69 | |||
Note. — The total infrared luminosity estimate from 70m intensity follows Galametz et al. (2013). The line luminosities are derived in manually selected apertures from our signal-to-noise masked integrated intensity maps (see Section 2).We use circular, beam-sized apertures for the 5 HCN peaks from Table 1, 3 larger regions covering the nuclei and the overlap region and integrate all emission in our maps to characterize the system as a whole. For this integral in the 70 m map, we only consider emission in the region covered by our CARMA observations (compare Figure 1, left panel). Uncertainties are for integrated line intensities (Section 2) with an additional 10% uncertainty for the distance measurement (Schweizer et al., 2008) which should be taken into account (implying a 20% uncertainty on any luminosity).
From Figure 1 and Table 1 we see that the northern nucleus (ID 1, NGC 4038) is the brightest region in all molecular lines, though not in infrared intensity. The southern nucleus (ID 2, NGC 4039) is one of the two faintest regions in each tracer. Note that Brandl et al. (2009) do not detect signatures of AGN activity in either nucleus based on mid-IR spectroscopy so we do not expect AGN activity to account for a significant amount of the IR or dense gas emission appearing from the nuclei. Meanwhile, the brightest IR regions in the galaxy are not at either nucleus, but in the overlap region, where the emission is dominated by young stellar populations and active star formation (e.g., Whitmore et al., 1999, determine the ages of massive clusters in this region to be a few Myr) and kinematic signatures indicate possible collisions between massive clouds and infalling gas (regions D and E in Wei et al., 2012). Our region # 3, Wilson et al. (2000) SGMC # 4-5, is the brightest IR source. In this region, the IR luminosity (and so the implied SFR) approaches the value for the entire Milky Way but compressed into a roughly kpc-sized region (Vigroux et al., 1996; Brandl et al., 2009; Klaas et al., 2010). A lack of detected X-ray emission and low radio continuum-to-IR ratios (Klaas et al., 2010, and references therein), detected water maser emission (Brogan et al., 2010), and low cluster ages (e.g., Zhang et al., 2010) all argue for this region #3 being a young structure.
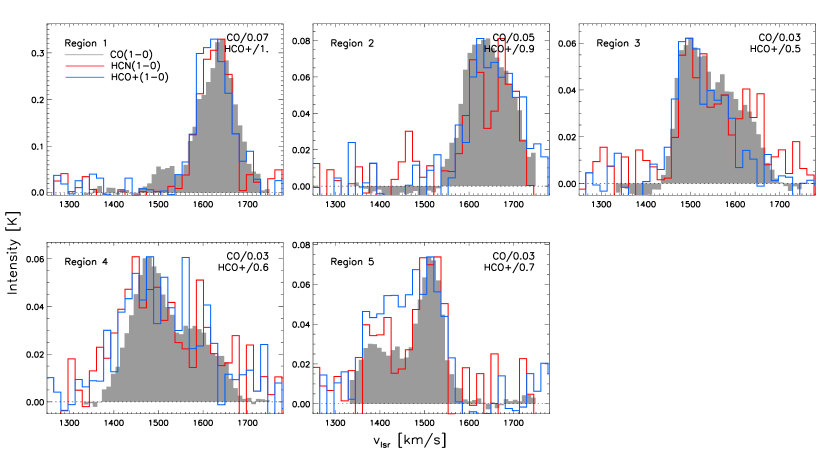
Figure 2 compares the line profiles for the bulk gas tracer 12CO(1-0) and the dense gas tracers HCN(1-0) and HCO+(1-0). We scale the CO and HCO+ by a factor chosen to match the peak of the HCN spectrum and bin the spectra to a velocity resolution of 16 (HCN, HCO+) and 10 km s-1 (CO), respectively, to increase signal-to-noise. If one accounts for the substantially lower signal-to-noise of the HCN, the spectral profiles mostly agree between the three lines, suggesting that for the most part dense gas and the bulk of the molecular medium are well mixed in the different regions. There are a few notable exceptions, however; the low velocity weaker component seen in CO towards the northern nucleus (first panel) does not appear to have a counterpart in HCN or HCO+, suggesting that perhaps this component is less dense than the gas giving rise to the main line. In the overlap region, our Region 5 also shows some variation between spectral components, with HCO+ and HCN brighter relative to CO in the low velocity component. Throughout the overlap region, HCO+ emission is observed to be stronger relative to HCN, which is discussed in Section 3.3, where we focus on molecular line ratio variations.
3.2. Luminosity Ratios, Dense Gas Fractions, and the Star Formation Efficiency of Dense Gas
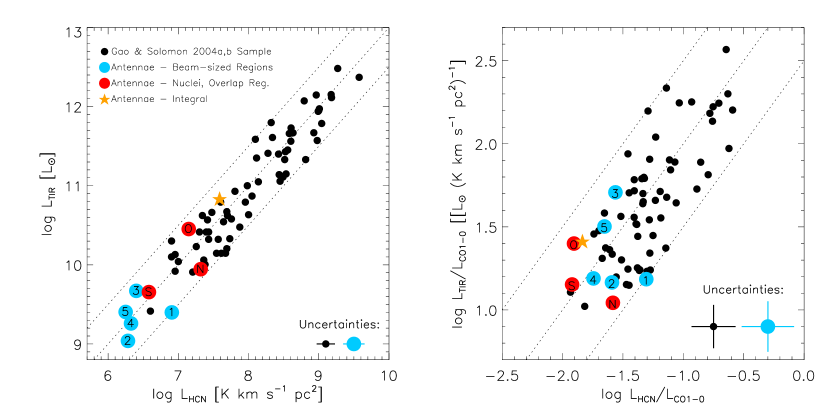
A main motivation for studying the high effective density lines are studies showing repeatedly a good overall correlation between IR luminosity and the luminosity of high effective density tracers. Emission from these tracers is presumed to trace the amount of dense gas (following Solomon et al., 1992; Gao & Solomon, 2004b; Wu et al., 2005, 2010; Juneau et al., 2009; García-Burillo et al., 2012) while IR luminosity indicates the amount of recent star formation. In the left panel of Figure 3 we compare our measurements to the 65 (U)LIRGS and spiral galaxies from Gao & Solomon (2004b) (black points). We plot our measurements of the Antennae in three different (non-independent), ways as defined in Section 2 and reported in Table 2. First, we show the luminosities for beam-sized regions centered on the HCN-selected lines-of-sight in blue (with regions labelled following Tables 1 and 2). In red, we show luminosities for the entire northern and southern nucleus as well as the entire overlap region (labeled “N”, “S” and “O”, respectively). Finally, in yellow we show the luminosity integrated over the whole part of the system that we observe.
The left panel of Figure 3 shows that our resolved measurements for individual regions extend the observed trend from Gao & Solomon (2004b) towards lower luminosities. The dotted lines in the left panel of the Figure have a unity slope and indicate a factor of 3 scatter. The error bars represent an uncertainty of 35% for our line luminosities, reflecting mostly gain (calibration) and methodology (see Section 2 and Table 2). We stress that in particular calibration uncertainties are strongly correlated, i.e., changes would affect all Antennae points in the same way. We adopt 30% as the typical value for the Gao & Solomon (2004a) sample as quoted in their paper. We ignore the small uncertainty on the TIR luminosity as well as the correlated distance uncertainty; changing the distance would move all data points collectively along the dotted lines. Large regions of the Antennae galaxies populate this figure in regimes between entire galaxies and individual clouds. In this sense, our results resemble recent results mapping individual galaxies (Kepley, 2014, Bigiel et al. in prep.), integrating whole galaxies (García-Burillo et al., 2012) and sampling parts of galaxy disks (Usero et al., accepted). In each of these cases, the relationship between HCN (or HCO+) and infrared luminosities at intermediate scales extends the relationship found for starbursts and bright whole galaxies (though we caution that the luminosity of a part of a galaxy is a somewhat arbitrary quantity).
Data like those in the left panel have motivated the idea that the mass fraction of dense gas drives the overall star formation efficiency of molecular gas, with star formation in dense gas as a fairly universal process (e.g., Gao & Solomon, 2004b; Lada et al., 2010). A simple way to explore this hypothesis is to plot the observed ratio of IR-to-CO luminosity as a function of HCN-to-CO luminosity. The IR-to-CO ratio should, for dense systems, trace the efficiency with which the bulk molecular gas is converted to stars while the ratio of HCN-to-CO emission offers an observational tracer of the fraction of gas mass in a dense phase.
We re-plot the data in this space in the right panel of Figure 3. Gao & Solomon (2004b) found that the HCN-IR correlation remains approximately linear while the IR-to-CO ratio increases as one moves from fainter to brighter systems. The resulting correlation in IR-to-CO vs. HCN-to-CO space appears in the black points. However, just as striking as the existence of both correlations is the large scatter in both plots. Though in the right panel, HCN-to-CO coarsely predicts the IR-to-CO ratio, there is scatter of about a factor of 3 about a constant IR-to-HCN ratio (indicated by the dotted lines). If there were simply a fixed dense gas star formation efficiency with the two quantities simply traced by IR and HCN emission, then the data would follow a diagonal line in this plot. This is clearly not the case. Despite the small number of independent regions in the Antennae, this already appears in our new data, which show a scatter comparable to the Gao & Solomon (2004b) data set. Within our small Antennae sample, knowing HCN-to-CO would not have helped to predict the IR-to-CO ratio, which traces the rate at which the bulk molecular gas forms stars.
We can also attempt to recast the observed IR, CO, and HCN emission into more physical quantities with the caveat that such conversions come with substantial uncertainty. To estimate approximate physical values for the total and dense molecular gas mass and star formation rate, we adopt (Gao & Solomon, 2004b), a Galactic M⊙ (K km s-1 pc2)-1, and the TIR-to-star formation rate conversion of Murphy et al. (2011). We note that the TIR-to-star formation rate conversion depends on the SF time scales and history and for very recent star formation the underlying assumption of continuous star formation over Myr time scales introduces substantial additional uncertainty. Using these conversions, however, the dense gas depletion time () is 40 Myr for the entire (observed) system, in excellent agreement with the value from Gao et al. (2001). For the northern, southern nucleus and overlap region separately, 160, 60 and 36 Myr, respectively. The depletion times for the CO-traced bulk molecular gas are 1.1 Gyr for the entire system, and 2.6, 2.1 and 1.2 Gyr, respectively, for the sub-regions.
The HCN-to-CO luminosity ratio shows substantial variation across the local galaxy population, ranging from a few percent to several tens of percent, (e.g., Sorai et al., 2002; Gao & Solomon, 2004b, Usero et al. accepted, and references therein). In the Antennae, we derive to be of the order of a few percent: for the system as a whole, for the northern nucleus, and around for the overlap region and the southern nucleus. Adopting the conversion factors above, the dense gas fractions by mass would be about twice these values, for the system as a whole. As pointed out by Gao et al. (2001), this is a rather small dense gas fraction compared to what would be inferred for (U)LIRGs, which often show HCN-to-CO luminosity ratios and dense gas mass fractions (see also Baan et al., 2008). Instead, this dense gas mass fraction is similar to that seen in Milky Way clouds (e.g. Evans & Lada, 1991; Lada et al., 2010). This argues that, perhaps surprisingly, the high turbulent pressure in the Antennae has not dramatically changed the dense gas fraction in the molecular gas (see discussion in Wilson et al., 2003). Here we extend this observation from a statement about the whole system to observations of individual regions within the Antennae galaxies.
The picture presented by these luminosity ratios reinforces that although the Antennae are rich in gas, the overlap region holding most of the gas may not yet be overwhelmingly dense. Meanwhile, the two nuclei show starkly different behavior. And perhaps surprisingly, although dense gas and star formation traced by IR emission are clearly correlated, knowing the luminosity of line emission from dense gas does not perfectly indicate the recent star formation rate as traced by IR emission. Natural explanations for this lack of correspondence between IR/CO and HCN/CO would be strong variations in the ratio of HCN emission to dense, immediately star-forming gas mass (e.g., due to optical depth or temperature effects), evolutionary effects with current HCN emission indicating future star formation but only poorly indicating of where stars have already formed, or real variations in the ability of dense gas to form stars.
3.3. Ratios Among Molecular Transitions
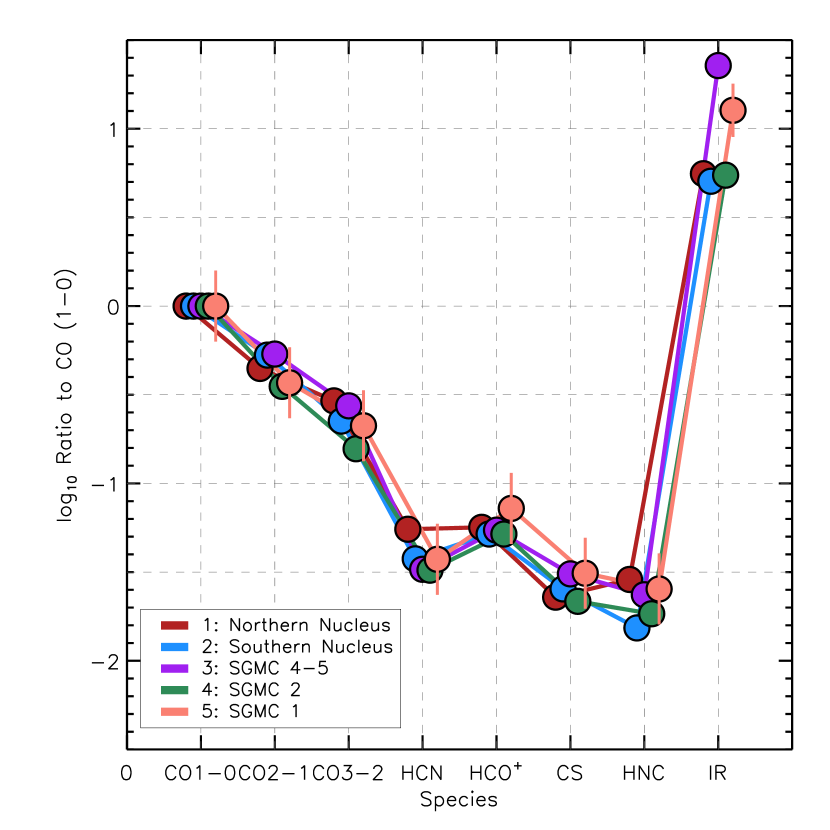
We have so far considered 12CO(1-0) as a tracer of bulk gas and HCN(1-0) as a tracer of dense gas. We observe a suite of lines with high effective densities, HCO+(1-0), CS(2-1), HNC(1-0). As part of its science verification program, ALMA has observed CO(3-2) and CO(2-1) emission from the Antennae galaxies. Table 1 and Figure 4 show the ratios among the integrated line intensities for these transitions, normalizing all measurements to CO(1-0). We plot one set of ratios for each region. The plotted errors (only shown for one set of measurements) assume a 35% uncertainty on each individual integrated intensity measurement (see Section 2 for details), though we again emphasize that these uncertainties are strongly correlated. We also caution that these ratios, in particular between ALMA and CARMA data, come with caveats due to different coverage and because they arise from interferometer-only data (see discussion in Section 2). Nonetheless some basic results are clear, with all measurements showing broadly similar line ratio patterns. CO emission (in K) declines from (1-0) to (2-1) to (3-2). The four high critical density tracers, HCN (1-0), HCO+ (2-1), CS (2-1), and HNC (1-0) are all fainter, by more than an order of magnitude compared to CO (1-0) with the ordering usually HCO+ (1-0) HCN (1-0) CS (1-0) HNC (1-0).
Our observed CO(3-2)/(1-0) ratio of and CO(2-1)/(1-0) ratio of could be reproduced (within ) either by cool, dense gas, in which the source function does not match the Rayleigh-Jeans approximation even at 230 and 345 GHz. Alternatively, they could be produced from hotter gas that has low enough density to sub-thermally excite the lines. With only the low- 12CO lines, these scenarios cannot be readily distinguished and a covariant set of densities and temperatures can reasonably reproduce our observed values in a one-zone model like RADEX (van der Tak et al., 2007). In fact, a combination of multiple physical conditions within the beam is almost certain (see Sliwa et al., 2012; Schirm et al., 2014, for more discussion). Indeed this would be required to simultaneously model both our high critical density lines and the CO emission; however, with only a single line per high-dipole species, this modeling introduces a free parameter (the abundance) for each new observation and does not yield significant insight.
As discussed above, the CO line ratios should be treated with some caution because the data come from different telescopes with different coverage. Indeed, the CO(3-2) / (1-0) ratio found here is much lower than that reported from single dish data by Zhu et al. (2003). They found ratios near unity in the nuclei and varying with star formation activity level across the overlap region. Different spatial filtering or calibration differences between CARMA and ALMA might account for some of the discrepancy. The required sense is that the ALMA data recover a smaller fraction of the true CO flux than CARMA. Although ALMA is the more sensitive telescope and higher- CO emission might be more clumpy, the spatial filtering from ALMA is more severe. Some differential spatial filtering is certainly to be expected; the minimum projected baseline length for CARMA is while for ALMA it is for CO (2-1) and for CO (3-2). These correspond to maximum recoverable spatial scales of , and for CO (1-0), (2-1), and (3-2), respectively. However, spatial filtering occurs only in a single velocity channel and Figure 1 shows that the CO (1-0) and IR emission are already clumpy and concentrated towards the compact nuclei and the SGMCs, so we do not expect this effect to be severe. Indeed, after carefully matching coverage between SMA and OVRO data, Ueda et al. (2012) also find CO(3-2)/(1-0) ratios significantly less than reported by Zhu et al. (2003). They find CO (3-2) / CO (1-0) ratios of 0.3–0.6 for essentially the same five regions considered here; we find . Though clearly uncertain, our analysis supports the results of Ueda et al. (2012) and argues that the bulk of the gas in the Antennae is either cool or sub-thermally excited.
The ratios among the high effective density molecules are less systematically uncertain because they all come from one set of CARMA observations. These show that although we have discussed HCN (1-0) for ease of comparison to the literature, the HCO+ (1-0) line is in fact brighter than HCN (1-0) across the Antennae. In this regard, the overlap region resembles M82 (Baan et al., 2008; Kepley, 2014) but is weaker in HCN than is typical in the larger () sample of FIR-luminous galaxies studied by Baan et al. (2008). Compared to the Baan et al. (2008) sample, the Antennae have a typical HCO+/CO(1-0) ratio of 0.06 but the Antennae ratios of HCN/CO(1-0) and HNC/CO(1-0) are lower than average. The typical values of these ratios from Baan et al. (2008) are 0.06 and 0.04 (excluding their upper limits).
If the abundances of HCO+ and HCN are taken to be the same throughout the Antennae and the Baan et al. (2008) sample, the easiest interpretation of the stronger HCO+ emission is that the dense gas in the Antennae is less dense, on average, than in a typical FIR-luminous galaxy, where HCN (1-0) HCO+ (1-0). Alternatively, differences in optical depth, which change the effective density at which the gas emits, might interact with the distribution of densities to produce stronger HCO+ emission. Though without a functional form for the density distribution, the sense of optical depth effects is hard to quantify. Including abundance variations, there is an extensive literature on the drivers of the HCO+-to-HCN line ratio (Kohno et al., 2007; Graciá-Carpio et al., 2008; Krips et al., 2008; Baan et al., 2008). Though these differ in detail, the overall sense is that HCN emission may be enhanced relative to HCO+ in the most active systems. For example, the abundance of HCO+ may be additionally suppressed by recombination at high densities (Papadopoulos, 2007; Meier et al., 2014). In this sense, the observation of strong HCO+ relative to HCN in the Antennae galaxies makes sense; the Antennae are extended and have low SFR-to-CO compared to more active systems (see above and Gao et al., 2001). Indeed, the brightest HCN emission comes from the compact, active northern nucleus, where the two lines have about the same intensity. So this trend may play out within the Antennae as well as between the Antennae and other systems.
4. Summary
We report new CARMA observations of a suite of molecular lines in the Antennae galaxies, including the high effective density transitions HCN(1-0), HCO+(1-0), CS(2-1), and HNC(1-0) and the bulk molecular gas tracer 12CO(1-0). We combine these with Herschel infrared observations and ALMA science verification observations of 12CO(2-1) and 12CO(3-2) to report on conditions within the molecular gas and the apparent relationship between dense molecular gas, the total amount of molecular gas, and embedded star formation traced by infrared emission. We find substantial variations in the observed ratios IR/CO, IR/HCN, and HCN/CO across the galaxy. These variations have magnitude comparable to the scatter seen over the whole galaxy population. These measurements agree with other recent studies and highlight either substantial evolutionary effects or systematic differences in the local physical conditions in the molecular gas and its link to star formation. Comparing different molecular transitions, we find HCO+ (1-0) to be almost twice as strong as HCN (1-0) in the overlap region, perhaps indicative of a large amount of intermediate density gas.
Acknowledgments
We thank Christine Wilson and Fabian Walter for helpful discussions and feedback on the draft, Ulrich Klaas for assistance with the PACS data, and the referee for constructive comments that improved the draft. FB acknowledges support from DFG grant BI 1546/1-1. ER is supported by a Discovery Grant from NSERC of Canada. AU acknowledges support from Spanish MINECO grants AYA2012-32295 and FIS2012-32096. Support for CARMA construction was derived from the states of California, Illinois, and Maryland, the James S. McDonnell Foundation, the Gordon and Betty Moore Foundation, the Kenneth T. and Eileen L. Norris Foundation, the University of Chicago, the Associates of the California Institute of Technology, and the National Science Foundation. Ongoing CARMA development and operations are supported by the National Science Foundation under a cooperative agreement, and by the CARMA partner universities. This paper makes use of the following ALMA data: ADS/JAO.ALMA#2011.0.00003.SV. ALMA is a partnership of ESO (representing its member states), NSF (USA) and NINS (Japan), together with NRC (Canada) and NSC and ASIAA (Taiwan), in cooperation with the Republic of Chile. The Joint ALMA Observatory is operated by ESO, AUI/NRAO and NAOJ. The National Radio Astronomy Observatory is a facility of the National Science Foundation operated under cooperative agreement by Associated Universities, Inc..
References
- Aniano et al. (2011) Aniano, G., Draine, B. T., Gordon, K. D., & Sandstrom, K. 2011, PASP, 123, 1218
- Baan et al. (2008) Baan, W. A., Henkel, C., Loenen, A. F., Baudry, A., & Wiklind, T. 2008, A&A, 477, 747
- Bigiel et al. (2008) Bigiel, F., Leroy, A., Walter, F., Brinks, E., de Blok, W. J. G., Madore, B., & Thornley, M. D. 2008, AJ, 136, 2846
- Bigiel et al. (2011) Bigiel, F., Leroy, A. K., Walter, F., et al. 2011, ApJ, 730, L13
- Brandl et al. (2009) Brandl, B. R., Snijders, L., den Brok, M., et al. 2009, ApJ, 699, 1982
- Brogan et al. (2010) Brogan, C., Johnson, K., & Darling, J. 2010, ApJ, 716, L51
- Daddi et al. (2010) Daddi, E., Elbaz, D., Walter, F., et al. 2010, ApJ, 714, L118
- Evans & Lada (1991) Evans, N. J., II, & Lada, E. A. 1991, Fragmentation of Molecular Clouds and Star Formation, 147, 293
- Galametz et al. (2013) Galametz, M., Kennicutt, R. C., Calzetti, D., et al. 2013, MNRAS, 431, 1956
- Gao et al. (2001) Gao, Y., Lo, K. Y., Lee, S.-W., & Lee, T.-H. 2001, ApJ, 548, 172
- Gao & Solomon (2004a) Gao, Y., & Solomon, P. M. 2004, ApJS, 152, 63
- Gao & Solomon (2004b) Gao, Y., & Solomon, P. M. 2004, ApJ, 606, 271
- García-Burillo et al. (2012) García-Burillo, S., Usero, A., Alonso-Herrero, A., et al. 2012, A&A, 539, A8
- Genzel et al. (2010) Genzel, R., Tacconi, L. J., Gracia-Carpio, J., et al. 2010, MNRAS, 407, 2091
- Graciá-Carpio et al. (2008) Graciá-Carpio, J., García-Burillo, S., Planesas, P., Fuente, A., & Usero, A. 2008, A&A, 479, 703
- Heiderman et al. (2010) Heiderman, A., Evans, N. J., II, Allen, L. E., Huard, T., & Heyer, M. 2010, ApJ, 723, 1019
- Juneau et al. (2009) Juneau, S., Narayanan, D. T., Moustakas, J., et al. 2009, ApJ, 707, 1217
- Kennicutt (1998) Kennicutt, R. C., Jr. 1998, ApJ, 498, 541
- Kepley (2014) Kepley, A. A., Leroy, A. K., Frayer, D., et al. 2014, ApJ, 780, L13
- Klaas et al. (2010) Klaas, U., Nielbock, M., Haas, M., Krause, O., & Schreiber, J. 2010, A&A, 518, L44
- Kohno et al. (2007) Kohno, K., Nakanishi, K., & Imanishi, M. 2007, The Central Engine of Active Galactic Nuclei, 373, 647
- Krips et al. (2008) Krips, M., Neri, R., García-Burillo, S., et al. 2008, ApJ, 677, 262
- Lada et al. (2010) Lada, C. J., Lombardi, M., & Alves, J. F. 2010, ApJ, 724, 687
- Leroy et al. (2008) Leroy, A. K., Walter, F., Brinks, E., et al. 2008, AJ, 136, 2782
- Leroy et al. (2013) Leroy, A. K., Walter, F., Sandstrom, K., et al. 2013, AJ, 146, 19
- Mao et al. (2010) Mao, R.-Q., Schulz, A., Henkel, C., et al. 2010, ApJ, 724, 1336
- Meidt et al. (2013) Meidt, S. E., Schinnerer, E., García-Burillo, S., et al. 2013, ApJ, 779, 45
- Meier et al. (2014) Meier, D. S., Turner, J. L., & Beck, S. C. 2014, ApJ, 795, 107
- Murphy et al. (2011) Murphy, E. J., Condon, J. J., Schinnerer, E., et al. 2011, ApJ, 737, 67
- Paglione et al. (1997) Paglione, T. A. D., Jackson, J. M., & Ishizuki, S. 1997, ApJ, 484, 656
- Papadopoulos (2007) Papadopoulos, P. P. 2007, ApJ, 656, 792
- Saintonge et al. (2011) Saintonge, A., Kauffmann, G., Wang, J., et al. 2011, MNRAS, 415, 61
- Schilke et al. (1992) Schilke, P., Walmsley, C. M., Pineau Des Forets, G., et al. 1992, A&A, 256, 595
- Schirm et al. (2014) Schirm, M. R. P., Wilson, C. D., Parkin, T. J., et al. 2014, ApJ, 781, 101
- Schweizer et al. (2008) Schweizer, F., Burns, C. R., Madore, B. F., et al. 2008, AJ, 136, 1482
- Sliwa et al. (2012) Sliwa, K., Wilson, C. D., Petitpas, G. R., et al. 2012, ApJ, 753, 46
- Solomon et al. (1992) Solomon, P. M., Downes, D., & Radford, S. J. E. 1992, ApJ, 387, L55
- Sorai et al. (2002) Sorai, K., Nakai, N., Kuno, N., & Nishiyama, K. 2002, PASJ, 54, 179
- Stanford et al. (1990) Stanford, S. A., Sargent, A. I., Sanders, D. B., & Scoville, N. Z. 1990, ApJ, 349, 492
- Ueda et al. (2012) Ueda, J., Iono, D., Petitpas, G., et al. 2012, ApJ, 745, 65
- van der Tak et al. (2007) van der Tak, F. F. S., Black, J. H., Schöier, F. L., Jansen, D. J., & van Dishoeck, E. F. 2007, A&A, 468, 627
- Vigroux et al. (1996) Vigroux, L., Mirabel, F., Altieri, B., et al. 1996, A&A, 315, L93
- Wei et al. (2012) Wei, L. H., Keto, E., & Ho, L. C. 2012, ApJ, 750, 136
- Whitmore et al. (1999) Whitmore, B. C., Zhang, Q., Leitherer, C., et al. 1999, AJ, 118, 1551
- Whitmore et al. (2010) Whitmore, B. C., Chandar, R., Schweizer, F., et al. 2010, AJ, 140, 75
- Whitmore et al. (2014) Whitmore, B. C., Brogan, C., Chandar, R., et al. 2014, ApJ, 795, 156
- Wilson et al. (2000) Wilson, C. D., Scoville, N., Madden, S. C., & Charmandaris, V. 2000, ApJ, 542, 120
- Wilson et al. (2003) Wilson, C. D., Scoville, N., Madden, S. C., & Charmandaris, V. 2003, ApJ, 599, 1049
- Wilson et al. (2012) Wilson, C. D., Warren, B. E., Israel, F. P., et al. 2012, MNRAS, 424, 3050
- Wu et al. (2005) Wu, J., Evans, N. J., II, Gao, Y., et al. 2005, ApJ, 635, L173
- Wu et al. (2010) Wu, J., Evans, N. J., II, Shirley, Y. L., & Knez, C. 2010, ApJS, 188, 313
- Yao et al. (2003) Yao, L., Seaquist, E. R., Kuno, N., & Dunne, L. 2003, ApJ, 588, 771
- Zhang et al. (2010) Zhang, H.-X., Gao, Y., & Kong, X. 2010, MNRAS, 401, 1839
- Zhang et al. (2014) Zhang, Z.-Y., Gao, Y., Henkel, C., et al. 2014, ApJ, 784, LL31
- Zhu et al. (2003) Zhu, M., Seaquist, E. R., & Kuno, N. 2003, ApJ, 588, 243