Testing the Molecular-Hydrogen Kennicutt-Schmidt Law in the Low-Density Environments of Extended Ultraviolet Disk Galaxies
Abstract
Studying star formation beyond the optical radius of galaxies allows us to test empirical relations in extreme conditions with low average gas density and low molecular fraction. Previous studies discovered galaxies with extended ultraviolet (XUV) disks, which often contain star forming regions with lower H-to-far-UV (FUV) flux ratios compared to inner disk star forming regions. However, most previous studies lack measurements of molecular gas, which is presumably the component of the interstellar medium out of which stars form. We analyzed published CO measurements and upper limits for fifteen star forming regions in the XUV or outer disk of three nearby spiral galaxies and a new CO upper limit from the IRAM telescope in one star forming region at in the XUV disk of NGC 4625. We found that the star forming regions are in general consistent with the same molecular-hydrogen Kennicutt-Schmidt law that applies within the optical radius, independent of whether we used H or FUV as the star formation rate (SFR) tracer. However, a number of the CO detections are significantly offset towards higher SFR surface density for their molecular hydrogen surface density. Deeper CO data may enable us to use the presence or absence of molecular gas as an evolutionary probe to break the degeneracy between age and stochastic sampling of the initial mass function as the explanation for the low H-to-FUV flux ratios in XUV disks.
keywords:
galaxies: individual (NGC 4625, NGC 6946, M33, NGC 4414) — galaxies: ISM — galaxies: star formation — H II regions — ISM: molecules1 Introduction
Studies of star formation in nearby galaxies have divided the relationship between the star formation rate (SFR) surface density () and gas surface density (, which includes both atomic and molecular gas) into three regimes, collectively known as the Kennicutt-Schmidt law (; Schmidt, 1959; Kennicutt, 1998; Kennicutt & Evans, 2012). In low density gas (), there is actually little correlation between the total gas and SFR surface density. At somewhat higher densities () where the gas is primarily molecular, the correlation is very good (and is between 0.8 and 1.5), which confirms that stars form from molecular gas (Wong & Blitz, 2002; Bigiel et al., 2008; Rahman et al., 2012; Leroy et al., 2013). Finally, merging and starbursting galaxies at low and high redshift have high gas surface densities () and are offset to higher SFR surface density at a given gas surface density compared to normal star-forming galaxies (Daddi et al., 2010; Genzel et al., 2010; Carilli & Walter, 2013).
Even in the low-density regime where gas is predominately atomic, recent surveys of molecular gas at resolution have the sensitivity to probe the strong correlation between the molecular hydrogen surface density () and the SFR surface density (the molecular-hydrogen Kennicutt-Schmidt law) down to over a large fraction of the optical disk of nearby spiral and dwarf galaxies (Bigiel et al., 2008; Leroy et al., 2009). Schruba et al. (2011) extended the molecular correlation down to by stacking all the CO spectra in rings. This surface brightness limit allowed the authors to study the molecular-hydrogen Kennicutt-Schmidt law out to about the optical radius (, where is the B-band isophotal radius at ).
Studies of star formation beyond the optical radius have primarily concentrated on comparing different star formation tracers. One important discovery was the presence of ultraviolet emission out to four times the optical radius in the disk galaxies M83 and NGC 4625 (Thilker et al., 2005; Gil de Paz et al., 2005). Extended far-UV (FUV) emission indicates the presence of stars with masses greater than and ages less than . These extended ultraviolet (XUV) disks are found in of galaxies out to (Lemonias et al., 2011; Thilker et al., 2007), with a higher fraction in early-type galaxies (39%; Moffett et al., 2012).
Radial profiles of the FUV emission in XUV disks generally decline smoothly out to more than twice the optical radius (Boissier et al., 2007; Goddard et al., 2010) and the emission can be primarily diffuse or structured into distinct regions (Thilker et al., 2007). In H emission, which traces stars that are more massive than and younger than , about half of XUV disks show radial profiles that appear truncated near the optical radius and half have radial profiles that are similar to the FUV profile (Martin & Kennicutt, 2001; Boissier et al., 2007; Goddard et al., 2010). In general, the XUV disk of a galaxy contains a smaller fraction of the total H flux than of the total FUV flux because XUV disks have a lower fraction of star forming regions with H emission compared to the inner disk and the H II regions in XUV disks have lower H-to-FUV flux ratios than the inner disk (Goddard et al., 2010).
Because H and FUV emission generally agree as star formation rate tracers within the optical disk (Bigiel et al., 2008), a number of authors have investigated the origin of the low H-to-FUV flux ratios in XUV disks. Gogarten et al. (2009) and Alberts et al. (2011) performed stellar population synthesis modeling of XUV disk star forming regions with a range of H-to-FUV flux ratios and concluded that age effects alone can explain the low H-to-FUV flux ratios in XUV disks. They measured young ages () for H-bright regions, older ages () for FUV-bright, H-faint regions, and a median age for all the star forming regions of . Goddard et al. (2010) studied H II regions in 21 normal and XUV-disk galaxies and concluded that stochastic sampling of the initial mass function (IMF) can explain the H-to-FUV flux ratios in XUV disks because the H fluxes are consistent with gas ionized by a single O or B0 star (see also Gil de Paz et al., 2007a). Such small numbers of high-mass stars indicate that the clusters may not have fully populated the IMF. Similarly, Koda et al. (2012) concluded that stochastic sampling of the standard Salpeter IMF and aging can explain the number of H- and FUV-bright regions in the XUV disk of M83.
In this paper, we discuss the degeneracy between aging and stochastic sampling of the IMF as the explanation for the low H-to-FUV flux ratios in XUV disks. We use “stochastic sampling of the IMF” to mean the incomplete population of the IMF with the rare massive stars that produce ionizing radiation, as is expected in low-mass star forming regions (e.g., Lee et al., 2009; Goddard et al., 2011; Koda et al., 2012). Two other potential explanations have been presented in the literature: 1) an IMF with a steep or truncated high-mass end (e.g., Hoversten & Glazebrook, 2008; Meurer et al., 2009; Lee et al., 2009), and 2) leakage of ionizing photons out of the star forming region (Elmegreen & Hunter, 2006; Hunter et al., 2013). We will not discuss the steep IMF or leakage of ionizing radiation because these explanations have received less support in the literature compared to aging and stochastic sampling of the IMF (Goddard et al., 2010; Alberts et al., 2011; Koda et al., 2012).
Previous studies of the connection between gas and star formation in XUV disks have primarily focused on atomic gas. Dong et al. (2008) and Barnes et al. (2012) concluded that there is a general correspondence between H I and FUV peaks and that the relationship between the SFR surface density and the H I surface density () is similar to the relationship in the optical disk. A noteworthy exception is the work of Bigiel et al. (2010), which showed a correlation between the SFR surface density and H I surface density in the outer disks of 22 nearby galaxies (not necessarily XUV disks), whereas the optical disk shows no correlation.
Most studies of star formation in XUV disks are missing a fundamental component of the star formation process: molecular gas, which is the component of the interstellar medium (ISM) out of which stars actually form (e.g., Fukui & Kawamura, 2010). There are only four galaxies with molecular gas detections in their outer disks: NGC 4414 (Braine & Herpin, 2004), NGC 6946 (Braine et al., 2007), M33 (Braine et al., 2010), and M63 (Dessauges-Zavadsky et al., 2014). This is likely because the CO surface brightness is low in outer disks and we expect a low covering factor of molecular clouds, given the low covering factor of H II regions and the low molecular cloud counts in the outer disk of the Milky Way (Snell et al., 2002). Dessauges-Zavadsky et al. (2014) were the first to study the molecular-hydrogen Kennicutt-Schmidt law in an XUV disk. The authors used the Institut de Radioastronomie Millimétrique (IRAM) to carry out twelve pointings on a UV-bright complex at a galactic radius of in M63. They detected CO(1–0) in two of the twelve pointings and concluded that the molecular gas in those regions has low star formation efficiency (SFE, i.e., low at a given ) compared to regions in the inner disk.
We present a study of the connection between molecular gas and star formation in four galaxies, three of which have XUV disks. In NGC 4625, we measured a new, deep CO upper limit for a star forming region at . In NGC 6946, M33, and NGC 4414, we studied the fifteen regions with and CO measurements or upper limits from Braine et al. (2007), Braine et al. (2010), and Braine & Herpin (2004), respectively. The goals of the paper are 1) to study star formation in the extreme environment of XUV disks, 2) to determine if the star forming regions are consistent with the same molecular-hydrogen Kennicutt-Schmidt law that applies in the optical disk, and 3) to identify if the presence or absence of molecular gas is consistent with the age of the H II regions as implied by the H-to-FUV flux ratio. The paper is organized as follows. We describe our sample in Section 2. In Section 3, we present new CO observations and also measurements derived from published or archival CO, H, FUV, and data. Section 4 describes the results of placing XUV disk star forming regions on the molecular-hydrogen Kennicutt-Schmidt law and measuring the ages of the regions. Finally, we discuss our results in Section 5.
2 Sample
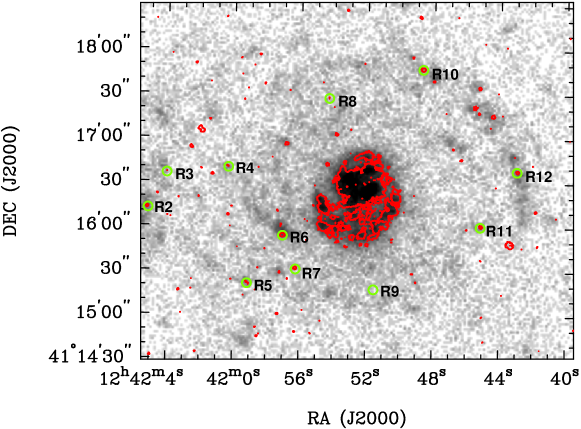
We present a deep upper limit on the molecular gas content in one star forming region in the XUV disk of NGC 4625 (; Schruba et al. 2011; Figure 1). We used the same naming convention as Gil de Paz et al. (2007a) and refer to this region as R2. We selected NGC 4625 because it has good ancillary datasets to trace star formation in the XUV disk and we selected R2 for the CO observations because we hypothesized that the relatively high metallicity (; Gil de Paz et al., 2007a) would enhance the likelihood of a CO detection. We also included six regions in the XUV disk of NGC 6946 (; Schruba et al., 2011), six regions in the outer disk of M33 (; Bonanos et al., 2006), and three regions in the XUV disk of NGC 4414 (; Freedman et al., 2001), all of which have deep CO measurements or upper limits (Braine & Herpin, 2004; Braine et al., 2007, 2010). We refer to the outer disk of NGC 6946 as an XUV disk because the galaxy contains UV emission beyond the optical radius. However, this classification is not as clear as for NGC 4625. Specifically, Holwerda et al. (2012) classified NGC 6946 as not having an XUV disk. M33 does not have an XUV disk classification in the literature. Outer-disk FUV emission is primarily confined to the northern edge of the galaxy at radii less than about . We included it in our study because there are so few detections of molecular gas in outer disks. NGC 4414 has an XUV disk that was identified by Thilker et al. (2007). Finally, we studied ten additional star forming regions in NGC 4625 (R3 - R12) that have shallow upper limits on the CO intensity from the HERACLES survey (Leroy et al., 2009). Table 1 lists the coordinates and galactocentric radii of the regions we studied.
3 Data and Measurements
We used the measurements described in this section for two purposes: to place the XUV disk star forming regions on the molecular-hydrogen Kennicutt-Schmidt law and to measure the ages of the regions. For the Kennicutt-Schmidt law study, we measured molecular hydrogen and SFR surface densities within matched apertures, with the aperture diameter set by the IRAM beam ( at CO(1–0)). Table 1 lists the CO(1–0) and CO(2–1) line intensities, and also the H, FUV, and fluxes or surface brightness values within a 21-diameter circular aperture. To estimate the ages of the star forming regions in NGC 4625 and NGC 6946, we measured the H and FUV fluxes in -diameter circular apertures. We present these values in Table 2.
3.1 IRAM 30 m Data and Molecular Hydrogen Surface Densities
We observed R2 in NGC 4625 at the CO(1–0) and CO(2–1) lines at 115 and 230 GHz on three independent dates (2010 November 19, 2011 March 2/3, and 2011 March 6/7) with the IRAM telescope on Pico Veleta. The total on-source integration time was 6.2 hours. We used the dual polarization receiver EMIR in combination with the autocorrelators WILMA and VESPA. We carried out our analysis with the VESPA data, but we confirmed that the WILMA data are consistent. The frequency resolution was at CO(1–0) (velocity resolution of ) and at CO(2–1) (velocity resolution of ). The observations were carried out in wobbler switching mode with a wobbler throw between and in the azimuthal direction. We chose the amplitude of the wobbler throw to avoid star forming regions within the optical disk of NGC 4625 (and the nearby galaxy NGC 4618) in the off-position.
At the beginning of each observing session the center of NGC 4625 was briefly observed in order to check the frequency tuning and the relative calibration. We found good agreement, with differences no greater than in the velocity integrated intensities between the different observations. The line shape and intensities were in good agreement with those presented in Albrecht et al. (2004).
Pointing was monitored on nearby quasars every 60 – 90 minutes. During the observation period, the weather conditions were generally good and the pointing was better than . The mean system temperatures were at and at on the scale. At (), the IRAM forward efficiency, , was 0.95 (0.91), the beam efficiency, , was 0.77 (0.58), and the half-power beam size is (). We placed all CO spectra and line intensities on the main beam temperature scale (), which is defined as . For the data reduction, we selected observations with good quality (obtained during satisfactory weather conditions and showing a flat baseline), averaged the spectra from individual scans of the source, and subtracted a constant continuum level.
Figure 2 shows the CO(1–0) and CO(2–1) spectra of R2 in NGC 4625. We did not detect emission in either transition. We calculated a 3 upper limit on the CO(1–0) and CO(2–1) line intensities with , where is the noise in the spectrum, is the spectrum channel width, and is the line width, which we assumed to be to agree with Braine et al. (2007). We measured an rms noise of with a channel width of at CO(1–0) and with a channel width of at CO(2–1).

For R4-R12 in NGC 4625, we calculated a shallow upper limit for the CO(2–1) line intensity by measuring the standard deviation of the average surface brightness in about ten emission-free regions in the HERACLES CO(2–1) integrated intensity map (Leroy et al., 2009). We do not quote an upper limit for R3 because it falls outside the HERACLES map. For the star forming regions in NGC 6946, M33, and NGC 4414, we used the deep CO(1–0) line intensities measured with the IRAM telescope by Braine et al. (2007), Braine et al. (2010), and Braine & Herpin (2004), respectively. For the non-detections, Braine et al. (2007) assumed a line width of in calculating the 3 upper limits.
We used the following equation to calculate the molecular hydrogen surface density for the XUV disk star forming regions:
| (1) |
where is the CO(1–0) line intensity in (for R4-R12 in NGC 4625, we assumed ), is the galaxy inclination ( for NGC 4625, for NGC 6946, for M33, and for NGC 4414; Schruba et al., 2011; de Vaucouleurs et al., 1991) and we do not include a correction for He. We estimated that the uncertainty on is , based on the uncertainty due to the rms noise in the spectra and the uncertainty associated with flux calibration at CO(1–0).
Equation 1 assumes the Milky Way CO-to- conversion factor of . Both observations and theory indicate that is metallicity-dependent and increases sharply below , although there are significant differences in the theoretical predictions for the slope of the -metallicity relation at low-metallicity (Wolfire et al., 2010; Glover & Mac Low, 2011; Leroy et al., 2011; Narayanan et al., 2012; Bolatto et al., 2013). We selected the Milky Way CO-to- conversion factor because only two regions with deep CO data have metallicity measurements that we could use to calculate a metallicity-dependent (R2 in NGC 4625 has and P3 in NGC 6946 has ; see Table 2). Furthermore, our choice is supported by the measurements of in NGC 4625 and NGC 6946 by Sandstrom et al. (2013), who exploited the fact that dust traces the total gas column to solve for and the DGR using maps of the H I surface density, the CO integrated intensity, and the dust mass derived from spectral energy distribution fits to Spitzer and Herschel data. The radial profiles of in NGC 4625 and NGC 6946 extend to and , respectively. Sandstrom et al. (2013) concluded that the average in NGC 6946 is . The value is low compared to the Milky Way value mainly because there is a deep depression of in the center of the galaxy. The profile flattens for radii larger than , where for high-confidence regions (with ) is primarily within a factor of two scatter of the Milky Way value. In NGC 4625, Sandstrom et al. (2013) do not quote an average because they have no high-confidence regions. The radial profile has few points and large uncertainties, but there is no clear evidence to support choosing a non-Milky Way value.
3.2 Star Formation Rate Data and Measurements
For NGC 4625 and NGC 6946, we estimated the SFR surface density with hybrid and calibrations. For M33 and NGC 4414, we only calculated the SFR surface density with the calibration because H data was not available from surveys like the Local Volume Legacy Survey (LVL; Kennicutt et al., 2008) or the Spitzer Infrared Nearby Galaxies Survey (SINGS; Kennicutt et al., 2003). We used the calibrations of Leroy et al. (2012):
| (2) |
| (3) |
where , , and are the H, FUV, and surface brightnesses within the -diameter aperture and is the galaxy inclination. and are corrected for Galactic extinction. The SFR calibrations are appropriate for regions containing continuous star formation, which requires -scale regions with in actively star forming galaxies (Leroy et al., 2012). At the distance of NGC 4625, NGC 6946, M33, and NGC 4414, corresponds to , , , and , respectively. While most of the apertures have large physical sizes, star formation is sparse in outer disks and the majority of our apertures contain only one star forming region with . Because we used the Leroy et al. (2012) calibrations in these conditions, evolution of single star forming regions can affect the location on the Kennicutt-Schmidt law (Schruba et al., 2010). We discuss this further in Section 5.
We used the SFR calibrations that are appropriate when the data are not corrected for cirrus emission, which is the contribution to dust heating from non-star forming () stellar populations. We included an uncertainty of on the SFR surface densities to account for the uncertainty due to the cirrus.
The SFRs we calculated based on H data and data are consistent with each other in NGC 4625 and NGC 6946. The Kolmogorov-Smirnov test probability that the SFRs are drawn from the same population is 0.3.
In the following sections, we describe the H, FUV, and flux measurements that we used to calculate the SFR surface density. We also describe measurements of the H and FUV fluxes within a -diameter aperture for NGC 4625 and NGC 6946. We used the -diameter fluxes, corrected for both Galactic and internal extinction, to estimate the ages of the star forming regions. Our age measurement assumes a single stellar population, so we used the smallest aperture possible given the GALEX FWHM (see also Section 4.3).
3.2.1 H
For R2-R12 in NGC 4625, we used the IRAF111IRAF is distributed by the National Optical Astronomy Observatory, which is operated by the Association of Universities for Research in Astronomy (AURA) under cooperative agreement with the National Science Foundation. task phot to measure the H flux from the LVL (Kennicutt et al., 2008) image, which was obtained at the Steward Observatory Bok telescope under seeing conditions of . Kennicutt et al. (2008) removed the stellar continuum (including stellar H absorption) from the image by subtracting a scaled R-band image. Because R2 is on the edge of the image, we measured the flux within a -diameter aperture and used this value as a lower limit for the flux within the -diameter aperture.
We calculated the H fluxes within - and -diameter apertures centered on the Gil de Paz et al. (2007a) regions. We did not subtract a sky background because the median sky value is consistent with zero. We used the formula in the LVL DR5 User’s Guide222http://irsa.ipac.caltech.edu/data/SPITZER/LVL/ LVL_DR5_v5.pdf to convert the flux in counts to . We applied an aperture correction of 1.42 to the fluxes within the -diameter aperture, but applied no aperture correction to the fluxes within the -diameter aperture because the total flux of a point source is contained within that aperture. We corrected for [N II] emission in the image using the [N II] line ratio measured for each region by Gil de Paz et al. (2007a), who used a spectrum obtained with a slit on the Palomar Observatory telescope (for R3, we used the average ratio from the remaining regions). We assumed the theoretical value of [N II] of 0.33 to correct for both [N II] lines (Osterbrock, 1989). For the flux within the -diameter aperture, we corrected for Galactic extinction using values from Schlafly & Finkbeiner (2011) and the O’Donnell (1994) extinction law to calculate the extinction at the effective wavelength of the H filter (), assuming . For the flux within the 6-diameter aperture, we corrected for Galactic plus internal extinction using the E(B-V) values derived in Gil de Paz et al. (2007a) from the Balmer decrement and the O’Donnell (1994) extinction law.
We assigned an uncertainty of 20% to the H fluxes within the - and -diameter apertures. We included an uncertainty of 14% based on the uncertainty quoted for the integrated H+[N II] flux of NGC 4625 in Kennicutt et al. (2008). The primary contribution to this uncertainty is from the continuum removal, but Kennicutt et al. (2008) also included the uncertainty in the flat-fielding and the photometric zero point. We also measured and included a uncertainty due to the large rms of the sky background, and a uncertainty due to the fact that the aperture containing the total point-source flux is uncertain.
For the star forming regions in NGC 6946, we measured the fluxes from an H image obtained by Ferguson et al. (1998b) with the Kitt Peak National Observatory with seeing. Ferguson et al. (1998b) also removed the stellar continuum by subtracting a scaled R-band image. We followed the same flux measurement procedures as for NGC 4625, except for the following differences. First, P4 is not detected and we calculated the 3 upper limit based on the image noise and the area of the aperture. Second, our aperture centering method depended on how we used the fluxes. We used the fluxes within the -diameter aperture for the analysis on the Kennicutt-Schmidt law. The SFR and CO apertures must be matched for this analysis, so we centered the H apertures on the coordinates of the CO measurements from Braine et al. (2007), which are all near H II regions, but not necessarily centered on the H or FUV peak. We used the fluxes within the -diameter aperture to estimate the age of the individual star forming regions. Therefore, we centered on the H peak closest to the Braine et al. (2007) coordinates. This was a clear choice in every case but P7, which has two H peaks within of the Braine et al. (2007) coordinates; we chose the nearest peak.
Third, we applied an aperture correction of 1.19 to the fluxes of the detected regions within the -diameter aperture (again no correction is necessary for the -diameter aperture). Fourth, we applied a single factor of 0.903 to correct for [N II] emission in all the NGC 6946 regions. This factor is based on the measured line intensities for P3 (Region C in Ferguson et al., 1998a). Based on the range of correction factors measured for the eleven NGC 4625 regions in Gil de Paz et al. (2007a) and the expected values from the model of Dopita et al. (2006), this single correction factor is likely correct to within . Finally, we corrected the -diameter fluxes for internal extinction using the values derived from the Muñoz-Mateos et al. (2009) radial profile (see Section 3.2.2) and assuming , where both extinctions refer to the values due to only internal extinction (Calzetti, 2001). This extinction relation includes higher dust obscuration towards the youngest massive stars because older stars have left or destroyed their natal clouds (note that the Cardelli et al. 1989 extinction law for the Milky Way with gives ). The Calzetti (2001) extinction relation was originally calculated for starbursts, but also applies in dwarfs (Lee et al., 2009), and a similar relation applies in M83 (Boissier et al., 2005). Note that this choice of extinction correction affects our results. We discuss this further in Section 4.3.
The uncertainty on the NGC 6946 fluxes that are corrected for Galactic extinction is the same as for the NGC 4625 regions (), even including the additional uncertainty in the [N II] correction. The uncertainty on the fluxes that are corrected for Galactic plus internal extinction is , which accounts for the average uncertainty in the values estimated from the Muñoz-Mateos et al. (2009) radial profile.
The fluxes we calculated within the -diameter aperture are about a factor of two larger than the values presented in Braine et al. (2007). The most likely reasons for the discrepancy are the sky subtraction and the Galactic extinction correction. We chose to include the diffuse H emission in our apertures, which is common in extragalactic star formation studies (e.g., Leroy et al. 2012; but see also, e.g., Blanc et al. 2009). Our fluxes would be 40% smaller if we subtracted the median sky background in an annulus surrounding each aperture. There would be a 20% difference in our fluxes if we had used the Galactic extinction values from Schlegel et al. (1998), albeit in the wrong direction to explain the discrepancy. However, this illustrates the magnitude of discrepancy possible in correcting for Galactic extinction.
3.2.2 GALEX FUV
We measured the FUV fluxes for the star forming regions in NGC 4625, M33, and NGC 4414 from the GALEX Nearby Galaxy Survey (NGS) images from Gil de Paz et al. (2007b). For NGC 6946, we used the NGS image that was processed by the GALEX pipeline. All images are available on the NASA Mikulski Archive for Space Telescopes. The effective wavelength is and the FWHM is . For the detected regions, we used the IRAF task phot to measure the FUV flux within -diameter apertures. For the NGC 4625 and NGC 6946 regions, we also measured the FUV flux within -diameter apertures and we used the same aperture centers as we used for the H measurements (see Section 3.2.1). For M33 and NGC 4414, we centered the apertures on the coordinates of the CO measurements from Braine et al. (2010) and Braine & Herpin (2004), respectively. We subtracted the median sky background from each pixel value. We applied an aperture correction, calculated from point sources in the NGC 6946 image, of 1.72 (1.04) to the fluxes within the () diameter aperture. We corrected for Galactic extinction using the values from Schlafly & Finkbeiner (2011) and the extinction law of Cardelli et al. (1989) with . For the undetected regions in NGC 6946, we quote 3 upper limits, which we calculated using the image noise and the aperture area.
For the -diameter fluxes, we also corrected for the internal FUV extinction (). In NGC 4625, we assumed , where both extinctions are due to only internal extinction (Calzetti, 2001, see also Section 3.2.1). We calculated based on the ratio of the H flux corrected for Galactic and internal extinction (using the values from Gil de Paz et al., 2007a) to the H flux corrected for only Galactic extinction (using from Schlafly & Finkbeiner, 2011). For NGC 6946, we used the Muñoz-Mateos et al. (2009) radial profile for the galaxy, which the authors computed based on the relationship between the internal FUV extinction and the total-IR (TIR)-to-FUV luminosity ratio. We used the results based on the star formation history-independent relationship of Buat et al. (2005) and used a linear interpolation between estimates in the radial profile. Note that the extinction based on a radial average may be an underestimate for star forming regions, which likely have extinctions at the high end of the distribution.
We calculated the fractional uncertainty on the FUV fluxes to be 11% for all fluxes for NGC 4625 and for the NGC 6946, M33, and NGC 4414 fluxes that are corrected for only Galactic extinction. This includes the average uncertainty due to photometric repeatability and photon noise (10%; Morrissey et al., 2007) and an uncertainty in the background level (5%). For the NGC 6946 fluxes that are additionally corrected for internal extinction, we calculated the uncertainty to be 36%. This includes the uncertainties above plus the average uncertainty due to the internal extinction correction based on the Muñoz-Mateos et al. (2009) radial profile (the uncertainty is larger at larger radius and leads to flux uncertainty from 8% - 46%).
3.2.3 Spitzer MIPS
For NGC 4625 and NGC 6946, we measured the surface brightness of each star forming region on Spitzer Space Telescope Multiband Imaging Photometer for Spitzer (MIPS) images from the fifth and final data release of SINGS (Kennicutt et al., 2003). We used the M33 image from LVL (Dale et al., 2009) and the NGC 4414 post-Basic Calibrated Data (PBCD) image available on the NASA/IPAC Infrared Science Archive (PI: G. Fazio).
One region in NGC 4625 (R6) and three regions in NGC 6946 (P7, P2, and P8) are detected. There is a source near NGC 4625 R2, but it is most likely a background galaxy. It is unlikely that the source is a star forming region in NGC 4625 because of the lack of associated emission in the FUV, optical, or H. It is unlikely that it is a foreground star because it does not show point-like NUV emission (Bigiel et al., 2008). The M33 image has significant contamination from foreground and background sources. We compared the , FUV, NUV, and optical images and concluded that the star forming regions are not detected at , although four of the six regions are contaminated by background galaxies or single variable stars in M33 (Hartman et al., 2006). For the non-detections, we used upper limits, which we measured as three times the standard deviation of the average surface brightness in many emission-free regions.
For the detections, we measured the average surface brightness in the -diameter aperture on the original resolution images () with the IRAF task phot. We did not subtract a sky background level for NGC 4625 because the median background value is consistent with zero. The NGC 6946 image has a large-scale, variable background (described in the SINGS fifth data release document333http://irsa.ipac.caltech.edu/data/SPITZER/SINGS/doc/ sings_fifth_delivery_v2.pdf). Therefore, we subtracted the local background level, which we measured in an annulus between and from the center of each region. We measured an aperture correction of 1.19 for the -diameter aperture and applied this correction to the surface brightness measurements. We estimated an uncertainty of 10% on the surface brightness values in NGC 4625 and 20% on the surface brightness values in NGC 6946. These uncertainties include the suggested values from the MIPS Instrument Handbook444http://irsa.ipac.caltech.edu/data/SPITZER/docs/mips/ mipsinstrumenthandbook/ of 4% calibration uncertainty and 5% uncertainty in the aperture correction, as well as an uncertainty due to the sky background, including the uncertainty introduced because of the large-scale, variable background in NGC 6946.

4 Results
4.1 Deep CO Upper Limit at in NGC 4625
Figure 3 shows our 3 upper limit on the CO(2–1) line intensity for R2 at in NGC 4625 (diamond) relative to the radial profile from Schruba et al. (2011). Schruba et al. (2011) achieved a sensitivity of () by stacking the spectra (with -FWHM resolution) within -wide tilted rings. Our deep CO exposure on R2 provided a 3 upper limit of (; ), a factor of seven deeper sensitivity than was reached in the Schruba et al. (2011) profile. Our upper limit on the CO line intensity is also deeper than the published measurements and limits for other outer disk star forming regions: Braine & Herpin (2004), Braine et al. (2007), Braine et al. (2010), and Dessauges-Zavadsky et al. (2014), all of which used the IRAM telescope. The deepest previously published values are (Braine & Herpin, 2004; Braine et al., 2007; Dessauges-Zavadsky et al., 2014) and (Dessauges-Zavadsky et al., 2014). R2 in NGC 4625 is also at a larger radius relative to than the published regions, all of which are at .
4.2 Molecular-Hydrogen Kennicutt-Schmidt Law for Star Forming Regions in XUV Disks
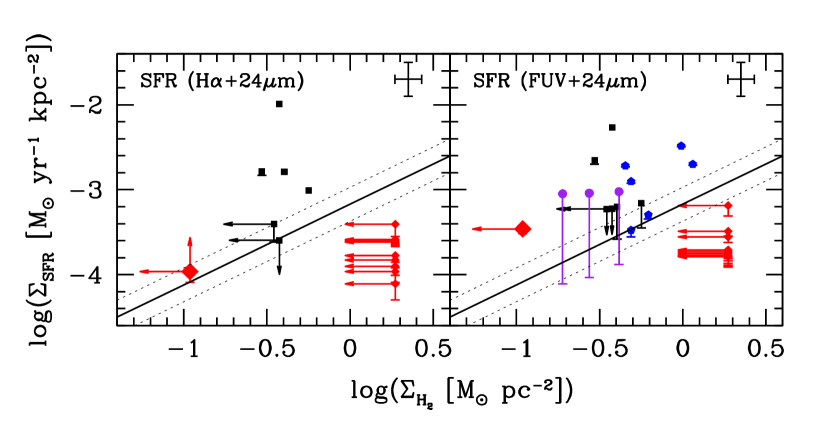
In Figure 4, we compared the location of XUV disk star forming regions with deep CO measurements or upper limits (large red diamond and small black squares, blue pentagons, and purple circles) to the Leroy et al. (2013) fit to the molecular-hydrogen Kennicutt-Schmidt law within the optical disk of 30 spiral galaxies (solid line, with scatter shown as dotted lines; we used the fit that is appropriate when the data are not corrected for cirrus emission and we adjusted the relation so it is appropriate for values that are not corrected for helium). We also included NGC 4625 R4-R12 from Gil de Paz et al. (2007a), which have shallow CO(2–1) upper limits from HERACLES (small red diamonds; Leroy et al., 2009).
When we computed the SFRs based on H data or data (the left and right panels of Figure 4, respectively), of all the regions, of the regions with deep CO observations, and of the regions with CO detections are or could be within the scatter of the Leroy et al. (2013) fit. The detections tend to be offset to larger at a given compared to the fit for the optical disk. This offset to high SFE is consistent with single star forming regions that are relatively evolved, in that they may represent clusters with relatively high SFRs that have exhausted or expelled a fraction of their molecular gas, as proposed by Schruba et al. (2010) for some regions in M33. Therefore, while most of the regions are consistent with the molecular-hydrogen Kennicutt-Schmidt law, the largest outliers may be due to evolutionary effects.
4.3 Age Estimates for Star Forming Regions in XUV Disks
We estimated that the ages of the star forming regions in the XUV disks of NGC 4625 and NGC 6946 are , based on the ratio of the H flux to the FUV flux, both of which are corrected for Galactic and internal extinction (Figure 5; see also Goddard et al., 2011). This age estimate requires that we measured the flux ratio of a single stellar population that underwent a burst of star formation. We therefore used the smallest aperture appropriate for the GALEX FWHM: the -diameter aperture. We compared our H-to-FUV flux ratio measurements to Starburst99 models (Leitherer et al., 1999) for the evolution of and clusters (solid lines in Figure 5) with the metallicity of the Large Magellanic Cloud (; ). We chose this metallicity because it is the closest option offered in the code relative to the average metallicity of the star forming regions we studied (; see Table 2). We used the default Starburst99 IMF, which has an upper boundary of . The age range we measured is consistent with the ages first reported by Goddard et al. (2011), with overlap in the regions we studied in NGC 4625. Goddard et al. (2011) cautioned that the ages in this plot may be spuriously old if stochasticity in the star formation process is relevant in the regions.
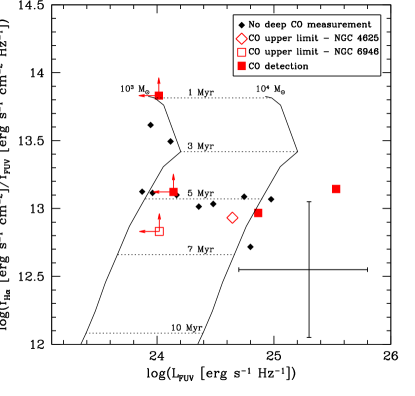
To put the age estimates in the context of the presence or absence of molecular gas, black diamonds in Figure 5 represent the star forming regions where no deep CO measurement has been attempted, open red symbols represent regions with a deep CO upper limit, and filled red symbols represent regions with a CO detection from Braine et al. (2007). We found no trend between age and the CO detection rate. In Section 5, we discuss this result relative to our expectation that all the regions we studied should contain molecular gas because they are young compared to the typical destruction time of a molecular cloud (; McKee & Ostriker, 2007; Kawamura et al., 2009).
We estimated that the uncertainty on the H-to-FUV flux ratio is and the uncertainty on the FUV luminosity is , based on the potential for systematic uncertainty due to the aperture size and the internal extinction correction (described in more detail below). The flux ratio uncertainty leads to an uncertainty of about in the age estimate. This does not include the systematic uncertainty due to stochasticity in the star formation process (mentioned above) or the assumed IMF.
The first potential source of systematic uncertainty is due to the aperture size, which affects the H-to-FUV flux ratio and the FUV luminosity in NGC 4625 because there is abundant diffuse FUV emission in the XUV disk while H is mainly from concentrated regions. The H-to-FUV flux ratio within the 6-diameter aperture is on average a factor of 2.9 larger than the value within the 21-diameter aperture. The FUV luminosity within the 6-diameter aperture is on average a factor of 4.2 smaller than the value within the 21-diameter aperture. If we were not limited by the angular resolution of the FUV data, we would have used an aperture smaller than ( in NGC 4625 and in NGC 6946) for our flux ratio measurements because our age estimate assumes a single stellar population. The H luminosities of the regions in NGC 4625 are consistent with gas ionized by a single O star (Gil de Paz et al., 2007a; Goddard et al., 2011) and typical H II regions that are ionized by a single star have diameters less than (Whitmore et al., 2011). Based on the radial profile of the H-to-FUV flux ratio between a radius of and 10.5, we expect the flux ratio to be larger and ages younger within smaller apertures. We estimated that the H-to-FUV flux ratio in -diameter regions could be approximately a factor of three larger than our nominal values, based on the comparison between the flux ratio within the 6- and 21-diameter aperture. We also estimated that the FUV luminosity in -diameter regions could be approximately a factor of four smaller than our nominal values because of the prevalent extended emission. More precise estimates of the FUV luminosity, H-to-FUV flux ratio, and age would be possible with higher resolution FUV data. Note that aperture size does not uniformly affect all regions or all galaxies; the two regions with FUV detections in NGC 6946 show relatively flat H-to-FUV radial profiles because there is less diffuse FUV emission than in NGC 4625.
The second potential source of systematic uncertainty is due to the internal extinction correction. We used the Calzetti (2001) relation . If we instead applied the Cardelli et al. (1989) extinction law (), the NGC 4625 H-to-FUV flux ratios would be on average smaller by a factor of three and the FUV luminosities larger by a factor of three while the NGC 6946 flux ratios would be smaller by a factor of 1.2 on average. Goddard et al. (2010, 2011) corrected for internal extinction using an azimuthally-averaged -(FUV-NUV) color relation (note that starburst and normal galaxies adhere to different -(FUV-NUV) relationships and this type of relation is not reliable in dwarfs; Lee et al., 2009). They applied no extinction correction beyond the radius where the FUV-NUV color averages to zero and noted that outer disk star forming regions are often beyond this radius. If we did not apply any internal extinction correction, our H-to-FUV flux ratios would be on average larger by a factor of 1.7 and the FUV luminosities smaller by a factor of 3.8. We still found no trend between age and the CO detection rate if we corrected for internal extinction using the Cardelli et al. (1989) extinction law or if we applied no internal extinction correction.
5 Discussion
5.1 The Molecular-Hydrogen Kennicutt-Schmidt Law in XUV Disks: Evolutionary Effects and Comparison to Other Work
In Section 4.2, we concluded that the XUV disk star forming regions in Figure 4 are in general consistent with the molecular-hydrogen Kennicutt-Schmidt law that applies within the optical disk, although there are significant outliers. This statement applies for SFRs calculated using either H or data. We also concluded that the distributions of SFRs based on H and are consistent with each other in NGC 4625 and NGC 6946 (the Kolmogorov-Smirnov test probability that the distributions are drawn from the same population is 0.3; Section 3.2). One may have expected the H-based SFRs to be lower than the FUV-based SFRs because the H-to-FUV flux ratio in XUV disk star forming regions is lower by up to a factor of 1.6 compared to regions in the optical disk (Goddard et al., 2010). This discrepancy between our expectations and the observations may be due to our selection of H-bright regions in NGC 4625 and NGC 6946 combined with the fact that the SFRs both include emission, which is less sensitive to age than H.
We also concluded in Section 4.2 that the XUV disk star forming regions with CO detections tend to have high molecular gas SFEs (i.e., large at a given ) relative to values in typical inner disks. The high molecular gas SFEs could be due to evolutionary effects in our H- or FUV-selected regions. Schruba et al. (2010) studied the inner disk of M33 and concluded that scatter in the Kennicutt-Schmidt law increases when the aperture contains few star forming regions () because the regions could be in any evolutionary state between a molecular cloud with little star formation and a relatively mature cluster with little remaining molecular gas. The scatter in the Kennicutt-Schmidt law decreases with larger aperture size because one averages over the evolutionary stages of multiple regions. Evolutionary effects may be important in XUV disk star forming regions because star formation is so sparse in outer disks that our aperture often only contains one star forming region even though most of the apertures have large physical sizes ( in NGC 4625, in NGC 6946, in M33, and in NGC 4414).
Kruijssen & Longmore (2014) developed an analytic expression for the aperture size below which the Kennicutt-Schmidt law breaks down due to large scatter and evaluated the expression for an idealized disk galaxy, assuming H as the SFR tracer. They concluded that evolutionary effects set the minimum aperture size for the majority of the optical disk, in agreement with Schruba et al. (2010). In the outer disk of their model galaxy where the SFR is low, the aperture size is set by the incomplete population of the IMF with massive stars. However, the underproduction of massive stars can only lead to underestimated SFRs. Therefore, evolutionary effects are more likely the cause of the high molecular gas SFEs in the XUV regions with CO detections.
In contrast to the high molecular gas SFEs that we derived for the regions with CO detections in NGC 6946, M33, and NGC 4414, Dessauges-Zavadsky et al. (2014) concluded that their two CO detections in M63 at have low molecular gas SFEs. Evolutionary effects may be less important for the regions studied by Dessauges-Zavadsky et al. (2014) because their pointings cover a complex of FUV knots that may contain multiple star forming regions, although the lack of H emission seems to indicate that the complex is uniformly older than . Dessauges-Zavadsky et al. (2014) noted that the outer disk warp in M63 or high turbulence may lead to the lower SFEs that they observed. To determine the range of SFEs possible in XUV disks, it will be useful to compile CO measurements for more regions with a variety of H-to-FUV flux ratios.
5.2 The Presence of Molecular Gas as an Independent Age Probe
In Section 4.3, we estimated ages for the XUV disk star forming regions in Figure 5 to be based on the H-to-FUV flux ratios and we noted that these ages could be overestimated if stochastic sampling of the IMF is important. An additional – albeit coarse – probe of the age is the presence or absence of molecular gas, because star forming regions evolve from molecular clouds with little star formation to clusters that have exhausted or expelled the gas. We hypothesized that molecular gas should be present in all the regions in Figure 5 because molecular clouds start forming stars fast and live for (although the lifetime estimates are uncertain; McKee & Ostriker, 2007; Kawamura et al., 2009; Dobbs & Pringle, 2013) while all our regions are younger than . However, we did not find any trend between the age based on the H-to-FUV flux ratio and the CO detection rate. Our current data are insufficient to fully test our hypothesis. We can make progress in comparing ages based on the H-to-FUV flux ratio versus the presence or absence of molecular gas in the low-density regime with deeper CO observations of more star forming regions and higher resolution FUV data.
A deep CO map of a large () region in an XUV disk could also help break the degeneracy between age and stochastic sampling of the IMF as the explanation for low H-to-FUV flux ratios in XUV disks. If star forming regions are only aging, we expect molecular clouds per H II region and molecular clouds per FUV-bright region, based on the relative lifetimes of molecular clouds that are capable of forming massive stars (), H II regions (), and the FUV-emitting phase (). If stochastic sampling of the IMF is important, some of the regions could appear old based on the H-to-FUV flux ratio but in reality be younger than . These regions would likely still contain molecular gas. Therefore, the map would contain more than molecular clouds per H II region. This test can be carried out in the near future, as the Atacama Large Millimeter/submillimeter Array has the sensitivity to map large regions of XUV disks at about the resolution of molecular clouds and detect CO emission from the least massive clouds that are capable of producing an O or B0 star (; Kennicutt & Evans, 2012; Koda et al., 2012).
It is not yet clear which conditions maximize the likelihood of detecting CO in XUV disks. We did not detect CO in a young region with H emission in NGC 4625 while Braine et al. (2007) detected CO in regions with similar H-to-FUV flux ratios, SFR surface densities, and ages. High H I surface density could indicate regions that are partially molecular. The Dessauges-Zavadsky et al. (2014) regions have H I surface densities (, not including He) that are similar to inner disk regions in M63 with CO detections. However, they only detected CO in two out of twelve XUV disk regions. In NGC 4625, the H I surface density at the largest radius () in the Schruba et al. (2011) radial profile is , which is less than the H I surface density in regions where CO is detected ( with ). CO detectability in XUV disks may be correlated with the radius relative to , stellar surface density, mid-plane pressure, and orbital time because these parameters are generally correlated with molecular fraction (; Wong & Blitz 2002; Blitz & Rosolowsky 2006; Leroy et al. 2008). Finally, the CO detection rate in XUV disks may be lower for low-mass galaxies because they tend to have lower metallicity (Tremonti et al., 2004) and the CO luminosity decreases for a given mass at low metallicity (e.g., Wolfire et al., 2010; Leroy et al., 2011; Bolatto et al., 2013).
6 Conclusions
We measured an upper limit on the CO intensity in one star forming region at in the XUV disk of NGC 4625. We measured the SFR surface density (with H, FUV, and data) for this region plus fifteen star forming regions in the XUV or outer disks of NGC 6946, M33, and NGC 4414 that have deep CO measurements or upper limits from the literature, and ten additional star forming regions in NGC 4625 with shallow CO upper limits from the HERACLES survey (Leroy et al., 2009). Our two main results based on these measurements are the following:
1. The XUV disk star forming regions are in general consistent with the same molecular-hydrogen Kennicutt-Schmidt law that applies within the optical disk. However, the most significant outliers may reflect evolutionary effects in our H- or FUV- selected regions (Figure 4).
2. We found no correlation between the age of the XUV disk star forming regions based on the H-to-FUV flux ratio () and the CO detection rate (Figure 5).
Deeper CO data for more XUV disk star forming regions would facilitate a number of investigations. We could determine the range of molecular gas SFEs in XUV disk star forming regions, test our hypothesis that molecular gas should be present in young regions like those we studied (), and determine which conditions control the CO detection rate. Finally, we may be able to use the presence or absence of molecular gas as a coarse age probe to break the degeneracy between age and stochastic sampling of the IMF as the explanation for the low H-to-FUV flux ratios in XUV disks.
Acknowledgements
We thank Armando Gil de Paz for his advice throughout the project, Andreas Schruba for sharing his CO(2–1) radial profile, Annette Ferguson for sharing her H image of NGC 6946, Jonathan Braine for sharing his CO line intensities for NGC 4414, and the referee for comments that improved this work. UL has been supported by the research projects AYA2011-24728 from the Spanish Ministerio de Ciencia y Educación and the Junta de Andalucía (Spain) grants FQM108. This work is based on observations carried out with the IRAM 30m Telescope. IRAM is supported by INSU/CNRS (France), MPG (Germany) and IGN (Spain). This work made use of HERACLES, “The HERA CO-Line Extragalactic Survey” (Leroy et al., 2009). Some of the data presented in this paper were obtained from the Mikulski Archive for Space Telescopes (MAST). STScI is operated by the Association of Universities for Research in Astronomy, Inc., under NASA contract NAS5-26555. Support for MAST for non-HST data is provided by the NASA Office of Space Science via grant NNX09AF08G and by other grants and contracts. This research has made use of the NASA/IPAC Extragalactic Database (NED) which is operated by the Jet Propulsion Laboratory, California Institute of Technology, under contract with the National Aeronautics and Space Administration.
References
- Alberts et al. (2011) Alberts, S., Calzetti, D., Dong, H., et al. 2011, ApJ, 731, 28
- Albrecht et al. (2004) Albrecht, M., Chini, R., Krügel, E., Müller, S. A. H., & Lemke, R. 2004, A&A, 414, 141
- Barnes et al. (2012) Barnes, K. L., van Zee, L., Côté, S., & Schade, D. 2012, ApJ, 757, 64
- Bigiel et al. (2008) Bigiel, F., Leroy, A., Walter, F., Brinks, E., de Blok, W. J. G., Madore, B., & Thornley, M. D. 2008, AJ, 136, 2846
- Bigiel et al. (2010) Bigiel, F., Leroy, A., Walter, F., et al. 2010, AJ, 140, 1194
- Blanc et al. (2009) Blanc, G. A., Heiderman, A., Gebhardt, K., Evans, N. J., II, & Adams, J. 2009, ApJ, 704, 842
- Blitz & Rosolowsky (2006) Blitz, L., & Rosolowsky, E. 2006, ApJ, 650, 933
- Boissier et al. (2005) Boissier, S., Gil de Paz, A., Madore, B. F., et al. 2005, ApJ, 619, L83
- Boissier et al. (2007) Boissier, S., Gil de Paz, A., Boselli, A., et al. 2007, ApJS, 173, 524
- Bolatto et al. (2013) Bolatto, A. D., Wolfire, M., & Leroy, A. K. 2013, ARA&A, 51, 207
- Bonanos et al. (2006) Bonanos, A. Z., Stanek, K. Z., Kudritzki, R. P., et al. 2006, ApJ, 652, 313
- Braine & Herpin (2004) Braine, J., & Herpin, F. 2004, Nature, 432, 369
- Braine et al. (2007) Braine, J., Ferguson, A. M. N., Bertoldi, F., & Wilson, C. D. 2007, ApJ, 669, L73
- Braine et al. (2010) Braine, J., Gratier, P., Kramer, C., et al. 2010, A&A, 520, A107
- Bush & Wilcots (2004) Bush, S. J., & Wilcots, E. M. 2004, AJ, 128, 2789
- Calzetti (2001) Calzetti, D. 2001, PASP, 113, 1449
- Cardelli et al. (1989) Cardelli, J. A., Clayton, G. C., & Mathis, J. S. 1989, ApJ, 345, 245
- Carilli & Walter (2013) Carilli, C. L., & Walter, F. 2013, ARA&A, 51, 105
- Daddi et al. (2010) Daddi, E., Elbaz, D., Walter, F., et al. 2010, ApJ, 714, L118
- Dale et al. (2009) Dale, D. A., Cohen, S. A., Johnson, L. C., et al. 2009, ApJ, 703, 517
- Dessauges-Zavadsky et al. (2014) Dessauges-Zavadsky, M., Verdugo, C., Combes, F., & Pfenniger, D. 2014, A&A, 566, A147
- de Vaucouleurs et al. (1991) de Vaucouleurs, G., de Vaucouleurs, A., Corwin, H. G., et al. 1991, Third Reference Catalogue of Bright Galaxies (New York: Springer)
- Dobbs & Pringle (2013) Dobbs, C. L., & Pringle, J. E. 2013, MNRAS, 432, 653
- Dong et al. (2008) Dong, H., Calzetti, D., Regan, M., et al. 2008, AJ, 136, 479
- Dopita et al. (2006) Dopita, M. A., Fischera, J., Sutherland, R. S., et al. 2006, ApJS, 167, 177
- Elmegreen & Hunter (2006) Elmegreen, B. G., & Hunter, D. A. 2006, ApJ, 636, 712
- Ferguson et al. (1998a) Ferguson, A. M. N., Gallagher, J. S., & Wyse, R. F. G. 1998a, AJ, 116, 673
- Ferguson et al. (1998b) Ferguson, A. M. N., Wyse, R. F. G., Gallagher, J. S., & Hunter, D. A. 1998b, ApJ, 506, L19
- Freedman et al. (2001) Freedman, W. L., Madore, B. F., Gibson, B. K., et al. 2001, ApJ, 553, 47
- Fukui & Kawamura (2010) Fukui, Y., & Kawamura, A. 2010, ARA&A, 48, 547
- Genzel et al. (2010) Genzel, R., Tacconi, L. J., Gracia-Carpio, J., et al. 2010, MNRAS, 407, 2091
- Gil de Paz et al. (2005) Gil de Paz, A., Madore, B. F., Boissier, S., et al. 2005, ApJ, 627, L29
- Gil de Paz et al. (2007a) Gil de Paz, A., Madore, B. F., Boissier, S., et al. 2007a, ApJ, 661, 115
- Gil de Paz et al. (2007b) Gil de Paz, A., Boissier, S., Madore, B. F., et al. 2007b, ApJS, 173, 185
- Glover & Mac Low (2011) Glover, S. C. O., & Mac Low, M.-M. 2011, MNRAS, 412, 337
- Goddard et al. (2010) Goddard, Q. E., Kennicutt, R. C., & Ryan-Weber, E. V. 2010, MNRAS, 405, 2791
- Goddard et al. (2011) Goddard, Q. E., Bresolin, F., Kennicutt, R. C., Ryan-Weber, E. V., & Rosales-Ortega, F. F. 2011, MNRAS, 412, 1246
- Gogarten et al. (2009) Gogarten, S. M., Dalcanton, J. J., Williams, B. F., et al. 2009, ApJ, 691, 115
- Hartman et al. (2006) Hartman, J. D., Bersier, D., Stanek, K. Z., et al. 2006, MNRAS, 371, 1405
- Holwerda et al. (2012) Holwerda, B. W., Pirzkal, N., & Heiner, J. S. 2012, MNRAS, 427, 3159
- Hoversten & Glazebrook (2008) Hoversten, E. A., & Glazebrook, K. 2008, ApJ, 675, 163
- Hunter et al. (2013) Hunter, D. A., Elmegreen, B. G., Rubin, V. C., et al. 2013, AJ, 146, 92
- Kawamura et al. (2009) Kawamura, A., Mizuno, Y., Minamidani, T., et al. 2009, ApJS, 184, 1
- Kennicutt (1998) Kennicutt, R. C., Jr. 1998, ApJ, 498, 541
- Kennicutt et al. (2003) Kennicutt, R. C., Jr., Armus, L., Bendo, G., et al. 2003, PASP, 115, 928
- Kennicutt et al. (2008) Kennicutt, R. C., Jr., Lee, J. C., Funes, S. J., José G., Sakai, S., & Akiyama, S. 2008, ApJS, 178, 247
- Kennicutt & Evans (2012) Kennicutt, R. C., & Evans, N. J. 2012, ARA&A, 50, 531
- Koda et al. (2012) Koda, J., Yagi, M., Boissier, S., et al. 2012, ApJ, 749, 20
- Kruijssen & Longmore (2014) Kruijssen, J. M. D., & Longmore, S. N. 2014, MNRAS, 439, 3239
- Lee et al. (2009) Lee, J. C., Gil de Paz, A., Tremonti, C., et al. 2009, ApJ, 706, 599
- Leitherer et al. (1999) Leitherer, C., Schaerer, D., Goldader, J. D., et al. 1999, ApJS, 123, 3
- Lemonias et al. (2011) Lemonias, J. J., Schiminovich, D., Thilker, D., et al. 2011, ApJ, 733, 74
- Leroy et al. (2008) Leroy, A. K., Walter, F., Brinks, E., et al. 2008, AJ, 136, 2782
- Leroy et al. (2009) Leroy, A. K., Walter, F., Bigiel, F., et al. 2009, AJ, 137, 4670
- Leroy et al. (2011) Leroy, A. K., Bolatto, A., Gordon, K., et al. 2011, ApJ, 737, 12
- Leroy et al. (2012) Leroy, A. K., Bigiel, F., de Blok, W. J. G., et al. 2012, AJ, 144, 3
- Leroy et al. (2013) Leroy, A. K., Walter, F., Sandstrom, K., et al. 2013, AJ, 146, 19
- Martin & Kennicutt (2001) Martin, C. L., & Kennicutt, R. C., Jr. 2001, ApJ, 555, 301
- McGaugh (1991) McGaugh, S. S. 1991, ApJ, 380, 140
- McKee & Ostriker (2007) McKee, C. F., & Ostriker, E. C. 2007, ARA&A, 45, 565
- Meurer et al. (2009) Meurer, G. R., Wong, O. I., Kim, J. H., et al. 2009, ApJ, 695, 765
- Moffett et al. (2012) Moffett, A. J., Kannappan, S. J., Baker, A. J., & Laine, S. 2012, ApJ, 745, 34
- Morrissey et al. (2007) Morrissey, P., Conrow, T., Barlow, T. A., et al. 2007, ApJS, 173, 682
- Muñoz-Mateos et al. (2009) Muñoz-Mateos, J. C., Gil de Paz, A., Boissier, S., et al. 2009, ApJ, 701, 1965
- Narayanan et al. (2012) Narayanan, D., Krumholz, M. R., Ostriker, E. C., & Hernquist, L. 2012, MNRAS, 421, 3127
- O’Donnell (1994) O’Donnell, J. E. 1994, ApJ, 422, 158
- Osterbrock (1989) Osterbrock, D. E. 1989, Astrophysics of Gaseous Nebulae and Active Galactic Nuclei (Mill Valley, CA: University Science Books)
- Paturel et al. (2003) Paturel, G., Petit, C., Prugniel, P., et al. 2003, A&A, 412, 45
- Rahman et al. (2012) Rahman, N., Bolatto, A. D., Xue, R., et al. 2012, ApJ, 745, 183
- Sandstrom et al. (2013) Sandstrom, K. M., Leroy, A. K., Walter, F., et al. 2013, ApJ, 777, 5
- Schlafly & Finkbeiner (2011) Schlafly, E. F., & Finkbeiner, D. P. 2011, ApJ, 737, 103
- Schlegel et al. (1998) Schlegel, D. J., Finkbeiner, D. P., & Davis, M. 1998, ApJ, 500, 525
- Schmidt (1959) Schmidt, M. 1959, ApJ, 129, 243
- Schruba et al. (2010) Schruba, A., Leroy, A. K., Walter, F., Sandstrom, K., & Rosolowsky, E. 2010, ApJ, 722, 1699
- Schruba et al. (2011) Schruba, A., et al. 2011, AJ, 142, 37
- Snell et al. (2002) Snell, R. L., Carpenter, J. M., & Heyer, M. H. 2002, ApJ, 578, 229
- Thilker et al. (2005) Thilker, D. A., Bianchi, L., Boissier, S., et al. 2005, ApJ, 619, L79
- Thilker et al. (2007) Thilker, D. A., Bianchi, L., Meurer, G., et al. 2007, ApJS, 173, 538
- Tremonti et al. (2004) Tremonti, C. A., Heckman, T. M., Kauffmann, G., et al. 2004, ApJ, 613, 898
- Whitmore et al. (2011) Whitmore, B. C., Chandar, R., Kim, H., et al. 2011, ApJ, 729, 78
- Wolfire et al. (2010) Wolfire, M. G., Hollenbach, D., & McKee, C. F. 2010, ApJ, 716, 1191
- Wong & Blitz (2002) Wong, T., & Blitz, L. 2002, ApJ, 569, 157
| Region | RA | DEC | ||||||||
|---|---|---|---|---|---|---|---|---|---|---|
| (hh:mm:ss.s) | (dd:mm:ss) | () | () | () | () | () | ||||
| (1) | (2) | (3) | (4) | (5) | (6) | (7) | (8) | (9) | (10) | (11) |
| NGC 4625 | ||||||||||
| R2 | 12:42:05.136 | +41:16:12.14 | 3.4 | 0.048 | 0.894 | |||||
| R3 | 12:42:04.025 | +41:16:35.98 | 3.1 | 0.048 | 0.878 | … | … | |||
| R4 | 12:42:00.322 | +41:16:39.80 | 2.1 | 0.049 | 0.859 | … | ||||
| R5 | 12:41:59.150 | +41:15:21.11 | 2.4 | 0.050 | 0.829 | … | ||||
| R6 | 12:41:57.029 | +41:15:53.65 | 1.4 | 0.050 | 0.829 | … | ||||
| R7 | 12:41:56.234 | +41:15:30.90 | 1.6 | 0.050 | 0.902 | … | ||||
| R8 | 12:41:54.310 | +41:17:26.82 | 1.5 | 0.049 | 0.880 | … | ||||
| R9 | 12:41:51.538 | +41:15:17.52 | 1.7 | 0.050 | 0.842 | … | ||||
| R10 | 12:41:48.677 | +41:17:46.81 | 2.3 | 0.049 | 0.936 | … | ||||
| R11 | 12:41:45.151 | +41:16:00.29 | 2.3 | 0.051 | 0.919 | … | ||||
| R12 | 12:41:42.977 | +41:16:37.95 | 1.9 | 0.051 | 0.904 | … | ||||
| NGC 6946 | ||||||||||
| P7 | 20:34:26.6 | +60:12:47.9 | 1.0 | 0.951 | 0.903 | |||||
| P2 | 20:34:29.0 | +60:13:50.5 | 1.1 | 0.956 | 0.903 | |||||
| P8 | 20:34:54.3 | +60:15:40.5 | 1.3 | 0.979 | 0.903 | |||||
| P3 | 20:33:48.4 | +60:08:32.6 | 1.4 | 0.876 | 0.903 | |||||
| P5 | 20:34:51.4 | +60:16:24.9 | 1.5 | 0.987 | 0.903 | |||||
| P4 | 20:34:51.4 | +60:16:44.9 | 1.5 | 0.991 | 0.903 | |||||
| M33 | ||||||||||
| M33_18.1 | 01:34:13.31 | +31:10:32.0 | 1.1 | 0.129 | … | … | ||||
| M33_18.2 | 01:34:11.94 | +31:10:32.0 | 1.1 | 0.128 | … | … | … | |||
| M33_18.3 | 01:34:13.31 | +31:10:21.5 | 1.1 | 0.128 | … | … | … | |||
| M33_18.4 | 01:34:12.61 | +31:10:32.0 | 1.1 | 0.128 | … | … | ||||
| M33_20.1 | 01:34:47.79 | +31:08:23.8 | 1.0 | 0.135 | … | … | … | |||
| M33_20.2 | 01:34:49.79 | +31:08:23.8 | 1.0 | 0.135 | … | … | … | |||
| NGC 4414 | ||||||||||
| R1 | 12:26:30.51 | +31:11:06.9 | 1.4 | 0.054 | … | … | … | |||
| R2 | 12:26:29.17 | +31:11:30.0 | 1.1 | 0.054 | … | … | … | |||
| R3 | 12:26:26.57 | +31:15:37.7 | 1.4 | 0.053 | … | … | … | |||
Note. — Column 1: Region name, as originally presented in Gil de Paz et al. (2007a) for NGC 4625 and Braine et al. (2007) for NGC 6946. For M33, the names are from Braine et al. (2010) and we added the numbers after the decimal point. R1, R2, and R3 in NGC 4414 correspond to offset positions (51, -138), (31, -115), and (-8, 133), respectively, from Braine & Herpin (2004). We did not include offset position (-68, 162) because it falls outside the FUV image. Column 2 and 3: RA and DEC (J2000.0) of regions. Column 4: Galactocentric radius, normalized to , which is for NGC 4625 (Schruba et al., 2011), for NGC 6946 (Braine et al., 2007), for M33 (Paturel et al., 2003), and for NGC 4414 (de Vaucouleurs et al., 1991). The NGC 4625 galactocentric radii are from Gil de Paz et al. (2007a). We computed the NGC 6946, M33, and NGC 4414 values from the region coordinates in Columns 2 and 3, the position angles and inclinations from de Vaucouleurs et al. (1991), and the galaxy centers from Muñoz-Mateos et al. (2009) or the NASA/IPAC Extragalactic Database (NED). Note that use of from de Vaucouleurs et al. (1991) puts the M33 regions at . Column 5: Extinction in the V-band due to the Galaxy (Schlafly & Finkbeiner, 2011). Column 6: Multiplicative factor applied to obtain the H flux from the measured flux, which includes H and [NII] emission. For NGC 4625, the [NII] correction factor is based on the [NII] /H ratios from Gil de Paz et al. (2007a) and we assumed the theoretical value of [NII]/[NII] of 0.33 (Osterbrock, 1989). For R3, we used the average ratio from the remaining regions. For NGC 6946, we used a constant [NII] correction factor, based on the measured value for P3 from Ferguson et al. (1998a). Column 7 and 8: CO(1-0) and CO(2-1) line intensity, within the 21- and 11-diameter beams, respectively. All upper limits in the table are 3 upper limits. The upper limit for R2 in NGC 4625 is from this work, assuming a line width of . We calculated the upper limits for the remaining regions in NGC 4625 from the HERACLES survey integrated intensity map (Leroy et al., 2009). The values for regions in NGC 6946 and M33 are from Braine et al. (2007) and Braine et al. (2010), respectively, where the uncertainties are based on the rms noise in the spectrum and upper limits were calculated with a line width of . The NGC 4414 values are from Braine & Herpin (2004) and we assumed 15% uncertainty. Column 9: H flux within an 21-diameter aperture, corrected for [NII] emission and Galactic extinction (not internal extinction). Column 10: FUV flux density within a 21-diameter aperture, corrected for Galactic extinction. Column 11: Average surface brightness within a 21-diameter aperture.
| Region | Offset | ||||||
|---|---|---|---|---|---|---|---|
| (arcsec) | () | () | () | ||||
| (1) | (2) | (3) | (4) | (5) | (6) | (7) | (8) |
| NGC 4625 | |||||||
| R2 | 0.0 | 0.31 | 8.531 | 1.3 | |||
| R3 | 0.0 | 0.23 | … | 1.0 | |||
| R4 | 0.0 | 0.54 | … | 2.4 | |||
| R5 | 0.0 | 0.13 | 8.123 | 0.5 | |||
| R6 | 0.0 | 0.25 | 8.265 | 1.1 | |||
| R7 | 0.0 | 0.29 | 8.296 | 1.2 | |||
| R8 | 0.0 | 0.45 | … | 2.0 | |||
| R9 | 0.0 | 0.30 | 8.400 | 1.3 | |||
| R10 | 0.0 | 0.00 | … | 0.0 | |||
| R11 | 0.0 | 0.66 | … | 2.9 | |||
| R12 | 0.0 | 0.22 | 8.333 | 0.9 | |||
| NGC 6946 | |||||||
| P7 | 3.0 | … | … | ||||
| P2 | 1.1 | … | … | ||||
| P8 | 3.6 | … | … | ||||
| P3 | 1.4 | … | 8.1 | ||||
| P5 | 0.8 | … | … | ||||
| P4 | 0.0 | … | … | ||||
Note. — Column 1: Region name, as originally presented in Gil de Paz et al. (2007a) for NGC 4625 and Braine et al. (2007) for NGC 6946. Column 2: Offset between the aperture center for the H and FUV flux measurements within the -diameter aperture and the coordinates from Gil de Paz et al. (2007a, NGC 4625) or Braine et al. (2007, NGC 6946). Column 3: Color excess for NGC 4625 from Gil de Paz et al. (2007a), based on the Balmer line decrement and including reddening due to both Galactic and internal dust. Column 4: from Gil de Paz et al. (2007a) for NGC 4625 and Ferguson et al. (1998a) for NGC 6946. All values are based on the R23 calibration using the McGaugh (1991) method. Column 5: FUV extinction, due to internal extinction only. For NGC 4625, we derived this from from Column 5 of Table 1, from Column 3, and the Calzetti (2001) relation . For NGC 6946, we used the Muñoz-Mateos et al. (2009) radial profile based on the relationship between internal FUV extinction and the TIR-to-FUV luminosity ratio. Column 6: H flux within a 6-diameter aperture, corrected for [NII] emission and Galactic and internal extinction. For NGC 4625, we corrected for Galactic and internal extinction with the from Column 3. For NGC 6946, we corrected for Galactic and internal extinction with from Column 5 of Table 1, from Column 5, and the Calzetti (2001) relation . All upper limits in the table are upper limits. Column 7: FUV flux density within a 6-diameter aperture, corrected for Galactic and internal extinction with from Column 5 of Table 1 and from Column 5. Column 8: FUV luminosity, assuming a distance of for NGC 4625 and for NGC 6946 (Schruba et al., 2011).