Complex molecules in W51 North region
Abstract
We present Submillimeter Array (SMA) molecular line observations in two 2 GHz-wide bands centered at 217.5 and 227.5 GHz, toward the massive star forming region W51 North. We identified 84 molecular line transitions from 17 species and their isotopologues. The molecular gas distribution of these lines mainly peaks in the continuum position of W51 North, and has a small tail extending to the west, probably associated with W51 d2. In addition to the commonly detected nitrogen and oxygen-bearing species, we detected a large amount of transitions of the Acetone (CH3COCH3) and Methyl Formate (CH3OCHO), which may suggest that these molecules are present in an early evolutionary stage of the massive stars. We also found that W51 North is an ethanol-rich source. There is no obvious difference in the molecular gas distributions between the oxygen-bearing and nitrogen-bearing molecules. Under the assumption of Local Thermodynamic Equilibrium (LTE), with the XCLASS tool, the molecular column densities, and rotation temperatures are estimated. We found that the oxygen-bearing molecules have considerable higher column densities and fractional abundances than the nitrogen-bearing molecules. The rotation temperatures range from 100 to 200 K, suggesting that the molecular emission could be originated from a warm environment. Finally, based on the gas distributions, fractional abundances and the rotation temperatures, we conclude that CH3OH, C2H5OH, CH3COCH3 and CH3CH2CN might be synthesized on the grain surface, while gas phase chemistry is responsible for the production of CH3OCH3, CH3OCHO and CH2CHCN.
keywords:
ISM:abundances — ISM:individual (W51 North) — ISM:molecules — radio lines: ISM — stars:formation1 Introduction
There are three promising theoretical models to explain the formation of the massive stars: monolithic collapse, competitive accretion, and mergers of low mass stars (see for a review, Zinnecker & Yorke 2007). However, their relative large distances (a few parsecs), the clustered formation environments, and their short timescales have made extremely difficult to discard any of these models (Zapata et al. 2015).
Massive stars have a substantial impact on their surrounding environments, making important contributions to the chemistry enrichment of the interstellar medium (e. g., Hernández-Hernández et al. 2014). Thus, searching for complex molecules in massive star formation regions is a crucial building block to understand massive star formation, since these molecules can provide information on the physical conditions and evolutionary phases of massive star formation (Herbst & van Dishoeck 2009).
The W51 North is one of well-studied massive star-forming regions within the luminous cluster W51-IRS2 (Zapata, Tang & Leurini 2010). The distance from W51 North to the Sun is approximately 7 kpc (Imai et al. 2002). However, a more recent and accurate estimation from Xu et al. (2009) obtained 5.1 kpc.
A large number of H2O and OH masers, bright dust emission, outflows, and infalling gas were observed toward W51 North region, indicating that this region is forming indeed massive stars (Downes et al. 1979; Zhang, Ho & Ohashi 1998; Zapata et al. 2008, 2009; Zapata, Tang & Leurini 2010). Absence of of centimeter emission suggests that W51 North may represent an extremely early stage of the massive star formation (Downes et al. 1979; Zhang, Ho & Ohashi 1998). As the Submillimeter Array (SMA111The Submillimeter Array is a joint project between the Smithsonian Astrophysical Observatory and the Academia Sinica Institute of Astronomy and Astrophysics and is funded by the Smithsonian Institution and the Academia Sinica.) has a broad bandwidth (4 GHz, at the time of these observations) one can detect multiple complex molecules simultaneously, allowing to trace the physical and chemical properties of massive star formation environments close to the massive protostars.
In this paper, we present the results from the SMA observations of W51 North region. We have identified 17 species and obtained their physical parameters by the use of XCLASS program. We describe the observations in §2. In §3 we present observational results, followed by data analysis in §4. §5 discusses individual molecules. We summarize the results in §6.
2 OBSERVATIONS
Track-sharing observations toward W51 North and W51 Main sources were carried out with the SMA in 2005 August, using seven antennas in its compact array. The phase-tracking center of W51 north was placed at R.A.= , decl.= (J2000.0). The typical system temperature of 183 K indicates good weather during observations. The observations covered frequencies from 216.5 to 218.5 GHz (lower sideband), and 226.5 to 228.5 GHz (upper sideband) with a frequency resolution of 0.8125 MHz.
The calibration and imaging were done in Miriad. Bandpass ripples were corrected with the QSO 3C454.3 and Uranus. We also corrected baseline-based bandpass errors using the QSO 3C454.3. QSOs 1741-038 and 1749+096 were used for phase calibration. Uranus was used for flux calibration, and the absolute flux scale is estimated to be accurate to within 20%. Continuum subtraction was made in UV domain. Self-calibration was performed to the continuum data, and the gain solutions from the continuum were applied to the line data.
The synthesized beam sizes of the continuum and line images are approximately 3′′.1 2′′.8 (P.A.). 1 rms noises of the continuum and lines are approximately 0.01 Jy beam-1 and 0.1 Jy beam-1, respectively. 1 Jy beam-1 corresponds to a main beam brightness temperature of 2.7 K.
3 RESULTS
3.1 Continuum
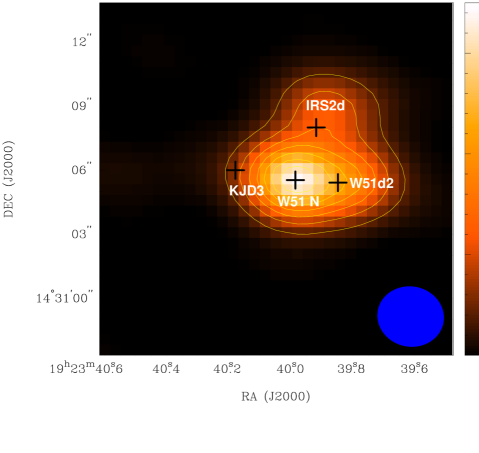
Continuum image was constructed from line-free channels of LSB and USB UV data, as shown in Figure 1. The continuum image shows a compact and strong source at the position of W51 North, with an extension to the north, which embraces IRS2d source. KJD3 and W51d2 are located east and west of W51 North, respectively (Zapata et al. 2008).
Two dimension Gaussian fits were made to the continuum obtaining the peak intensity and total integrated flux of Jy beam-1 and Jy, respectively.
Under the assumptions that an average grain radius is 0.1 m, grain density is 3 gr cm-3 and a gas to dust radio is 100, the H2 column density and mass can be calculated by the formula (Lis, Carlstrom & Keene 1991),
| (1) |
and
| (2) |
where and are Boltzmann constant and Planck constant, respectively. T is the dust temperature, Q() is the grain emissivity at frequency , is the total integrated flux of the continuum and is the solid angle subtended by the source, D is the distance from the source to Sun.
The CH3OH is a grain surface molecule. Here, this molecule peaks at the position of the continuum source associated with W51 North (see Figure 3 and discussion is section 5). Probably the dust and gas are well coupled through collisions in W51 North region. So we assumed that the dust temperature equals the rotation temperature of 138 K derived from the CH3OH lines. We adopt at 1.3 mm () (Lis & Goldsmith 1990; Lis, Carlstrom & Keene 1991). Therefore, we obtained a source-averaged H2 column density of cm-2 and an H2 mass of . As the continuum peaks at W51 North, then the mass estimated from peak intensity should correspond to gas mass of W51 North source. The H2 mass of 610 61 is estimated from the continuum peak intensity.
A similar result, 400 was reported by Zhang, Ho & Ohashi (1998), in which they calculated the mass of W51 North based on a dust temperature of 100 K, continuum peak intensity of 2.0 Jy beam-1 at GHz, D of 7 8 kpc and . If we take , then Q() at 1.3 mm and then the H2 mass of 535 54 is obtained. A dust temperature larger than 100 K suggests that dust grains are not coagulated with ice mantles, and thus 1.5 is a reasonable guess in W51 North (Ossenkopf & Henning 1994). Therefore the difference of mass between ours and 400 by Zhang, Ho & Ohashi (1998) may be caused by taking different value of distance, Q() and uncertain of flux calibration.
3.2 Molecular lines
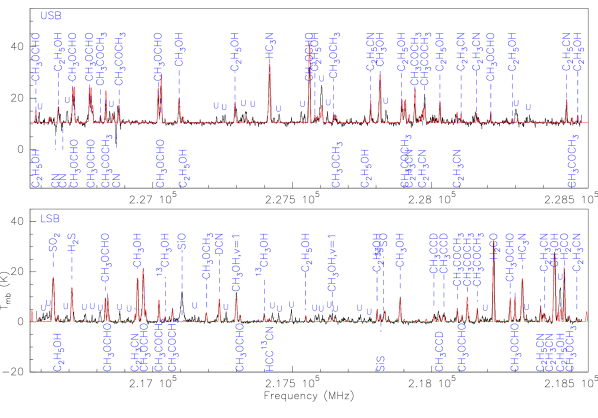
The Lower Sideband and Upper Sideband spectra extracted from the continuum peak position and related with W51 North, are shown as the black curves in Figure 2. A few CN transitions in the USB show absorption features indicating gas infalling onto continuum core (Zapata et al. 2008). The SiO line in emission is tracing the outflow reported by Zapata et al. (2009).
We identify all the molecular transitions using the XCLASS program222http://www.astro.uni-koeln.de/projects/schilke/XCLASS. 84 molecular transitions from 17 species and their isotopologues are identified (Figure 2). In this image the corresponding molecular names are labelled, including oxygen-bearing molecules of CH3OH, H2CO, C2H5OH, CH3OCHO, CH3OCH3, CH3COCH3, nitrogen-bearing molecules of CN, CH3CH2CN, HC3N, CH2CHCN, sulfur-bearing molecules of SO2, H2S, SiS, and deuterated molecules of DCN and CH3CCD. The quantum numbers, frequency, and of each transition are summarized in Table 1. Column (1) lists the species and column (2) lists quantum number, column (3), (4) and (5) give frequency, Sij and Eu. The source size , V and are given in column (6), (7) and (8), respectively.
3.3 Gas distribution
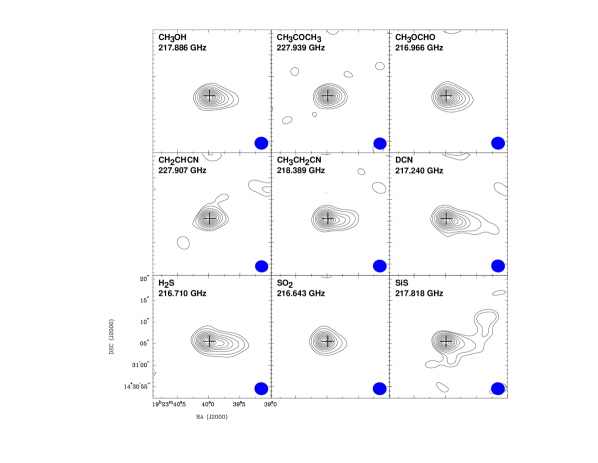
Figure 3 presents a sample of images from the oxygen-, nitrogen-, and sulfur-bearing molecules, which can provide spatial distribution of specific molecules. In general, all molecular images show a compact structure. The peak emission of the oxygen-bearing molecules of CH3OH, CH3COCH3 and CH3OCHO, and nitrogen-bearing molecules of CH2CHCN, CH3CH2CN and DCN are coincident with the continuum peak position. The oxygen- and nitrogen-bearing molecules are probably well mixed in space, which imply that they may have same chemical origin (Remijan et al. 2004). While the emission peak of the sulfur-bearing molecules of H2S, and SO2 are located east of the continuum peak. Probably the sulfur-bearing molecules have different chemical routes and form in different environments when compared with the oxygen- and nitrogen-bearing molecules. In addition to the compact source structure, there is an obvious gas extension to the west of the continuum traced by the DCN, H2S, and SiS is observed.
| Molecule | Quantum Numbers | Frequency | Sij | Eu | V | I | |
|---|---|---|---|---|---|---|---|
| GHz | debye2 | K | arcsec2 | kms-1 | Jy/beam | ||
| CH3OH | 216.94556 | 1.12357 | 55.87102 | ||||
| , | 217.29920 | 4.66445 | 373.92517 | ||||
| , | 217.64286 | 4.88652 | 745.60607 | ||||
| 217.88639 | 11.50535 | 508.37582 | |||||
| 218.44005 | 3.4766 | 45.45988 | |||||
| 227.09460 | 11.5939 | 557.07117 | |||||
| 227.81465 | 5.23842 | 327.23797 | |||||
| 13CH3OH | 217.04462 | 5.78629 | 254.25167 | ||||
| 217.39955 | 2.68164 | 162.41055 | |||||
| H2CO | 218.22219 | 16.30796 | 20.9564 | ||||
| 218.47563 | 9.06194 | 68.0937 | |||||
| C2H5OH | 216.65968 | 5.00042 | 106.29995 | ||||
| 217.54815 | 3.63648 | 75.60201 | |||||
| 217.80369 | 5.98544 | 23.89298 | |||||
| 218.46123 | 5.59497 | 23.89375 | |||||
| 226.58134 | 28.24034 | 304.69227 | |||||
| 226.66170 | 7.05411 | 51.02783 | |||||
| 227.29475 | 19.66545 | 148.56961 | |||||
| 227.60608 | 18.61686 | 175.30421 | |||||
| 227.76082 | 2.02053 | 71.44923 | |||||
| 227.89191 | 20.6452 | 140.01443 | |||||
| 228.02905 | 19.66581 | 143.89662 | |||||
| 228.28855 | 2.47972 | 118.95090 | |||||
| 228.52283 | 4.05832 | 95.90890 | |||||
| CH3OCH3 | AA | 217.19317 | 162.14491 | 253.41131 | |||
| AA | 218.49503 | 78.0112 | 263.83508 | ||||
| EA | 227.64812 | 84.89383 | 355.76623 | ||||
| AE | 227.65439 | 78.79933 | 285.56311 | ||||
| CH3COCH3 | EE | 217.02251 | 2042.48098 | 115.49565 | |||
| AA | 217.07050 | 765.72157 | 115.43113 | ||||
| EA | 218.09145 | 146.20943 | 119.17572 | ||||
| EE | 218.12721 | 1200.40770 | 119.10113 | ||||
| AA | 218.16293 | 1461.76777 | 119.02728 | ||||
| EE | 226.81261 | 547.66326 | 66.18982 | ||||
| AA | 226.87939 | 817.15094 | 126.31957 | ||||
| EE | 226.83206 | 2179.59244 | 126.38182 | ||||
| EE | 227.89467 | 215.20891 | 418.29082 | ||||
| EA | 227.90395 | 619.07570 | 130.11255 | ||||
| EE | 227.93937 | 672.20702 | 130.04037 | ||||
| AA | 227.97476 | 1547.25807 | 129.96837 | ||||
| AE | 228.50287 | 378.05109 | 68.56948 | ||||
| CH3OCHO | E | 216.83020 | 46.13641 | 105.67781 | |||
| A | 216.83889 | 46.14168 | 105.6673 | ||||
| E | 216.96625 | 52.81048 | 111.49826 | ||||
| A | 217.31263 | 42.78270 | 289.95716 | ||||
| E | 218.10844 | 42.94997 | 289.67911 | ||||
| E | 218.28090 | 43.5903 | 99.72935 | ||||
| A | 218.29789 | 43.60233 | 99.72110 | ||||
| A | 226.58140 | 6.87080 | 357.68199 | ||||
| E | 226.71306 | 52.04002 | 120.22039 | ||||
| A | 226.71875 | 51.409 | 120.207 | ||||
| E | 226.77315 | 51.417 | 120.21536 | ||||
| A | 226.77879 | 52.0425 | 120.20297 | ||||
| E | 227.01955 | 48.76106 | 116.573 | ||||
| A | 227.02810 | 48.4690 | 116.56162 | ||||
| E | 227.56269 | 8.88264 | 122.41946 | ||||
| E | 228.21129 | 46.25056 | 297.16473 |
| Molecule | Quantum Numbers | Frequency | Sij | Eu | V | I | |
|---|---|---|---|---|---|---|---|
| GHz | debye2 | K | arcsec2 | kms-1 | Jy/beam | ||
| DCN | 217.23855 | 23.85251 | 20.85164 | ||||
| CH3CH2CN | 218.38997 | 350.22816 | 139.91753 | ||||
| 227.78097 | 365.32437 | 150.84922 | |||||
| 228.48314 | 368.05531 | 146.59165 | |||||
| HC3N | 218.32479 | 332.86626 | 130.98209 | ||||
| 227.41891 | 346.74084 | 141.89637 | |||||
| HCC13CN | 217.41957 | 334.2359 | 130.43896 | ||||
| CH2CHCN | 216.93672 | 996.36042 | 133.93474 | ||||
| 218.40245 | 935.94512 | 203.51934 | |||||
| 218.42180 | 882.77691 | 263.80899 | |||||
| 218.52000 | 814.48136 | 341.05429 | |||||
| 227.91864 | 931.50638 | 274.74733 | |||||
| 227.96759 | 1002.49119 | 190.73697 | |||||
| 228.09054 | 1031.47311 | 156.23271 | |||||
| 228.10462 | 1018.75491 | 171.33742 | |||||
| 228.16030 | 1018.75515 | 171.34687 | |||||
| CH3CCD | 218.00760 | 47.28557 | 143.50905 | ||||
| 218.02754 | 24.27496 | 107.38842 | |||||
| 218.04350 | 24.78309 | 78.48706 | |||||
| SO2 | 216.64330 | 35.25156 | 248.44117 | ||||
| 33SO | , | 217.82718 | 10.19653 | 34.67135 | |||
| H2S | 216.71043 | 2.03714 | 83.97932 | ||||
| SiS | 217.81766 | 36.12197 | 67.95393 |
4 Data analysis
The rotation temperatures and fractional abundances of complex molecules can reflect immediate environments close to the stars or star-forming cores, but also can provide key clues in understanding formation mechanism of the specific molecules. In order to obtain reasonable parameters, we use the XCLASS to estimate the column densities and rotation temperatures of the molecules.
4.1 XCLASS analysis
The XCLASS accesses the CDMS (Müller at al. 2001, Müller et al. 2005; http://www.cdms.de) and JPL to get necessary molecular essential parameters (Pickett et al. 1998; http://spec.jpl.nasa.gov). Under the assumption of local thermodynamic equilibrium (LTE), the XCLASS takes source size, beam filling factor, line profile, line blending, background temperature, excitation and opacity into account when solving radiative transfer equation. The detailed fitting functions and modeling procedures are described in papers by Zernickel et al. (2012) and Möller, Endres & Schilke (2015). The source sizes of these species are measured by use of two dimension Gaussian fitting to the gas emission of specific molecule. In the LTE calculation, we fix the line width and peak velocity unchanged, and set different rotation temperatures and column densities to simulate the observed spectra. The reasonable parameters were determined when the simulated spectra have same line profiles as the observed ones (see red curve of Figure 2).
The column densities and rotation temperatures of 17 species and their isotopologues are obtained from our LTE calculation, and the results are summarized in Table 2. Column (1) lists the molecular name, column (2) and (3) present the column density and rotation temperature, respectively.
| Molecule | |||
|---|---|---|---|
| (cm-2) | (K) | ||
| CH3OH | 138 | ||
| 3CH3OH | 138 | ||
| C2H5OH | 140 | ||
| CH3OCH3 | 140 | ||
| CH3COCH3 | 140 | ||
| H2CO | 110 | ||
| CH3OCHO | 138 | ||
| CH2CHCN | 140 | ||
| CH3CH2CN | 140 | ||
| HC3N | 105 | ||
| HCC13CN | 1.2 | 105 | 1.9 |
| SO2 | 180 | ||
| 33SO | 170 | ||
| H2S | 143 | ||
| SiS | 130 | ||
| CH3CCD | 130 | ||
| DCN | 138 |
From Table 2, the rotation temperatures of oxygen-bearing molecules range from 110 to 140 K, while nitrogen-bearing molecules have rotation temperatures ranging from 105 to 140 K, which is consistent with that derived from the transitions of CH3CN (Zhang, Ho & Ohashi 1998). The similar gas temperatures and distributions between oxygen- and nitrogen-bearing molecules (see §3.3) suggest that oxygen-bearing and nitrogen-bearing molecules are well mixed and originate from the same physical environments. The scenario is inconsistent with the observations toward the massive star-forming regions of Orion-KL and G19.61-0.23, in which nitrogen-bearing molecules have higher temperatures than oxygen-bearing molecules and oxygen- and nitrogen-bearing molecules peak at different positions (Blake et al. 1987; Qin et al. 2010). The sulfur-bearing molecules have gas temperatures ranging from 130 to 180 K. The sulfur-bearing molecules have been proved to be a probe of outflows or shocks. The outflow motions are identified in W51 North region (Zapata et al. 2008). The higher gas temperature of the sulfur-bearing molecules in W51 North may be caused by outflow heating.
There are obvious difference in the column densities between the oxygen-bearing and nitrogen-bearing molecules (see Table 2). The column densities of oxygen-bearing molecules range from to cm-2. While the column densities of the nitrogen-bearing molecules range from to cm-2.
4.2 Abundance and isotopic ratio
The fractional abundance of the observed molecules relative to H2 are estimated by use of the expression, , and summarized in column (4) of Table 2, where is column density of specific molecule and is the column density of H2. The oxygen-bearing molecules have relatively higher abundances at a range of to , while the nitrogen-bearing molecules have abundances ranging from to . Previous observations of massive star-forming regions also showed that the oxygen-bearing molecules have higher abundances but lower temperatures than the nitrogen-bearing molecules (e. g., Blake et al. 1987; Wyrowski et al. 1999; Qin et al. 2010). The chemical model proposed by Rodgers & Charnley (2001) suggested that hot-core composition (O-rich or N-rich) depends on core temperature and the ammonia/methanol ratio of the evaporated ices, and the timescale of the core formation, in which O-rich cores form first, then become N-rich as temperature rises and evolution. In our case, the oxygen- and nitrogen-bearing molecules peak at same position and have similar temperature, which may be caused by the fact that W51 North is at an early evolutionary stage and the hot core is not very developed, as suggested by dynamical analysis (Zhang, Ho & Ohashi 1998; Zapata et al. 2008, 2009; Zapata, Tang & Leurini 2010).
The CH3OH, HC3N and their isotopologues 13CH3OH, HCC13CN are detected in W51 North. 12C/13C ratios of 21.0 and 23.3 are estimated from CH3OH/13CH3OH and HC3N/HCC13CN, respectively. Based on the relationship of isotope ratios and distance from the Galactic center by Willson & Rood (1994), the 12C/13C ratio of 22 is obtained if one takes the distance of 1.5 kpc to the Galactic center. The consistent 12C/13C ratio from the two methods suggest that the parameters derived from the XCLASS modeling are reasonable.
5 Individual molecules
5.1 Methanol (CH3OH)
Methanol (CH3OH) is a key molecule in the chemical networks linked with the formation of more complex oxygen-bearing organic molecules (Bottinelli et al. 2007; Whittet et al. 2011). Five rotational transitions of methanol have been identified in our observations spanning an upper level energies of K. In addition, we have detected two transitions of CH3OH from vibrational state at frequencies 217.29920 and 217.64286 GHz with upper level energies of 374 and 746 K, respectively. The CH3OH has highest fractional abundance of than other molecules. Higher CH3OH abundance is also observed in other massive star-forming regions (e. g., Qin et al. 2010, 2015; Neill et al. 2014). The higher CH3OH abundance of can not be explained by gas-phase chemical model (Lee, et al. 1996). The gas-phase chemical model suggested that CH3OH can be produced in gas phase via radiative association of CH and H2O at temperature 100 K, giving CH3OH abundance of (Lee et al. 1996). In contrast, the grain chemical model suggested that CH3OH is formed on grain surface via hydrogenation of CO, followed with evaporating from grain surface into gas phase due to temperature increasing, which can produce higher CH3OH abundances. The higher abundance of in our observations favor that this molecule originates from grain surface chemistry (Charnley et al. 2004; Garrod & Herbst 2006).
5.2 Acetone (CH3COCH3)
Acetone (CH3COCH3) had been detected for the first time by Combes et al. (1987) and later confirmed by Snyder et al. (2002). So far acetone (CH3COCH3) was only detected in the hot molecular core Sgr B2(N) (Snyder et al. 2002), the Orion KL hot core (Friedel et al. 2005; Peng et al. 2013), and G24.78+0.08 (Codella et al. 2013). We have identified 13 transitions of CH3COCH3 in W51 North region, spanning a wide energy range of K. The column density of cm-2 and gas temperature of 140 K are estimated by use of the XCLASS, and the higher abundance of is obtained.
Combes et al. (1987) proposed that CH3COCH3 is formed in gas-phase via the radiative association reaction. However Herbst, Giles & Smith (1990) argued that this radiative association reaction is very inefficient to produce observed CH3COCH3 abundance, and this process can only explain the lower abundance of . Recently, the observations of CH3COCH3 toward the Orion-KL have shown that the distribution of CH3COCH3 is similar to N-bearing molecules concentrated at the hot core rather than O-bearing molecules peaked at the Compact ridge, therefore the formation of CH3COCH3 may invoke N-bearing molecules, and grain surface chemistry or high temperature gas-phase chemistry may play important roles (Friedel et al. 2005, 2008; Peng et al. 2013). The well mixed nitrogen- and oxygen-bearing molecules based on gas distributions and temperatures in W51 North indicate that the hot core is not very developed in W51 North and grain surface chemistry and evaporating from grain surface into gas phase may be responsible for the high CH3COCH3 abundance of , since the gas temperature is not so high in W51 North.
Compared to the Sgr B2(N) (Snyder et al. 2002), the Orion-KL (Peng et al. 2013), and G24.78+0.08 (Codella et al. 2013) molecule line cores, W51 North region has higher CH3COCH3 abundance. The CH3COCH3 can be destructed in gas phase by efficient radiative association of H and CH3COCH3 or the collisions of CH3COCH3 and C+ (Combes et al. 1987; Herbst, Giles & Smith 1990). A possible interpretation of higher CH3COCH3 abundance is that unlike the Sgr B2(N), the Orion-KL, and G24.78+0.08, W51 North is at very early stage of massive star formation, and the CH3COCH3 is destructed less and converted into the other molecules in a short time.
5.3 Ethanol (C2H5OH)
We have identified 13 transitions of C2H5OH in W51 North region. These transitions have a wide spread of the upper level energies of K. The C2H5OH has higher abundance of in our observations. Compared to other sources, the C2H5OH abundance of and / 0.32 are much higher than those in other massive star-forming regions (Ohishi et al. 1995; Qin et al. 2010; Bisschop et al. 2007). Hence W51 North is a very ethanol-rich source.
The gas-phase chemical reaction via ion-molecule reaction predicted C2H5OH abundance of (Leung, Herbst & Huebenr 1984). Higher abundance of in our observations can’t be explained by pure gas-phase chemical model. The grain chemistry suggested that C2H5OH can be formed on the grain surface via hydrogenation of CH3CO (Charnley et al. 2004; Ohishi et al. 1995), and the model predicted high C2H5OH abundance of within yr after evaporated from the grain surface into gas phase. Our result appears to support that the C2H5OH is synthesized on grain surface (Ohishi et al. 1995; Charnley et al. 1995).
5.4 Dimethyl ether (CH3OCH3) and Methyl formate (CH3OCHO)
Four transitions of CH3OCH3 are detected in W51 North. We estimated its rotation temperature of 140 K and column density of cm-2 from the XCLASS calculation. The abundance ratio of / is approximately 0.24. The / ratios have a great deal of changes from source to source (Fontani et al. 2007; Qin et al. 2010; Millar et al. 1988; Schilke et al. 1997; Bisschop et al. 2007). Although CH3OCH3 is isomer of C2H5OH, the abundances of C2H5OH and CH3OCH3 are not well correlation, suggesting that they have different chemical route, and do not have same ’parent’ molecules.
As one of large oxygen-bearing molecules, CH3OCHO has been reported in many hot molecular cores and corinos (Blake et al. 1987; Hatchell et al. 1998; Nummelin et al. 2000; Cazaux et al. 2003; Bottinelli et al. 2004). Sixteen transitions of CH3OCHO are identified in W51 North, spanning a upper energy level range of K. High fractional abundance of is obtained. Gas temperature, column density and spatial distribution of CH3OCHO are similar to those of CH3OCH3 (see Table 2 and Figure 3). Similar case is also seen in Orion-KL, in which the distributions of CH3OCHO and CH3OCH3 present a striking similarity, and the two species have comparable gas temperature and column density (Brouillet et al. 2013), suggesting that CH3OCHO and CH3OCH3 may be chemically related and have similar formation mechanism (Brouillet et al. 2013).
Charnley, Tielens & Millar (1992) proposed that CH3OCH3 and CH3OCHO can be formed in gas phase chemistry via molecule-ion reaction of CH3OH with CH3OH and H2CO, respectively. Their model predicted high abundance of for CH3OCH3 and CH3OCHO at age of yr. Our results appear to favor the gas-phase formation routes of CH3OCH3 and CH3OCHO by Charnley, Tielens & Millar (1992).
5.5 Vinyl cyanide (CH2CHCN) and Ethyl cyanide (CH3CH2CN)
We have identified 9 CH2CHCN transitions with upper level energies Eu of K. The column density of cm-2 and the rotation temperature of 140 K are obtained. Three CH3CH2CN transitions with upper level energies Eu of K are identified. The column density of cm-2 and rotation temperature of 140 K are estimated by use of the XCLASS.
CH2CHCN and CH3CH2CN have same temperature of 140 K, while CH3CH2CN has higher column density than CH2CHCN. Previous observations suggested that the abundances of two molecules are strongly correlated (Fontani et al. 2007). / in W51 North is approximate 0.35 which agrees well with abundance correlation of CH3CH2CN and CH2CHCN in other star-forming regions (Fontani et al. 2007) and CH2CHCN may be formed through gas phase reactions involving CH3CH2CN (Caselli, Hasegawa & Herbst 1993). While CH3CH2CN can be formed by successive hydrogenation of HC3N on dust grains and released into the gas phase as temperature rises (Blake et al. 1987; Caselli, Hasegawa & Herbst 1993). The ratio of / 10 in our observations is consistent with the model prediction of grain surface chemistry (Blake et al. 1987).
5.6 Deuterated molecules
We have detected one transition of the deuterated species of hydrogen cyanide (DCN), in W51 North. The column density of cm-2 is estimated, which is much larger than those in other sources associated with UC Hii regions (Hatchell, Millar & Rodgers 1998). The deuterated species are thought to be synthesized at the early evolutionary stage of star formation (Miettinen, Hennemann & Linz 2011). Previous studies suggested that DCN can be formed via D-H substitution of the HCN or the reaction of CHD with N on the grain mantles and then be released into the gas-phase, while DCN can be destroyed with temperature increasing (Schilke et al. 1992; Hatchell, Millar & Rodgers 1998). Hence the larger abundance observed in W51 North is not a surprise and suggests that it may be synthesized at the early evolutionary stages of star formation.
As isotopomer of methyl acetylene CH2DCCH has been reported in the dark cloud TMC-1 CP by Gerin et al. (1992), and CH3CCD had been successfully detected in same region by Markwick et al. (2005). So far the CH3CCD has been less reported in other massive star formation regions. Therefore CH3CCD is an important molecule for investigating the difference of physical and chemical environments between the dark clouds and hot molecular cores. We have successfully identified 3 transitions of CH3CCD with Eu ranging from 78 to 143 K. Higher CH3CCD abundance of and temperature of 130 K compared to dark clouds (Markwick et al. 2005) are estimated, which may indicate that CH3CCD is synthesized on grain surface and release to gas phase as temperature increases.
5.7 Silicon monosulfide (SiS)
One transition of SiS (J=12–11) at 217.81766 GHz is identified, and the estimated column density and abundance are cm-2 and , respectively. So far this species is only detected in carbon star IRC+10216, Sgr B2(N), Sgr B2(M) and Sgr B2(OH) (Bieging & Nguyen 1989; Turner 1991; Belloche et al. 2013). The column density of cm-2 is higher than cm-2 in Sgr B2. While the factional abundance of in W51 North is lower than in the carbon star, IRC+10216. The abundance difference of four order of magnitude may be caused by the different physical and chemical environments in massive star formation regions and the asymptotic giant branch star.
5.8 Sulfur-bearing molecules
Sulfur-bearing molecules of H2S and SO2 are observed in W51 North, with higher gas temperature than other molecules. The fractional abundances of SO2 and H2S are and , respectively. The ratio of / is appropriately 0.05, which is same order of magnitude as those in massive protostar cores (Herpin et al. 2009), which is consistent with chemical model that H2S can be formed on the grain surface and H2S is converted to SO first, then the SO is converted to SO2 as temperature rises (Charnley 1997; Wakelam et al. 2004; Woods et al. 2015).
6 SUMMARY
We present the Submillimeter Array (SMA) observations of molecular lines
in two 2 GHz-wide bands centered at 217.5 and 227.5 GHz, toward massive
star forming region W51 North. We identified 84 transitions from 17 species,
including oxygen-, nitrogen- and sulfur-bearing molecules.
Our main conclusions are as follows:
1. The gas distributions of both oxygen-bearing and
nitrogen-bearing molecules show a compact core concentrated on the strongest continuum
source, which indicates that nitrogen- and oxygen-bearing molecules are
well-mixed in space in W51 North region.
2. Under the assumption of local thermodynamic equilibrium, the
molecular rotation temperatures and column densities are estimated by use of
the XCLASS program. The oxygen-bearing molecules have higher
fractional abundance than the nitrogen-bearing molecules. The rotation
temperatures range from 100 to 200 K, suggesting that the molecular
emissions originate from warm environments.
3. Thirteen transitions of CH3COCH3 are identified. Higher
fractional abundance of CH3COCH3 are obtained in W51 North when compared
to the other massive star-forming regions, e.g. Sgr B2(N), Orion KL,
G24.78+0.08. These results seem to indicate that CH3COCH3 is
synthesized on grain surface at the early evolutionary stage of massive star formation.
4. Higher fractional abundance of CH3OH and C2H5OH are
obtained, which cannot explained by gas phase reactions and the two molecules
may be synthesized on grain surface. /
0.32 are much higher than those in other massive
star-forming regions, and W51 North is a very ethanol-rich source.
5. Similar gas distribution, rotation temperature and abundance
between CH3OCHO and CH3OCH3 suggest that they may be chemically related
and have similar formation mechanism. The two molecules may originate
from gas phase chemistry.
6. / in W51 North
agrees well with abundance correlation
of CH3CH2CN and CH2CHCN in other star-forming
regions. CH3CH2CN can be formed
by successive hydrogenation of HC3N on dust grains while CH2CHCN may be formed
through gas phase reactions involving CH3CH2CN.
7. CH3CCD and SiS have been less reported in other star-forming regions. Higher fractional abundances of CH3CCD and SiS are estimated in W51 North region.
Acknowledgments
We thank the anonymous referee, and editor Morgan Hollis for their constructive comments on the paper. This work has been supported by the National Natural Science Foundation of China under grant Nos. 11373026, 11373009, 11433004, 11433008, U1331116, and the National Basic Research Program of China (973 Program) under grant No. 2012CB821800, by Top Talents Program of Yunnan Province and Midwest universities comprehensive strength promotion project (XT412001, Yunnan university).
References
- Belloche et al. (2013) Belloche A., Müller H. S. P., Menten K. M., Schilke P., Comito, C., 2013, A&A, 559, A47
- Bieging et al. (1989) Bieging J. H., Nguyen Q. -R., 1989, ApJ, 343, L25
- Bisschop et al. (2007) Bisschop S. E., Fuchs G. W., van Dishoeck E. F., Linnartz H., 2007, A&A, 474, 1061
- Blake et al. (1987) Blake G. A., Sutton E. C., Masson C. R., Phillips T. G., 1987, ApJ, 315, 621
- Bottinelli et al. (2007) Bottinelli S., Boogert A. C. A., van Dishoeck E. F., Oberg K., Pontoppidan K. M., Blake G. A., Evans N. J., Lahuis F., 2007, msl, confE, 11
- Bottinelli et al. (2004) Bottinelli S. et al., 2004, ApJ, 615, 354
- Brouillet et al. (2013) Brouillet N. et al., 2013, A&A, 550, A46
- Caselli et al. (1993) Caselli P., Hasegawa T. I., Herbst E., 1993, ApJ, 408, 548
- Cazaux et al. (2003) Cazaux S., Tielens A. G. G. M., Ceccarelli C., Castets A., Wakelam V., Caux E., Parise B., Teyssier D., 2003, ApJ, 593, L51
- Charnley et al. (1995) Charnley S. B., Kress M. E., Tielens A. G. G. M., Millar T. J., 1995, ApJ, 448, 232
- Charnley et al. (1997) Charnley S. B., 1997, ApJ, 481, 396
- Charnley et al. (2004) Charnley S. B., Ehrenfreund P., Millar T. J., Boogert A. C. A., Markwick A. J., Butner H. M., Ruiterkamp R., Rodgers S. D., 2004, MNRAS, 347, 157
- Charnley et al. (1992) Charnley S. B., Tielens A. G. G. M., Millar T. J., 1992, ApJ, 399, L71
- Codella et al. (2013) Codella C., Beltrán M. T., Cesaroni R., Moscadelli L., Neri R., Vasta M., Zhang Q., 2013, A&A, 550, A81
- Combes et al. (1987) Combes F., Gerin M., Wootten A., Wlodarczak G., Clausset F., Encrenaz P. J., 1987, A&A, 180, L13
- Downes et al. (1979) Downes D., Genzel R., Moran J. M., Johnston K. J., Matveenko L. I., Kogan L. R., Kostenko V. I., Ronnang B., 1979, A&A, 79, 233
- Fontani et al. (2007) Fontani F., Pascucci I., Caselli P., Wyrowski F., Cesaroni R., Walmsley C. M., 2007, A&A, 470, 639
- Friedel et al. (2008) Friedel D. N., Snyder L. E., 2008, ApJ, 672, 962
- Friedel et al. (2005) Friedel D. N., Snyder L. E., Remijan A. J., Turner B. E., 2005, ApJ, 632, 95
- Garrod et al. (2006) Garrod R. T., Herbst E., 2006, A&A, 457, 927
- Gerin et al. (1992) Gerin M., Combes F., Wlodarczak G., Encrenaz P., Laurent C., 1992, A&A, 253, L29
- Hatchell et al. (1998a) Hatchell J., Millar T. J., Rodgers S. D., 1998, A&A, 332, 695
- Hatchell et al. (1998b) Hatchell J., Millar T. J., Thompson M. A., Macdonald G., 1998, A&AS, 133, 29
- Herbst et al. (1990) Herbst E., Giles K., Smith D., 1990, ApJ, 358, 468
- Herbst et al. (2009) Herbst E., van Dishoeck E. F., 2009, ARA&A, 47, 427
- Hern et al. (2014) Hernández-Hernández V., Zapata L. A., Kurtz S., Garay G., 2014, ApJ, 786, 38
- Herpin et al. (2009) Herpin F., Marseille M., Wakelam V., Bontemps S., Lis D. C., 2009, A&A, 504, 853
- Imai et al. (2002) Imai H., Sasao T., Kameya O., Watanabe T., Omodaka T., Nishio M., Asaki Y., Nakajima J., 2002, IAUS, 206, 88
- Lee et al. (1996) Lee H. -H., Herbst E., Pineau des Forets G., Roueff E., Le Bourlot J., 1996, A&A, 311, 690
- Leung et al. (1984) Leung C. M., Herbst E., Huebner W. F., 1984, ApJS, 56, 231
- Lis et al. (1991a) Lis D. C., Carlstrom J. E., Keene J., 1991, ApJ, 380, 429
- Lis et al. (1991b) Lis D. C., Goldsmith P. F., 1990, ApJ, 356, 195
- Markwick et al. (2005) Markwick A. J., Charnley S. B., Butner H. M., Millar T. J., 2005, ApJ, 627, L117
- Miettinen et al. (2011) Miettinen O., Hennemann M., Linz H., 2011, A&A, 534, A134
- Millar et al. (1988) Millar T. J., Brown P. D., Olofsson H., Hjalmarson A., 1988, A&A, 205, L5
- Moller et al. (2015) Möller, T., Endres, C., & Schilke, P. 2015, accepted by A&A
- Muller et al. (2005) Müller H. S. P., Schlöder F., Stutzki J., Winnewisser G., 2005, JMoSt, 742, 215
- M et al. (2001) Müller H. S. P., Thorwirth S., Roth D. A., Winnewisser G., 2001, A&A, 370, L49
- Neill et al. (2014) Neill J. L. et al., 2014, ApJ, 789, 8
- Nummelin et al. (2000) Nummelin A., Bergman P., Hjalmarson Å., Friberg P., Irvine W. M., Millar T. J., Ohishi M., Saito S., 2000, ApJS, 128, 213
- Ohishi et al. (1995) Ohishi M., Ishikawa S. -I., Yamamoto S., Saito S., Amano T., 1995, ApJ, 446, L43
- Ossenkopf (1994) Ossenkopf, V., & Henning, T. 1994, A&A, 291, 943
- Peng et al. (2013) Peng T. -C. et al., 2013, A&A, 554, A78
- Pickett et al. (1998) Pickett H. M., Poynter R. L., Cohen E. A., Delitsky M. L., Pearson J. C., Müller H. S. P., 1998, JQSRT, 60, 883
- Qin et al. (2015) Qin S. -L., Schilke P., Wu J. W., Wu Y. F., Liu T., Liu Y., Sánchez-Monge Á., 2015, ApJ, 803, 39
- Qin et al. (2010) Qin S. -L., Wu Y. F., Huang M. H., Zhao G., Li D., Wang J. -J., Chen S., 2010, ApJ, 711, 399
- Remijan et al. (2004) Remijan A., Shiao Y. -S., Friedel D. N., Meier D. S., Snyder L. E., 2004, ApJ, 617, 384
- Rodgers et al. (2001) Rodgers S. D., Charnley S. B., 2001, APJ, 546, 324
- Schilke et al. (1992) Schilke P., Walmsley C. M., Pineau Des Forets G., Roueff E., Flower D. R., Guilloteau S., 1992, A&A, 256, 595
- Schilke et al. (1997) Schilke P., Groesbeck T. D., Blake G. A., Phillips T. G., 1997, ApJS, 108, 301
- Snyder et al. (2002) Snyder L. E., Lovas F. J., Mehringer D. M., Miao N. Y., Kuan Y. -J., Hollis J. M., Jewell P. R., 2002, ApJ, 578, 245
- Turner et al. (1991) Turner B. E., 1991, ApJS, 76, 617
- Wakelam et al. (2004) Wakelam V., Caselli P., Ceccarelli C., Herbst E., Castets A., 2004, A&A, 422, 159
- Whittet et al. (2011) Whittet D. C. B., Cook A. M., Herbst E., Chiar J. E., Shenoy S. S., 2011, ApJ, 742, 28
- Wilson et al. (1994) Wilson T. L., Rood R., 1994, ARA&A, 32, 191
- Woods et al. (2015) Woods P. M., Occhiogrosso A., Viti S., Kaňuchová Z., Palumbo M. E., Price S. D., 2015, MNRAS, 450, 1256
- Wyrowski et al. (1999) Wyrowski F., Schilke P., Walmsley C. M., Menten K. M., 1999, ApJ, 514, L43
- Xu et al. (2009) Xu, Y., Reid, M. J., Menten, K. M., et al. 2009, ApJ, 693, 413
- Zapata et al. (2009) Zapata L. A., Ho P. T. P., Schilke P., Rodríguez L. F., Menten K., Palau A., Garrod R. T., 2009, ApJ, 698,1422
- Zapata et al. (2008) Zapata L. A., Palau A., Ho P. T. P., Garrod R. T., Rodríguez L. F., Menten K., 2008, A&A, 479, L25
- Zapata et al. (2010) Zapata L. A., Tang Y. -W., Leurini S., 2010, ApJ, 725, 1091
- Zapata et al. (2015) Zapata, L. A., Palau, A., Galván-Madrid, R., et al. 2015, MNRAS, 447, 1826
- Zernickel et al. (2012) Zernickel, A., Schilke, P., Schmiedeke, A., et al. 2012, A&A, 546, 87
- Zinnecker et al. (2007) Zinnecker H., Yorke H. W., 2007, ARA&A, 45, 481
- Zhang et al. (1998) Zhang Q. Z., Ho P. T. P., Ohashi N., 1998, ApJ, 494, 636