Hierarchical gravitational fragmentation. I. Collapsing cores within collapsing clouds
Abstract
We investigate the Hierarchical Gravitational Fragmentation scenario through numerical simulations of the prestellar stages of the collapse of a marginally gravitationally unstable isothermal sphere immersed in a strongly gravitationally unstable, uniform background medium. The core developes a Bonnor-Ebert (BE)-like density profile, while at the time of singularity (the protostar) formation the envelope approaches a singular-isothermal-sphere (SIS)-like density profile. However, these structures are never hydrostatic. In this case, the central flat region is characterized by an infall speed, while the envelope is characterized by a uniform speed. This implies that the hydrostatic SIS initial condition leading to Shu’s classical inside-out solution is not expected to occur, and therefore neither should the inside-out solution. Instead, the solution collapses from the outside-in, naturally explaining the observation of extended infall velocities. The core, defined by the radius at which it merges with the background, has a time-variable mass, and evolves along the locus of the ensemble of observed prestellar cores in a plot of vs. , where is the core’s mass and is the critical Bonnor-Ebert mass, spanning the range from the “stable” to the “unstable” regimes, even though it is collapsing at all times. We conclude that the presence of an unstable background allows a core to evolve dynamically from the time when it first appears, even when it resembles a pressure-confined, stable BE-sphere. The core can be thought of as a ram-pressure confined BE-sphere, with an increasing mass due to the accretion from the unstable background.
1 Introduction
1.1 The scenario of hierarchical gravitational collapse
Molecular clouds (MCs) are associated with the bulk of star formation in the Galaxy. With supersonic linewidths (Wilson et al., 1970) that scale as R1/2, where R is the cloud’s radius (Larson, 1981; Solomon et al., 1987), and low star formation efficiencies (Myers et al., 1986). MCs have traditionally been interpreted as being in a global state of virial equilibrium between supersonic turbulence and self-gravity. On the smallest scales, when the density increases, the turbulence is believed to dissipate, allowing collapse to proceed (Goodman et al., 1998; Tafalla et al., 2002; Pineda et al., 2010).
However, recent numerical studies suggest that the picture of gravitational collapse is not limited to the scale of dense cores, but instead may extend to the scale of the whole cloud (e.g. Vázquez-Semadeni et al., 2007, 2009, 2010, 2011; Heitsch & Hartmann, 2008; Heitsch et al., 2008). Moreover, several observational studies have shown that gravitational collapse extends at least to parsec scales (e.g. Galván-Madrid et al., 2009; Schneider et al., 2010; Polychroni et al., 2013; Peretto et al., 2013). Finally, Ballesteros-Paredes et al. (2011), extending the data presented by Heyer et al. (2009), have shown that the energy budget of giant molecular clouds (GMCs) and high-mass star-forming clumps alike is consistent with generalized free-fall in these structures. In this case, what has been previously interpreted as virialization, may just as well be interpreted as free-fall, within the uncertainties, and in fact, the data are marginally more consistent with free-fall than with virial equilibrium.
In addition, recent observations (e.g. Gutermuth et al., 2008; Myers, 2009; André et al., 2010; Men’shchikov et al., 2010; Molinari et al., 2010; Arzoumanian et al., 2011) have revealed a vast network of filaments everywhere inside the MCs, feeding the clumps and the dense cores. Numerical simulations of cloud formation (e.g. Burkert & Hartmann, 2004; Hartmann & Burkert, 2007; Heitsch et al., 2009; Vázquez-Semadeni et al., 2007, 2009, 2011; Gómez & Vázquez-Semadeni, 2014) also exhibit such filamentary structure, and Gómez & Vázquez-Semadeni (2014) and Smith et al. (2014) have interpreted it as the consequence of anisotropic, large-scale gravitational collapse in the clouds. Observations of the kinematics in the filaments (Schneider et al., 2010; Kirk et al., 2013; Peretto et al., 2014) are consistent with the kinematics seen in those simulations.
In the scenario of global hierarchical gravitational collapse and fragmentation, then, the entire cloud is gravitationally collapsing. This is possible because of the coherent production of cold atomic gas over large scales by large-scale shock-compressed layers in the warm, diffuse medium, which trigger thermal instability and a phase transition to the cold phase (Ballesteros-Paredes et al., 1999; Hennebelle & Pérault, 1999; Koyama & Inutsuka, 2000, 2002; Audit & Hennebelle, 2005; Heitsch et al., 2005; Vázquez-Semadeni et al., 2006). The cold cloud formed by this mechanism is supersonically turbulent, albeit, only moderately. Within these large-scale unstable clouds, small-scale, nonlinear density fluctuations produced by turbulence terminate their collapse before the cloud at large does, because their free-fall times are shorter (Heitsch & Hartmann, 2008). This implies that the clumps and cores constitute smaller-scale collapse events embedded within larger-scale ones (at the whole cloud scale), amounting to a hierarchical state of collapse that is moreover chaotic (with multiple collapse centers and irregular geometries). Thus, in this paper we investigate the collapse of an unstable core embedded in a larger, also unstable cloud.
1.2 Core collapse theory
Within this scenario of global, multi-scale collapse, it is pertinent to re-examine some classical and recent works on the collapse of dense cores. The seminal works of Larson (1969) and Penston (1969), to which we collectively refer to as LP, independently found solutions in which collapse proceeds outside-in, developing an density profile in the core envelope and a velocity profile that approaches a constant value as the core accretes mass from its envelope. Larson (1969) considered uniform initial densities, while Penston (1969) considered slightly centrally-condensed density configurations. Thus, they considered the collapse starting from times earlier than the development of a singularity (the protostar).
Shu (1977, hereafter S77) studied this problem analytically, adopting a singular isothermal sphere (SIS) as the initial equilibrium condition. This implies that he only considered the evolution starting from the time of protostar formation. He assumed that the SIS is somehow destabilized at , causing the innermost regions to begin collapsing, and producing a rarefaction wave that propagates outwards, leaving a free-falling (, ) region behind it, while the region outside the front remains static. This is the well-known “inside-out” collapse solution, which is generally assumed to represent the velocity field inside the cores.
Some time later, Whitworth & Summers (1985, hereafter WS85) investigated the parameter space of the initial conditions, finding that the latter can be parametrized by the initial density and the mass at the centre of the collapsing cloud. WS85 broadly divided these solutions in three bands (see Fig. 2 of that paper), considering, in general, the contraction from times earlier than the formation of the singularity. In particular, they noted that, if the collapsing core starts out very far from equilibrium, it starts to contract immediately at all radii. In this case, the overall evolutionary pattern consists of a compression wave that starts far from the core’s center and propagates inwards. This wave front divides the core into an inner (, where is the instantaneous radial position of the front) and an outer () region. The transition between the two regions is smooth, in spite of the fact that eventually supersonic speeds develop in the outer region. The density profile in the inner region is nearly uniform, while outside of the front it decays as . The velocity profile is linear with radius in the inner region, and uniform in the outer region. When the wave front reaches the center, a point of finite mass is formed at the center (the protostar), and a rarefaction wave propagates outward, leaving behind free-fall density and velocity profiles.
Using numerical simulations, Foster & Chevalier (1993, hereafter FC93) investigated the collapse of thermal-pressure bounded spheres near hydrostatic equilibrium, finding results consistent with the LP solution, and confirming that supersonic velocities develop in the outer region, and eventually reach the center. More recently, Simpson et al. (2011) have suggested that prestellar cores accrete quasi-statically until they reach their Jeans mass, and from that point onwards the cores collapse dynamically. However, if the core is accreting it is hard to understand why it would be hydrostatic out to a certain radius in the first place. Mohammadpour & Stahler (2013, hereafter MS13; see also Vorobyov & Basu 2005) have explored a new set of boundary conditions for the problem, using inflow boundaries, across which gas enters subsonically, representing accretion onto the core. They again found that supersonic velocities develop near the time of protostar formation, and concluded that such a setup may not be realistic, and that magnetic support may be necessary in order to prevent supersonic infall velocities at the time of protostar formation, as seemingly required by observations that low-mass cores generally have subsonic infall velocities (e.g., Lee et al., 1999, 2001; Tafalla et al., 2004; Pineda et al., 2010).
In addition, there is the well-known “luminosity problem” (e.g., Kenyon et al., 1990) for Class 0 and Class I sources, namely that their low luminosities would imply low accretion rates, and therefore low infall speeds, if the material were to accrete directly onto the protostellar surface. However, a number of authors (e.g., Kenyon & Hartmann, 1995; Whitworth & Ward-Thompson, 2001; Dunham & Vorobyov, 2012) have argued that this problem can be solved if the accretion of material does not occur directly onto the protostar, but first onto a disk and from there onto the protostar, and in an episodic rather than uniform manner. Therefore, in this paper we shall not be concerned with the luminosity problem.
1.3 Starless and prestellar cores
Traditionally, dense cores within MCs have been classified as belonging to either of two main sub-classes, namely starless and protostellar, depending on whether they lack or contain protostellar objects, respectively. The “starless” class includes both cores that may never form stars as well cores that will eventually do so; the latter are called “prestellar”, and operationally defined as a gravitationally bound starless core (e.g., André et al., 2014). Starless cores that appear unbound are thought to require external pressure confinement (e.g., Bertoldi & McKee, 1992; Lada et al., 2008). Interestingly, Foster et al. (2009) found that almost all cores in Perseus, even prestellar cores, seem to be gravitationally bound (see Fig. 11 in their paper), although it should be noted that Perseus cores are more massive than those in the Pipe Nebula, which appear pressure-confined (e.g., Lada et al., 2008). As already mentioned in Sec. 1.2, prestellar cores exhibit infall profiles suggesting subsonic infall velocities (Lee et al., 1999, 2001; Tafalla et al., 2004), although Lee et al. (2001) noted that the inward motions are too extended to be consistent with the inside-out collapse model of S77.
Observations (e.g., Alves et al., 2001; Lada et al., 2007) have shown that prestellar cores have a Bonnor-Ebert (BE)-like (Ebert, 1955, 1957; Bonnor, 1956) density profile which is nearly flat in the innermost region, while at larger radii resembles a SIS density profile (). It is worth noting that these profiles represent, respectively, the regular and singular solutions of the Lane-Emden equation of hydrostatic balance, although there have been suggestions that cores formed by strong turbulent compressions can also evolve along a sequence of BE-like density profiles (Ballesteros-Paredes et al., 2003; Gómez et al., 2007; Gong & Ostriker, 2009). On the other hand, Keto et al. (2015) have concluded, by comparing synthetic line profiles of several different models of gravitational collapse with observations of the L1544 core, that only the quasi-equilibrium contraction of an unstable BE-sphere (Keto & Caselli, 2010) is consistent with the observations. However, in this case, the initial BE-like profile is an assumed initial condition, rather than an outcome of the simulations.
1.4 This work
In the present paper, we investigate a more unified scenario of the gravitational collapse of cores based on the notion that MCs are collapsing as a whole, and that cores form, grow and collapse within this globally collapsing environment. We start with a generic low-amplitude gaussian density fluctuation, to which we refer to as “the core”, embedded within an unstable uniform density distribution, to which we will refer to as “the cloud”, allowing the core to develop its density and velocity profiles self-consistently as it grows within the medium, thus relaxing any initial assumptions about those profiles. This study can be considered an extension of the work of MS13, by allowing the presence of a large envelope of uniform density, which represents the “background” often present in observations of cores (e.g., André et al., 2014).
The paper is structured as follows: In §2 we describe the numerical simulation. The results from the simulations are described in §3. In §4.1 we compare the results of the simulation with observations, in particular in terms of the locus of observed cores in a diagram describing core stability, while in §4.2, we discuss the evolution of the dense cores in the context of earlier analytical solutions. Next, in §4.3 we discuss some implications of our results. Finally, in §5 we present a summary and some conclusions.
2 The simulations
We have performed numerical simulations of the collapse of a spherically symmetric clump inside a collapsing cloud, using a spectral, fixed mesh numerical code (Léorat et al., 1990; Vázquez-Semadeni et al., 2010). Because sink particles have not been implemented into this code, and because it cannot follow very large gradients in the variables, we limit our study to the prestellar stage of the evolution of the dense core collapse. However, this is sufficient for investigating the development of the initial conditions for star formation.
We consider an isothermal gas with a mean density of , a mean particle weight of 2.36, and a kinetic temperature of T=, implying an isothermal sound speed in a numerical box with periodic boundaries. The gas is initially at rest and no gravity-counteracting forces such as a magnetic field or small-scale turbulence are included, so the gas is strongly Jeans-unstable. We choose the box side as pc, where is the Jeans length. The box mass is .
The initial density field consists of a uniform background with , on top of which we have added a density fluctuation with a Gaussian profile, whose peak is at the box center and has a density (or above the mean) and a FWHM . Because the fluctuation is small in size () and mass (), the background density is almost the same as the mean density, which is exactly . The free-fall time for the background density is . The evolution proceeds on a timescale longer than because the initial gradient of the gravitational potential is very mild and of the periodic boundary conditions. Our initial setup is within ’band ’ of WS85, which corresponds to clouds that are initially centrally peaked, far from hydrostatic equilibrium and collapsing immediately (the LP solutions also fall within this band, as noted by WS85).
We have also tested different sets of parameters for the background density and the central density fluctuation, but the behavior of these collapsing structures is qualitatively the same, and thus we focus only on the simulation described above. The only exception occurs in the cases when the central peak contains less than the local Jeans mass. In these cases, the density peak first expands and then collapses once enough mass has been accreted at the center.
We have chosen this setup inspired by our observation of how fragmentation proceeds in numerical simulations of cloud formation and evolution (e.g., Vázquez-Semadeni et al., 2007, 2009, 2010; Heitsch & Hartmann, 2008; Banerjee et al., 2009; Colín et al., 2013; Gómez & Vázquez-Semadeni, 2014). It has been argued in these papers that a forming GMC (and its atomic precursor) may rapidly acquire a large number of Jeans masses if the converging flow that assembles it is coherent and extended over a large region, as may be expected, for example, in a spiral arm, or in the collect-and-collapse scenario at the border of expanding shells (Elmegreen & Lada, 1977). In this case, Hoyle (1953)-type fragmentation may be expected, where successively smaller scales may go unstable as the mean cloud density increases and the average Jeans mass decreases due to the global collapse in a nearly isothermal medium. The small-scale density fluctuations located far from the trough of the large-scale potential well may start growing locally while simultaneously being transported by the large-scale flow towards the remote collapse center, in a “conveyor belt” mode (see e.g., Longmore et al., 2014; Gómez & Vázquez-Semadeni, 2014). As a first approximation, this type of flow can be represented locally as a static unstable background with a small clump collapsing within it, because the large-scale flow towards the distant global collapse center locally appears as a uniform bulk background motion, which is dynamically irrelevant to the local collapse.
3 Results
In Fig. 1, we show various snapshots from the evolution of the radial profiles of the density (left panel) and the velocity (right panel) of the core and its environment, both with a linear radial axis, to emphasize the external structure of the core and its envelope.
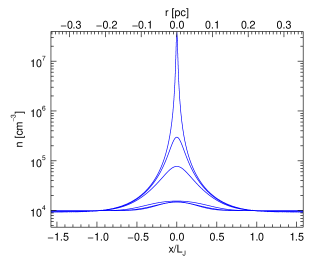
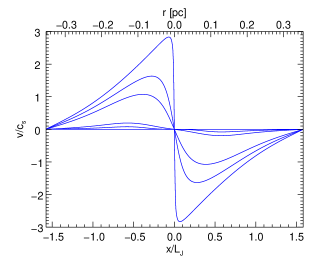
It can be seen from this figure that, by embedding the core in a uniform background medium that is also collapsing, the nature of the collapse deviates from the self-similar asymptotic structure of the prestellar (or pre-singularity) stages of the collapse, such as the LP solutions. The core has a natural, well-defined “boundary”, namely the place where it merges into the background. This boundary increases in radius during the evolution, but the material outside the boundary remains at the background density, and simply develops an inflow velocity that is continuous across the boundary, steadily accreting onto the core. On the other hand, in agreement with previous studies (Larson, 1969; Penston, 1969; Foster & Chevalier, 1993; Mohammadpour & Stahler, 2013), it can also be seen from Fig. 1 that the flow remains subsonic during most of the prestellar evolution, although it eventually becomes supersonic at a so-called sonic point. Subsequently, the sonic point splits into two such points, to which we refer to as the inner and outer sonic points. The inner sonic point approaches the core center as time progresses, and finally reaches it at the time of singularity formation.
| Time | |||||||
|---|---|---|---|---|---|---|---|
| 0.00 | 0.00 | 1.50 | 1.09 | 0.00 | 0.133 | 6.39 | 0.00 |
| 0.46 | 0.16 | 1.49 | 1.10 | 0.08 | 0.130 | 6.18 | 0.08 |
| 0.92 | 0.31 | 1.57 | 1.14 | 0.19 | 0.124 | 5.98 | 0.19 |
| 1.84 | 0.62 | 8.05 | 2.10 | 1.07 | 0.072 | 3.47 | 1.06 |
| 2.01 | 0.67 | 31.43 | 3.61 | 1.63 | 0.043 | 2.09 | 1.56 |
| 2.14 | 0.72 | 4224.50 | 36.10 | 2.83 | 0.003 | 0.19 | 2.07 |
| Time | |||||||||||||
|---|---|---|---|---|---|---|---|---|---|---|---|---|---|
| () | ( Myr) | ( pc) | () | () | () | ( pc) | () | () | () | ( pc) | () | () | () |
| 0.00 | 0.00 | 0.74 | 1.73 | 1.99 | 1.23 | 0.52 | 0.66 | 1.92 | 1.33 | ||||
| 0.69 | 0.73 | 0.05 | 1.81 | 1.49 | |||||||||
| 2.14 | 2.27 | 1.93 | 35.44 | 1.77 | 1.57 | 1.57 | 25.26 | 1.58 | 1.97 | 1.27 | 17.99 | 1.36 | 2.64 |
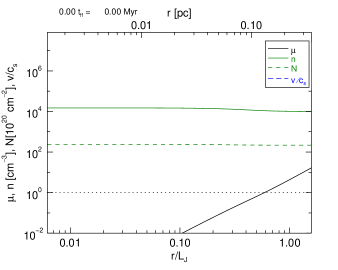
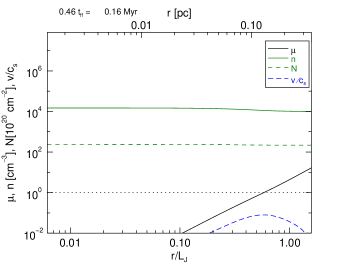
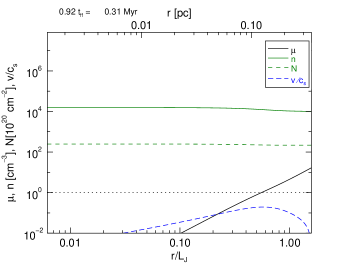
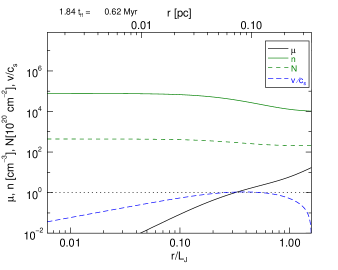
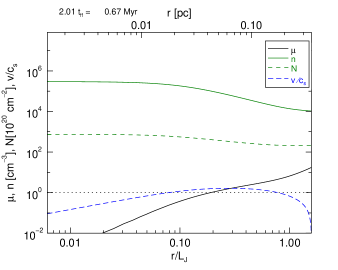
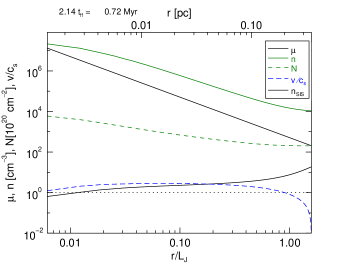
In Fig. 2, we again show the density and velocity profiles at six selected snapshots, together with the average column density and the ratio of the mass to the mean Jeans mass inside each radial position, . In this figure, we use a logarithmic radial axis to emphasize the internal structure of the core. The selected snapshots are: (panel a of Fig. 2), showing the initial conditions; (panel b), where is the free-fall time of the background density. At this time, the gas has developed some moderate velocity in its external parts, near the Jeans point (the radius at which the mass ratio equals unity); (panel c), in which we begin to see a radially linear subsonic velocity profile and a uniform density profile within the region delimited by the Jeans point; (panel d), at which the flow develops a sonic point () at pc, located very close to the Jeans point () at pc; (panel e), at which the transonic point has already split into two points, bounding a region of almost uniform supersonic inward velocity (Mach number ); finally, (panel f), at which the core has an almost uniform supersonic velocity profile everywhere, with Mach number , while the density adopts a power-law profile, with a slope approaching . On the last panel, we have overploted an SIS density profile (solid black line) for comparison to the actual profile of our core, which is clearly more extended than an SIS, although with a slope in its envelope that approaches the slope of the SIS. Table 1 lists various physical properties of the core at the same six selected snapshots as in Fig. 2.
4 Discussion and implications
4.1 Comparison with observations: vs. diagram
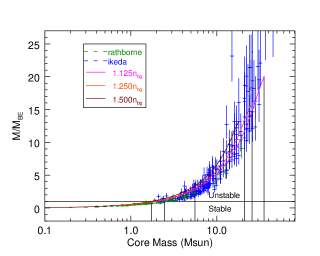
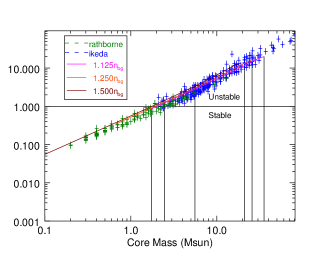
Lada et al. (2008, hereafter L08) studied the stability of the dense core population in the Pipe Nebula region. They defined the cores using an extinction threshold of mag, and derived median values of the density and mass of , –, respectively, and argued that most of the cores are gravitationally unbound and thermal-pressure-confined, with the external pressure provided by the weight of the surrounding MC. They modeled the cores as BE-spheres, assuming a temperature of , in order to determine their stability, finding that the entire population is characterized by a single critical BE-mass () of . Most relevant to our interest here is that they plotted the ratio of the cores’ mass to their BE-mass () vs. the cores’ mass (see their Fig. 9), finding that the observed core sample occupies a well-defined locus in this diagram.
Subsequently, Rathborne et al. (2009, hereafter R09) obtained a more robust determination of the physical properties of the Pipe cores by combining extinction and molecular-line data. They found mean radii , densities , non-thermal velocity dispersions , and masses , so in what follows we use the R09 sample for our discussion. In addition, Ikeda et al. (2007, hereafter I07) have carried out a core survey in the Orion A molecular cloud. They derived core masses in the range of – , with a mean mass of , a mean density , consistent with the critical density of the H13CO+(1-0) transition, and mean velocity dispersions of . This corresponds to a more massive and supersonic core sample than the Pipe sample, and thus offers an interesting complementary set.
In order to compare our simulated core to the observational data, we must precisely define its boundaries. This is one of the most challenging tasks when investigating cores, because the boundaries often depend on circumstantial factors such as the tracer used, the signal-to-noise ratio, the background level, etc. In practice, the core’s boundary is often defined by finding gradient breaks in the column density profiles (e.g., André et al., 2014)—for example, the radial position of the point where the core appears to merge with the background, where the profile changes from a power law (the envelope) to a uniform-density (the background). Our setup, embedding the core in a uniform background, naturally lends itself to this definition. Thus, we operationally define the core’s boundary as the radius at which the density is a certain (small) multiple of the background density. Specifically, we consider density thresholds of , , and times the background density as the boundary of the core.
Figure 3 shows the ratio vs. for the aforementioned observations and for our simulated core throughout its evolution, as defined by the three density thresholds. The times corresponding to the selected snapshots shown in Fig. 2 are indicated by vertical lines. For our core, we compute the BE-mass using the nominal temperature of . For the observational core sample, no explicit temperature information is provided by the authors. R09 assume a gas temperature of 10 K in all cases, while I07 mention that the typical temperature in Orion is , but make no explicit mention that this may be the actual temperature in the dense cores. In fact, it is quite likely that the temperature there is lower, because of the higher densities. Thus, we have calculated the BE-mass for all the observed cores assuming , and assigning error bars whose extremes correspond to and K.
From Fig. 3 we note that the Orion cores from the I07 sample essentially ocuppy the same locus as the Pipe cores from the R09 sample in this diagram, although extending towards higher masses and/or higher values of the mass ratio. Also, we note that the evolutionary track of our core, as defined by the threshold at times the background density, tracks almost exactly the locus of the observed cores. These results strongly suggest that the sequences of observed (both low- and high-mass) cores are all part of a self-similar collapse process, only at different evolutionary stages and total masses, including the apparently stable ones. The latter only appear as stable because they are in an early stage of development, with only a small density contrast over ther background, but they are nevertheless growing, as their entire background is gravitationally unstable.
4.2 Comparison with earlier numerical and analytical collapse studies
In agreement with previous studies (e.g., Larson, 1969; Whitworth & Summers, 1985; Vorobyov & Basu, 2005; Gómez et al., 2007, MS13), the density profile of the simulated prestellar core resembles a BE-sphere at all times, being flat at the center, and developing a power-law at the external parts, to which we refer to as “the envelope”. As the collapse proceeds, the central part increases in density while decreasing in radius. A supersonic region then emerges, bounded by two transonic points that become increasingly distant from each other, one moving inwards and the other outwards, as time progresses. At the latest stages, just before the formation of the protostar, the density profile assumes a SIS-like shape, but truncated at the radius at which the core merges with the background.
These results can be put in the context of early analytical studies on spherical gravitational collapse that have commonly used similarity techniques (Larson, 1969; Shu, 1977; Whitworth & Summers, 1985). As is well known, S77 considered the collapse of a hydrostatic SIS, finding, among others, the classical “inside-out” solution, characterized by a collapsing inner region bounded by an expanding rarefaction wavefront, beyond which the gas is static. Inside the transition front, the core is characterized by density and infall velocity profiles that scale as and , respectively. However, a slightly less well known fact is that S77 discussed, more generally, the large-radius (or early-time) asymptotic behavior of those solutions for which the velocity is not initially zero everywhere, but instead only approaches zero in this limit. These solutions are characterized by an initial density profile of the form
| (1) |
and initial velocity profile given by
| (2) |
where the minus sign indicates that the velocity is directed inwards, is the isothermal sound speed, and is a constant that determines whether the velocity is initially zero and remains at that value (), or instead starts with a finite value and further increases with time (). The former static solution corresponds to a hydrostatic SIS, while the latter dynamic solution corresponds to an SIS-like structure (i.e. with an density profile) but with a larger mass and with an initial inward velocity, so that it is gravitationally unstable and collapses after . In this case, the outer parts of the core are never at rest. It is important to recall that S77 also calculated the accretion rate onto the protostar after the formation of the singularity111In the earlier literature, the moment at which the singularity forms is referred to as “core formation”. Here we avoid this nomenclature in order to avoid confusion with the dense core of the molecular cloud. (the protostar itself) as
| (3) |
where is a constant related to . The “canonical” value, , corresponds to , i.e. to a hydrostatic initial condition. In addition, S77 argued that the earlier similarity solution found by LP was unrealistic because its asymptotic large-radius (or small-time before singularity formation) limit consists of a uniform inward velocity of and a density that is times that of the SIS at each radius, which he deemed “unlikely to occur in a natural way”. However, subsequent analytical and numerical studies (Hunter, 1977; Whitworth & Summers, 1985; Foster & Chevalier, 1993) that considered a larger region in parameter space, showed the existence of a continuum of solutions and, in particular, the numerical simulations of FC93 showed that the LP solution is approached only over a finite radial extent, ameliorating S77’s objection to it.
Moreover, S77’s inside-out solution has been criticized by some authors (e.g. Whitworth et al., 1996; Vázquez-Semadeni et al., 2005) because its initial condition, the hydrostatic SIS, is an unstable equilibrium, onto which it is impossible for the core to settle within the context of a turbulent, dynamic medium such as a molecular cloud. It has also been reported that observations of molecular cloud cores exhibit extended infall radial motions that are inconsistent with the inside-out solution of S77 (e.g. Tafalla et al., 1998; Lee et al., 2001).
Most early numerical simulations considered the case of bounded, marginally gravitationally unstable initial conditions, neglecting the possibility of accretion onto the core during the prestellar phase (prior to the formation of the central singularity). More recently, accretion has been addressed by various groups (Vorobyov & Basu, 2005; Gómez et al., 2007; Gong & Ostriker, 2009, MS13). Gómez et al. (2007) and Gong & Ostriker (2009) considered the formation and collapse or re-expansion of a core formed by a spherically-symmetric compression. They found that cores formed in this way are bounded by an accretion shock, inside of which the core evolves along a sequence of BE-configurations, but with a mass that increases over time due to the accretion until the configuration becomes unstable and collapses, or else rebounds, if the accretion is insufficient to render it Jeans-unstable. On the other hand, MS13 considered a constant accretion flow onto the core, imposed as a boundary condition. Although their simulations behaved very similarly to ours, the accretion they used was imposed rather than self-consistent, and forced to be subsonic at all times.
Very recently, Keto et al. (2015) have investigated the collapse process of various types of structures. Among other cases, they considered the collapse of an SIS, of an unstable-equilibrium (UE) BE-sphere222I.e., a solution of the Lane-Emden equation, truncated out to a radius large enough that the ratio of central to peripheral density is larger than that of a critical BE-sphere, and slightly perturbed so that it proceeds to collapse., and of a non-equilibrium (NE) pseudo-BE-sphere333This is not a true BE-sphere as it is not a solution of the Lane-Emden equation. Instead, it is constructed by obtaining one such solution and then increasing the density everywhere by 10%, so that the configuration is nowhere in equilibrium anymore.. They found that the latter two configurations retained a BE-like density profile, but that their velocity profiles differed significantly, with the NE sphere developing large velocities out to its truncation radius, while the UE one retained a nearly zero velocity at its edge. However, accretion was not included in their simulations.
Our simulation, instead, includes the novel feature of enveloping the collapsing core in a globally gravitationally unstable, uniform background, to mimic the physical conditions of cores in globally, hierarchically collapsing clouds, and the fact that cores are often observed to exist over a roughly uniform background (e.g., di Francesco et al., 2007; André et al., 2014, and references therein). This situation falls within the “band 0” class of solutions investigated by WS85, and essentially exhibits the behaviour envisaged by those authors: The pre-singularity (prestellar) collapse proceeds in an outside-in fashion (i.e., at early times the maximum infall speed occurs at the edge of the core; see also Gong & Ostriker, 2011) and consists of two main regions: an inner region, characterized by a roughly flat density profile with an infall velocity that increases linearly with radius, and an outer region, characterized by an density profile with a uniform infall velocity. However, in our simulation, this uniform-infall-speed region is finite and bound by the outer transonic point, beyond which the infall speed rapidly drops to zero again.444In our simulation, the infall motion can not reach the boundary of the box because of the periodic boundary conditions, but the boundaries are far enough from the collapsing core that we do not expect them to significantly affect its evolution during the time interval we explore. These results are easy to understand intuitively. Since the collapse is local, far from its center we should not expect any motions directed towards it. Nevertheless, the outer transonic point moves outwards, implying that the collapse spreads out to larger regions. This is qualitatively similar to S77’s expanding rarefaction wave although, in our case, the transition from collapsing to static occurs smoothly, rather than through an abrupt wavefront. Finally, inside the inner transonic point, the flow exhibits an infall velocity that is linear with radius, implying that the velocity smoothly approaches zero towards the center during the entire prestellar evolution of the core. (See further discussion of the implications of this property in Sec. 4.3.)
Consequently, during its prestellar stage, our simulation evolves through a sequence of BE-spheres of increasing central-to-external density ratios, so that it appears like a stable BE-sphere at early times and like an unstable one at later times. The inner transonic point migrates inwards and reaches the centre at the time of singularity formation. At this time, the entire core is characterized by a density configuration that resembles a SIS, except that in our case this state is not hydrostatic, but rather quite dynamic, with a uniform infall velocity of , thus corresponding to S77’s initial condition with .
Our setup differs from studies that start with hydrostatic BE or BE-like spheres (e.g., Foster & Chevalier, 1993; Vorobyov & Basu, 2005; Keto et al., 2015). Instead, our simulation lets the density and velocity profiles develop self-consistently, rather than imposing them as initial conditions. Although it also starts with hydrostatic conditions, these correspond to an early enough stage that, by the time the core has developed a pseudo-BE density profile, it is already collapsing everywhere, rather than being hydrostatic. This can occur, in spite of the very moderate amplitude of the initial density fluctuation, because the whole background is unstable, so the fluctuation does not need to exceed the critical central-to-peripheral density ratio in order to begin collapsing. This is a reasonable situation since, after all, the core must be assembled by moving material from the surroundings into it, and this requires a non-zero, convergent velocity field.
In order to produce a developed hydrostatic BE-sphere, as in the standard practice of starting with hydrostatic BE-like structures, the velocity field that assembled the core would have to first decay to zero, and then resume again to continue collapsing. This appears as a highly contrived process. Keto et al. (2015) have suggested that one process that may temporarily halt the contracting motions is the turbulent pressure, which must then dissipate to allow the collapse to resume. However, this implicitly assumes that the non-thermal motions actually have a sufficiently random nature, and have sufficiently small characteristic size scales, that they can produce an effective pressure which provides support against gravity. This notion that has been challenged recently (Vázquez-Semadeni et al., 2008; Ballesteros-Paredes et al., 2011; González-Samaniego et al., 2014).
Conversely, in the hierarchical gravitational collapse scenario, the possibility of turbulent support is discarded from the outset, and the motions are assumed to be dominated by an inward component driven by gravity. Within this scenario, the fragmentation occurs as forseen by Hoyle (1953), so that, as a cloud contracts and becomes denser, the average Jeans mass becomes smaller, and so progressively smaller density fluctuations can collapse. However, because the cloud is turbulent, the fluctuations are nonlinear, and thus have shorter free-fall times than the cloud at large, implying that they terminate their collapse earlier, as observed in numerical simulations of cloud formation and evolution by converging flows (e.g. Vázquez-Semadeni et al., 2007, 2009; Heitsch & Hartmann, 2008; Heitsch et al., 2009; Gómez & Vázquez-Semadeni, 2014). In this scenario, the clumps and cores produced by the turbulence only act as seeds for local gravitational collapse, and are never supported by non-thermal motions, but instead simply grow gravitationally from the outset, as represented in the simulation presented here. As shown in Sec. 4.1, this setup naturally explains a fundamental property of observed dense cores: their location in the vs. diagram.
4.3 Implications for the interpretation of observed core structure
In Sec. 3 we found that the core evolves along a sequence of BE-like density profiles, but with a global infall velocity, so that this profile is not indicative of a hydrostatic configuration, not even during the apparently stable stages (when the central-to-boundary density ratio is smaller than the critical value for instability). This result provides a clear interpretation to the ubiquity of BE-like profiles observed in prestellar cores without introducing the conundrum that a core needs to grow in spite of being hydrostatic. The resolution of this dilemma lies in the fact that, although the density profile is BE-like, it is not a true BE-sphere in the sense that it does not result as a solution of the hydrostatic Lane-Emden equation, but rather as a dynamic solution of the time-dependent hydrodynamic equations, which is characterized by inwards motion at all times.
Moreover, in Sec. 4.1 we have shown that our simulated core, with its boundary defined as the position where the density becomes equal to the background, traces the locus of the aforementioned core surveys in the vs. diagram. This result suggests the possibility that those core ensembles actually represent random samplings of cores at all possible evolutionary stages, so that their locus in that diagram traces the evolutionary track of a single core. It also suggests the possibility that the range of core masses in a given low- or high-mass star-forming region is determined simply by the mass increase of the cores during their evolution, but that the initial fragmentation occurs at the same initial mass, which corresponds simply to the Jeans mass of the background medium. This is consistent with the result by L08 that their whole sample is well characterized by a single BE-mass. Indeed, since the prestellar stages of evolution lead to an approach to an density profile above the background, for which the mean density is only 3 times larger than the density at the boundary, then the BE mass, proportional to the inverse square root of the mean density (assuming isothermality), is at most within a factor larger than that determined by the background. Thus, in the present scenario, the BE mass is essentially determined by the background density, rather than by the local core properties. This is also consistent with the recent finding by Palau et al. (2015) that the number of fragmentats in massive cores appears to be determined simply by the number of thermal Jeans masses contained in the core.
Also, we reported that the velocity field is smooth across the core boundary (compare both panels of Fig. 1). This implies that, if one insists in describing the core as “pressure bounded”, the confining pressure is ram pressure from the material accreting onto the core, rather than thermal pressure maintaing a hydrostatic configuration. But considering it as “pressure bounded” is misleading, because any Lagrangian (i.e., moving with the flow) spherical shell is moving inwards at any time due to gravity, and thus no bounding is needed. The correct physical description is that the core is the “tip of the iceberg” of the globally collapsing cloud.
The fact that the velocity profile in the inner part of the core is linear with radius during the prestellar evolution implies that the velocities are smaller closer to the center. This, in turn, implies that multi-tracer observations of the core would give smaller velocity dispersions at higher densities/smaller radii, giving the impression of a “transition to coherence” (e.g., Goodman et al., 1998). However, in our scenario, this is not due to dissipation of turbulence, but rather to the fact that the infall velocities are smaller in the inner part of the core. Finally, the property that the largest velocities occur in the outer parts of the core where the density begins to drop, implies that the line profiles may be narrower than would correspond to those largest velocities. We dicuss this at more length in Sec. 4.4.
4.4 Are the supersonic velocities really a problem?
Our simulation, like most other simulations of Larson-Penston-like flow, develops supersonic velocities in the final stages of evolution, which however correspond to the stages most likely to be observed, as the core is most prominent at those times. Such large velocities are generally not observed in low-mass cores (see, e.g., the review by Bergin & Tafalla, 2007). MS13 noted this problem, and concluded that their simulation (quite similar to ours) is not the correct model for the collapse of actual cores, and that magnetic tension may be necessary to render the collapse less dynamic. MS13 also pointed out that the supersonic infall produces accretion rates that are too high, leading to the so-called “luminosity problem” (Kenyon et al., 1990). Our simulation, being spherically symmetric, suffers from the same problems. However, it is possible that the resolution of these issues does not lie in invoking the magnetic field to provide support, but rather in geometrical and/or observational-bias factors.
Concerning geometry, our simulation, like all other non-magnetic, isothermal, spherically symmetric ones, represents the most dynamic possible scenario for collapse. Indeed, recent studies (Toalá et al., 2012; Pon et al., 2012) have shown that flattened or filamentary structures collapse on longer timescales than spherical structures of the same volume density. Thus, considering the non-spherical nature of the cores may contribute towards alleviating the problem. Moreover, the luminosity problem may be resolved if the accretion does not proceed directly onto the protostar, but rather it is mediated by a circumstellar disk (Kenyon & Hartmann, 1995; Whitworth & Ward-Thompson, 2001; Dunham & Vorobyov, 2012), which is also a non-spherical structure. The resolution of this issue must await analysis of cores arising self-consistently in fully 3D numerical simulations of molecular cloud evolution (e.g., Smith et al., 2013).
Concerning possible observational biases, we note that observational determinations of infall velocities depend on the underlying assumptions for the topology of the velocity field in the clump. Because a line profile is essentially a density-weighted radial velocity histogram along the line of sight (with possible self-absorption features), the fact that in our simulation the largest velocities occur in the core’s envelope rather than at the center may cause these large velocities to appear at the line wings rather than at the central parts of the line, thus giving the appearance that the infall speeds are smaller than they actually are. We plan to address this possibility in a future contribution (Loughnane et al, in prep.).
5 Summary and Conclusions
We have presented a highly idealized simulation of the prestellar stages of the gravitational collapse of an isothermal spherical core within the scenario of hierarchical gravitational collapse. To accomplish this, we have embedded the core in a uniform-density background that is, itself, gravitationally unstable. The evolution of the core was followed since its earliest stages, starting with a minor density fluctuation of amplitude 1.5 times the background density, containing a mass slightly larger than the Jeans mass of the background density, and with a generic gaussian profile. We have found the following results:
-
•
The core evolves according to the “Band 0” solution of WS85, which refers to objects that start out far from equilibrium, and includes the LP solutions.
-
•
In agreement with previous studies, and with the regularly observed structure of prestellar cores, the simulated core develops a BE-like profile, with a nearly-uniform-density (or “flat”) central region, and a nearly-power-law envelope, but it is always in the process of collapsing—even during the early stages, when the central to background density contrast is smaller than that of a critical BE sphere (), and the core would be labeled as “stable”. This result removes the apparent inconsistency between the apparently hydrostatic density structure of the cores (i.e., of stable BE-spheres) and the need for them to grow in order to eventually form stars. It also suggests that a smaller fraction of cores are “starless” (in the sense that they will never form stars) than usually thought. Instead, it is possible that these are just in their very earliest stages of growth.
-
•
The collapse proceeds in an “outside-in” fashion, developing the largest (and nearly radially constant) speeds in the power-law density envelope, and a linear-with-radius velocity profile in the central flat region. This implies that the velocities in the centermost parts of the core are small and subsonic during the whole prestellar evolution. This is contrary to the famous inside-out solution of Shu (1977), which is not expected because its initial condition, a hydrostatic singular isothermal sphere, is an unstable equilibrium, and therefore unrealizable from a dynamical previous evolution.
-
•
The boundary of the core, defined as the position where it merges with the background, increases in radius as time progresses, so that the core thus defined effectively grows in mass and size. The velocity field is smooth across this boundary, so that the material outside the boundary accretes onto the core smoothly, although it does not increase its density until it crosses the boundary.
-
•
The largest velocities in the system—those appearing in the power-law envelope—are supersonic by the time the core has grown enough to be clearly detectable (with at least a tenfold enhancement over the background). However, the fact that the largest velocities are located at the envelope implies that they will receive a lower density weighting for the production of a line profile, so that infall profiles may underestimate the velocities. In a future study we will investigate the nature of the lines produced by our core (Loughnane et al., in prep.).
-
•
The ratio of the core’s mass () to the critical BE-mass () increases as the core’s mass increases, and traces the locus of observed cores in the vs. diagram, evolving from apparently stable to apparently unstable configurations, although the core is unstable at all times. Thus, the locus of observed cores in this diagram can be interpreted as a random sample of evolving collapsing cores within globally unstable clouds. This result suggests that the sequences of observed (both low- and high-mass) cores are all part of a self-similar collapse process, only at different evolutionary stages and total masses, including the apparently stable ones.
We conclude that the evolution of marginally unstable cores embedded in a strongly unstable environment, as prescribed by the hierarchical gravitational collapse scenario, is not only consistent with the observed density structure of molecular cloud cores and their location in the vs. diagram, but provides a natural explanation to the problem of how a core may grow in mass while appearing gravitationally stable. Another conclusion is that the choice of initial conditions is crucial for the subsequent evolution of the system, and thus care must be exercised in choosing the most realistic initial conditions within the realm of the physical problem at hand.
Some problems remain, of course, regarding the appearance of supersonic speeds during the prestellar evolution, which are generally not observed in low-mass cores, as pointed out by MS13. In future contributions, we plan to investigate whether this apparent discrepancy can be resolved in terms of a non-spherical collapse geometry and/or the effects of the outside-in velocity field on the formation of infall line profiles.
References
- Alves et al. (2001) Alves, J. F., Lada, C. J., & Lada, E. A. 2001, Nature, 409, 159
- André et al. (2014) André, P., Di Francesco, J., Ward-Thompson, D., et al. 2014, Protostars and Planets VI, 27
- André et al. (2010) André, P., Men’shchikov, A., Bontemps, S., et al. 2010, A&A, 518, L102
- Arzoumanian et al. (2011) Arzoumanian, D., André, P., Didelon, P., et al. 2011, A&A, 529, L6
- Audit & Hennebelle (2005) Audit, E., & Hennebelle, P. 2005, A&A, 433, 1
- Ballesteros-Paredes et al. (1999) Ballesteros-Paredes, J., Hartmann, L., & Vázquez-Semadeni, E. 1999, ApJ, 527, 285
- Ballesteros-Paredes et al. (2011) Ballesteros-Paredes, J., Hartmann, L. W., Vázquez-Semadeni, E., Heitsch, F., & Zamora-Avilés, M. A. 2011, MNRAS, 411, 65
- Ballesteros-Paredes et al. (2003) Ballesteros-Paredes, J., Klessen, R. S., & Vázquez-Semadeni, E. 2003, ApJ, 592, 188
- Banerjee et al. (2009) Banerjee, R., Vázquez-Semadeni, E., Hennebelle, P., & Klessen, R.S. 2009, MNRAS, 398, 1082
- Bergin & Tafalla (2007) Bergin, E. A., & Tafalla, M. 2007, ARA&A, 45, 339
- Bertoldi & McKee (1992) Bertoldi, F., & McKee, C. F. 1992, ApJ, 395, 140
- Bonnor (1956) Bonnor, W. B. 1956, MNRAS, 116, 351
- Burkert & Hartmann (2004) Burkert, A., & Hartmann, L. 2004, ApJ, 616, 288
- Colín et al. (2013) Colín, P., Vázquez-Semadeni, E. & Gómez, G.C. 2013, MNRAS, 435, 1701
- di Francesco et al. (2007) di Francesco, J., Evans, N. J., II, Caselli, P., et al. 2007, Protostars and Planets V, 17
- Dunham & Vorobyov (2012) Dunham, M. M., & Vorobyov, E. I. 2012, ApJ, 747, 52
- Ebert (1955) Ebert, R. 1955, ZAp, 36, 222
- Ebert (1957) Ebert, R. 1957, ZAp, 42, 263
- Elmegreen & Lada (1977) Elmegreen, B. G., & Lada, C. J. 1977, ApJ, 214, 725
- Foster et al. (2009) Foster, J. B., Rosolowsky, E. W., Kauffmann, J., et al. 2009, ApJ, 696, 298
- Foster & Chevalier (1993) Foster, P. N., & Chevalier, R. A. 1993, ApJ, 416, 303
- Galván-Madrid et al. (2009) Galván-Madrid, R., Keto, E., Zhang, Q., et al. 2009, ApJ, 706, 1036
- Gómez et al. (2007) Gómez, G. C., Vázquez-Semadeni, E., Shadmehri, M., & Ballesteros-Paredes, J. 2007, ApJ, 669, 1042
- Gómez & Vázquez-Semadeni (2014) Gómez, G. C., & Vázquez-Semadeni, E. 2014, ApJ, 791, 124
- Gong & Ostriker (2009) Gong, H., & Ostriker, E. C. 2009, ApJ, 699, 230
- Gong & Ostriker (2011) Gong, H., & Ostriker, E. C. 2011, ApJ, 729, 120
- González-Samaniego et al. (2014) González-Samaniego, A., Vázquez-Semadeni, E., González, R. F., & Kim, J. 2014, MNRAS, 440, 2357
- Goodman et al. (1998) Goodman, A. A., Barranco, J. A., Wilner, D. J., & Heyer, M. H. 1998, ApJ, 504, 223
- Gutermuth et al. (2008) Gutermuth, R. A., Bourke, T. L., Allen, L. E., et al. 2008, ApJ, 673, L151
- Hartmann & Burkert (2007) Hartmann, L., & Burkert, A. 2007, ApJ, 654, 988
- Heitsch et al. (2005) Heitsch, F., Burkert, A., Hartmann, L. W., Slyz, A. D., & Devriendt, J. E. G. 2005, ApJ, 633, L113
- Heitsch et al. (2009) Heitsch, F., Ballesteros-Paredes, J., & Hartmann, L. 2009, ApJ, 704, 1735
- Heitsch & Hartmann (2008) Heitsch, F., & Hartmann, L. 2008, ApJ, 689, 290
- Heitsch et al. (2008) Heitsch, F., Hartmann, L. W., Slyz, A. D., Devriendt, J. E. G., & Burkert, A. 2008, ApJ, 674, 316
- Hennebelle & Pérault (1999) Hennebelle, P., & Pérault, M. 1999, A&A, 351, 309
- Heyer et al. (2009) Heyer, M., Krawczyk, C., Duval, J., & Jackson, J. M. 2009, ApJ, 699, 1092
- Hoyle (1953) Hoyle, F. 1953, ApJ, 118, 513
- Hunter (1977) Hunter, C. 1977, ApJ, 218, 834
- Ikeda et al. (2007) Ikeda, N., Sunada, K., & Kitamura, Y. 2007, ApJ, 665, 1194
- Kenyon & Hartmann (1995) Kenyon, S. J., & Hartmann, L. 1995, ApJS, 101, 117
- Kenyon et al. (1990) Kenyon, S. J., Hartmann, L. W., Strom, K. M., & Strom, S. E. 1990, AJ, 99, 869
- Keto & Caselli (2010) Keto, E., & Caselli, P. 2010, MNRAS, 402, 1625
- Keto et al. (2015) Keto, E., Caselli, P., & Rawlings, J. 2015, MNRAS, 446, 3731
- Kim & Ostriker (2001) Kim, W.-T., & Ostriker, E. C. 2001, ApJ, 559, 70
- Kirk et al. (2013) Kirk, H., Myers, P. C., Bourke, T. L., et al. 2013, ApJ, 766, 115
- Koyama & Inutsuka (2000) Koyama, H., & Inutsuka, S.-I. 2000, ApJ, 532, 980
- Koyama & Inutsuka (2002) Koyama, H., & Inutsuka, S.-i. 2002, ApJ, 564, L97
- Lada et al. (2007) Lada, C. J., Alves, J. F., & Lombardi, M. 2007, Protostars and Planets V, 3
- Lada et al. (2008) Lada, C. J., Muench, A. A., Rathborne, J., Alves, J. F., & Lombardi, M. 2008, ApJ, 672, 410
- Larson (1969) Larson, R. B. 1969, MNRAS, 145, 271
- Larson (1981) Larson, R. B. 1981, MNRAS, 194, 809
- Lee et al. (1999) Lee, C. W., Myers, P. C., & Tafalla, M. 1999, ApJ, 526, 788
- Lee et al. (2001) Lee, C. W., Myers, P. C., & Tafalla, M. 2001, ApJS, 136, 703
- Léorat et al. (1990) Leorat, J., Passot, T., & Pouquet, A. 1990, MNRAS, 243, 293
- Longmore et al. (2014) Longmore, S. N., Kruijssen, J. M. D., Bastian, N., et al. 2014, Protostars and Planets VI, 291
- Men’shchikov et al. (2010) Men’shchikov, A., André, P., Didelon, P., et al. 2010, A&A, 518, L103
- Mohammadpour & Stahler (2013) Mohammadpour, M., & Stahler, S. W. 2013, MNRAS, 433, 3389
- Molinari et al. (2010) Molinari, S., Swinyard, B., Bally, J., et al. 2010, A&A, 518, L100
- Molinari et al. (2011) Molinari, S., Bally, J., Noriega-Crespo, A., et al. 2011, ApJ, 735, L33
- Myers et al. (1986) Myers, P. C., Dame, T. M., Thaddeus, P., et al. 1986, ApJ, 301, 398
- Myers (2009) Myers, P. C. 2009, ApJ, 700, 1609
- Palau et al. (2015) Palau, A., Ballesteros-Paredes, J., Vazquez-Semadeni, E., et al. 2015, MNRAS, 453, 3785P
- Penston (1969) Penston, M. V. 1969, MNRAS, 144, 425
- Peretto et al. (2013) Peretto, N., Fuller, G. A., Duarte-Cabral, A., et al. 2013, A&A, 555, A112
- Peretto et al. (2014) Peretto, N., Fuller, G. A., André, P., et al. 2014, A&A, 561, A83
- Pineda et al. (2010) Pineda, J. E., Goodman, A. A., Arce, H. G., et al. 2010, ApJ, 712, L116
- Polychroni et al. (2013) Polychroni, D., Schisano, E., Elia, D., et al. 2013, ApJ, 777, L33
- Pon et al. (2012) Pon, A., Toalá, J. A., Johnstone, D., et al. 2012, ApJ, 756, 145
- Rathborne et al. (2009) Rathborne, J. M., Lada, C. J., Muench, A. A., et al. 2009, ApJ, 699, 742
- Schneider et al. (2010) Schneider, N., Csengeri, T., Bontemps, S., et al. 2010, A&A, 520, A49
- Simpson et al. (2011) Simpson, R. J., Johnstone, D., Nutter, D., Ward-Thompson, D., & Whitworth, A. P. 2011, MNRAS, 417, 216
- Smith et al. (2013) Smith, R. J., Shetty, R., Beuther, H., Klessen, R. S., & Bonnell, I. A. 2013, ApJ, 771, 24
- Smith et al. (2014) Smith, R. J., Glover, S. C. O., & Klessen, R. S. 2014, MNRAS, 445, 2900
- Shu (1977) Shu, F. H. 1977, ApJ, 214, 488
- Solomon et al. (1987) Solomon, P. M., Rivolo, A. R., Barrett, J., & Yahil, A. 1987, ApJ, 319, 730
- Tafalla et al. (1998) Tafalla, M., Mardones, D., Myers, P. C., et al. 1998, ApJ, 504, 900
- Tafalla et al. (2002) Tafalla, M., Myers, P. C., Caselli, P., Walmsley, C. M., & Comito, C. 2002, ApJ, 569, 815
- Tafalla et al. (2004) Tafalla, M., Myers, P. C., Caselli, P., & Walmsley, C. M. 2004, A&A, 416, 191
- Toalá et al. (2012) Toalá, J. A., Vázquez-Semadeni, E., & Gómez, G. C. 2012, ApJ, 744, 190
- Vázquez-Semadeni et al. (2005) Vázquez-Semadeni, E., Kim, J., Shadmehri, M., & Ballesteros-Paredes, J. 2005, ApJ, 618, 344
- Vázquez-Semadeni et al. (2006) Vázquez-Semadeni, E., Ryu, D., Passot, T., González, R. F., & Gazol, A. 2006, ApJ, 643, 245
- Vázquez-Semadeni et al. (2007) Vázquez-Semadeni, E., Gómez, G. C., Jappsen, A. K., et al. 2007, ApJ, 657, 870
- Vázquez-Semadeni et al. (2008) Vázquez-Semadeni, E., González, R. F., Ballesteros-Paredes, J., Gazol, A., & Kim, J. 2008, MNRAS, 390, 769
- Vázquez-Semadeni et al. (2009) Vázquez-Semadeni, E., Gómez, G. C., Jappsen, A.-K., Ballesteros-Paredes, J., & Klessen, R. S. 2009, ApJ, 707, 1023
- Vázquez-Semadeni et al. (2010) Vázquez-Semadeni, E., Colín, P., Gómez, G. C., Ballesteros-Paredes, J., & Watson, A. W. 2010, ApJ, 715, 1302
- Vázquez-Semadeni et al. (2011) Vázquez-Semadeni, E., Banerjee, R., Gómez, G. C., et al. 2011, MNRAS, 414, 2511
- Vorobyov & Basu (2005) Vorobyov, E. I., & Basu, S. 2005, MNRAS, 360, 675
- Wilson et al. (1970) Wilson, R. W., Jefferts, K. B., & Penzias, A. A. 1970, ApJ, 161, L43
- Whitworth et al. (1996) Whitworth, A. P., Bhattal, A. S., Francis, N., & Watkins, S. J. 1996, MNRAS, 283, 1061
- Whitworth & Summers (1985) Whitworth, A., & Summers, D. 1985, MNRAS, 214, 1
- Whitworth & Ward-Thompson (2001) Whitworth, A. P., & Ward-Thompson, D. 2001, ApJ, 547, 317
- Zuckerman & Palmer (1974) Zuckerman, B., & Palmer, P. 1974, ARA&A, 12, 279