Variable stars in the field of the Hydra II ultra-faint dwarf galaxy
Abstract
We report the discovery of one RR Lyrae star in the ultra–faint satellite galaxy Hydra II based on time series photometry in the , and bands obtained with the Dark Energy Camera at Cerro Tololo Inter-American Observatory, Chile. The association of the RR Lyrae star discovered here with Hydra II is clear because is located at from the center of the dwarf, well within its half-light radius of . The RR Lyrae star has a mean magnitude of which is too faint to be a field halo star. This magnitude translates to a heliocentric distance of kpc for Hydra II; this value is larger than the estimate from the discovery paper based on the average magnitude of several blue horizontal branch star candidates. The new distance implies a slightly larger half-light radius of pc and a brighter absolute magnitude of , which keeps this object within the realm of the dwarf galaxies. A comparison with other RR Lyrae stars in ultra–faint systems indicates similar pulsational properties among them, which are different to those found among halo field stars and those in the largest of the Milky Way satellites. We also report the discovery of 31 additional short period variables in the field of view (RR Lyrae, SX Phe, eclipsing binaries, and a likely anomalous cepheid) which are likely not related with Hydra II.
1 Introduction
Hydra II is one of the new faint satellite galaxies of the Milky Way recently discovered in the Southern hemisphere with the Dark Energy Camera (Bechtol et al., 2015; Koposov et al., 2015; Martin et al., 2015; Kim et al., 2015; Kim & Jerjen, 2015; Drlica-Wagner et al., 2015). The galaxy was found by searching for overdensities in data from the Survey of the Magellanic Stellar History (SMASH, Martin et al., 2015). The discovery of new low-luminosity satellites is of tremendous importance for reconciling observations and LCDM predictions for the number and distribution of satellites around the Milky Way (the missing satellite problem, Klypin et al., 1999; Moore et al., 1999). Several of the new galaxies, including Hydra II, have the added aspect of a possible association with the Magellanic Clouds (Martin et al., 2015; Bechtol et al., 2015). This is an interesting scenario (that needs further investigation) because cosmological numerical simulations predict that cases of “satellites of satellites” are common at the time of infall (D’Onghia & Lake, 2008; Sales et al., 2011; Deason et al., 2015; Wheeler et al., 2015). Confirmation and full characterization of the new discoveries (e.g., establishing them as satellite galaxies rather than globular clusters) are needed in order to test these theoretical predictions and to understand the role of dwarf systems in the formation of Milky Way–type galaxies. Key to such characterization is accurate distance measurements toward the new galaxies.
Kirby et al. (2015) recently obtained spectroscopy for several stars in Hydra II. Although they could not resolve the velocity dispersion of the system (the main diagnostic for confirming it as a galaxy), the large metallicity dispersion they measured ([Fe/H]), together with Hydra II’s relatively large size (68 pc, Martin et al., 2015, but see revised value below) makes it more likely to be a dwarf galaxy rather than a globular cluster.
Variable stars have a long tradition of being an excellent tool for studying the content and structure of stellar systems. The presence of RR Lyrae stars is an unequivocal sign of an old stellar population ( Gyr) since these stars are evolved sub–solar–mass stars () burning helium in their cores (Smith, 1995). All of the dwarf galaxies for which time series data are available have shown the presence of at least one RR Lyrae star (see compilations in Vivas & Zinn, 2006; Boettcher et al., 2013; Baker & Willman, 2015), which confirms that all dwarf galaxies do have a population of old stars; this includes Segue 1 (), the lowest luminosity galaxy with known RR Lyrae stars (Simon et al., 2011). The detection of RR Lyrae stars in low–luminosity systems is also important for other reasons. RR Lyrae stars are standard candles and thus provide an alternative method for determining the distances to galaxies. This is particularly critical in these distant and low–luminosity systems lacking young stellar populations (i.e., systems that cannot host Cepheids, which could also be used as distance indicators). In addition, it is hard to fit isochrones to low luminosity systems because there are very few stars in the upper part of the color–magnitude diagram (CMD), the contamination by field stars may be important due to the low density of stars in the system, and the main sequence turn–off may not be available in some systems due to their large distances. In the case of Hydra II, for example, the distance was estimated by Martin et al. (2015) by identifying 12 probable horizontal branch (HB) stars in the galaxy and using the HB absolute magnitude – color relationship of Deason et al. (2011). If Hydra II contains RR Lyrae stars, the distance could be accurately calculated and important parameters such as the physical half–light radius and absolute magnitude refined. In addition, the comparison of the pulsational properties of RR Lyrae in the halo field and in the MIlky Way satellites allows us to study the origin of the field population of RR Lyrae stars, and thus the formation of the Galactic halo. Based on their pulsational properties, it has been argued that most of the Galactic field RR Lyrae stars may have come from a few mergers with Sgr–like galaxies (Zinn et al., 2014; Fiorentino et al., 2015). The ultra–faint satellites may be an important source to the long-period tail of the period distribution of field RR Lyrae stars in the halo, an idea that can be confirmed as more data on low–luminosity galaxies are accumulated.
On the other hand, the presence of other types of variable stars are important for studying the stellar population in a galaxy. Anomalous cepheids (which are brighter than RR Lyrae stars) are usually interpreted as belonging to metal–poor, intermediate–age population (e.g., Fiorentino & Monelli, 2012; Fiorentino et al., 2012; Ripepi et al., 2014). Their progenitors are likely stars with in the He-burning phase, although it has been suggested they can also be the result of binary interaction. The ultra–faint galaxy Leo T, for example, contains 11 such stars (Clementini et al., 2012), suggesting a very complex star formation history for this galaxy. Fainter pulsating stars, also known as dwarf cepheids, may be present as well (e.g. Breger, 2000; McNamara, 2011; Vivas & Mateo, 2013). Hydra II is suspected to have a blue straggler population (Martin et al., 2015) and some of them may be variable stars of the SX Phe type (see for example Vivas & Mateo, 2013).
In this work we explore the (short–period, day) variable population of the ultra–faint dwarf Hydra II and its surroundings.
2 Observations
Observations were carried out during 2015 March 30–31 with the Dark Energy Camera (DECam, Flaugher et al., 2015) at the Blanco telescope at the Cerro Tololo Inter-American Observatory (CTIO), Chile. Consecutive observations of Hydra II () were taken during hours both nights, alternating the , and filters. Because these nights were close to full moon, exposure times were kept relatively short (150s) in order to keep the background flux to manageable levels. Even in bright time, this exposure time is good enough to obtain an excellent S/N at the level of the HB of Hydra II (). The typical time separation between observations in the same band was min. During the short period with no moon on these nights we took several continuous, deeper exposures (360s) in and . In total we obtained 111, 112 and 102 observations in , and , respectively. The seeing was stable during the whole observing run at around arcsec. The galaxy was centered on DECam chip S4 at the center of the field of view. The entire galaxy (, Martin et al., 2015) fits well within a single CCD, which has a FOV of . However, we searched for variables in the full DECam FOV ( diameter) to explore for a possible extra-tidal population of variable stars.
Images were processed by the DECam Community Pipeline (Valdes et al., 2014) which performs bias subtraction, flatfielding and astrometric calibration, among other steps111http://ast.noao.edu/sites/default/files/NOAO_DHB_v2.2.pdf. PSF photometry was made using the PHOTRED222https://github.com/dnidever/PHOTRED pipeline (Nidever et al., 2011) which is based on DAOPHOT - ALLSTAR routines (Stetson, 1987, 1994). To isolate stars from extended objects, the final catalog was cleaned by cutting out objects having (Sextractor) values of , and .
Then, using as reference the image with the lowest airmass observation in each band we performed relative photometry by calculating zero-point differences between each individual observation and the reference image. Because both nights were photometric, the differences in zero point among the different observations were due only to variations in atmospheric extinction due to the changing airmass of the field during each night. Once the zero point differences were applied to the data, mean magnitudes for each star were calculated. The resulting catalog was calibrated using these (instrumental) mean magnitudes and comparing them with the photometry measured in the discovery paper (Martin et al., 2015). Both zero points and color terms were included in the transformation equations. The final ensemble contains calibrated , and time series for 277,579 point sources.
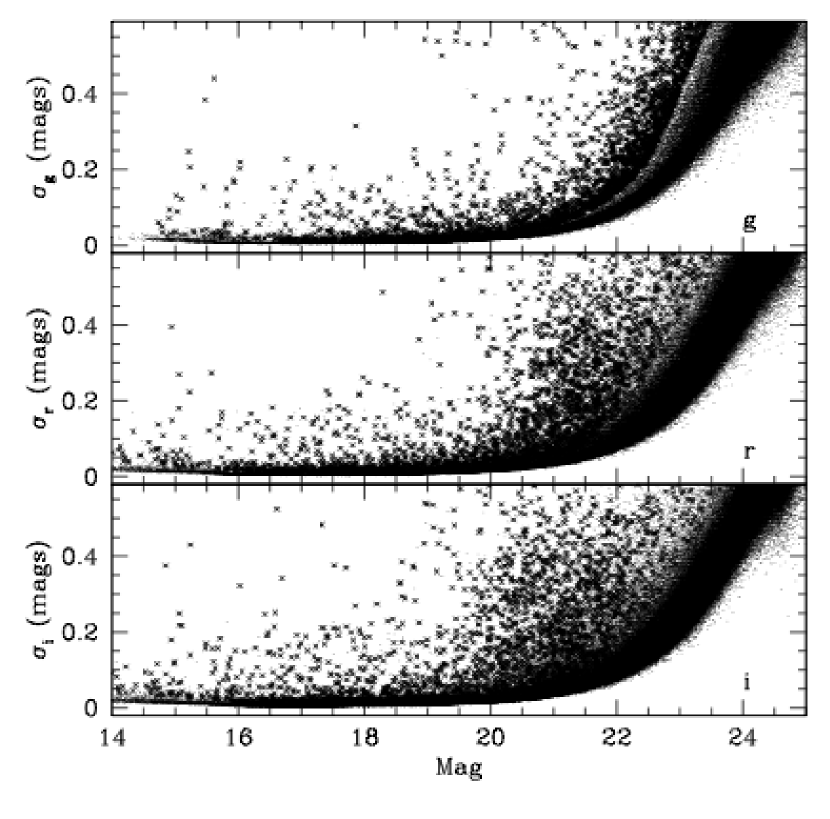
Figure 1 shows the standard deviation () of the magnitudes of each star as a function of their mean magnitude. The main locus observed in each of these figures corresponds to non-variable stars and defines the photometric errors of our observations as a function of magnitude. To characterize the loci we binned the data in 0.2 mag bins and calculated the (sigma-clipped) mean error () and standard deviation () in each bin centered on magnitude . The mean photometric errors of the sample are mags for and increase to 0.1 mags around in each band. The expected error at the level of the HB of Hydra II is mags. We consider stars as variables if they are located significantly above the locus of the normal stars (). About (3,718 stars) of all stars in the field show variability simultaneously in all three bands. These variable stars are indicated with crosses in Figure 1.
3 Periodic Variable Stars
We proceed to identify periodic variable stars in the dataset by using the well-known phase-dispersion minimization method first described by Lafler & Kinman (1965, LK). To make full use of all the available multi-band data, we combined the results of the LK method in each individual band to derive an enhanced string length parameter (see for example Watkins et al., 2009; Mateu et al., 2012; Vivas & Mateo, 2013):
| (1) |
where we weight by the number of observations in each band, .
In the original LK method, the correct period is obtained by finding the minimum value of the string length parameter () for a range of trial periods in a particular band. The parameter is the mean squared difference between magnitudes () at consecutive phases for a given trial period:
| (2) |
Because our observations contain data from only two nights, the period search was restricted to values less than one day. Our data are not sensitive to long-period variables. We applied the method in two period ranges, one optimized for RR Lyrae stars and anomalous cepheids (0.15 to 1.0 days), and the other one aimed at finding dwarf cepheid stars (0.01 to 0.15 days). We considered several minima of during our search to allow for possible spurious periods due to harmonics or aliases.
After visually examining potential periodic stars given by this method, we finally selected and classified 32 periodic variables in the field. Most of the periodic stars are eclipsing binaries, but we also found six RR Lyrae stars and four dwarf cepheids (one of them is dubious and may be an anomalous cepheid). The rest of the variables are probably due to noise and artifacts (half of them are fainter than ), non-periodic variables, or stars with periods day. Table 1 contains coordinates, number of observations in each band, mean magnitudes, amplitude, period and classification for all the periodic variable stars (see Sections 3.1 to 3.3). We refer the reader to Drake et al. (2014) for a general description of the observational properties of the different types of variables.
We searched the International Variable Star Index (VSX)333http://www.aavso.org/vsx/index.php and found that only one star out of the 32 had been previously classified as a periodic variable. This star is 48.10426, which has been classified as a RRab star in the Catalina Real-Time Transient Survey (Torrealba et al., 2015, CRTS), under ID SSS_J122306.8-322119, with a period similar to that we have found in this work. The remaining 31 stars should be considered as new discoveries. Star 48.10426 is the brightest of the RR Lyrae stars in our sample. Fainter stars may have been missed by the CRTS since its completeness starts to decrease at magnitude (Torrealba et al., 2015).
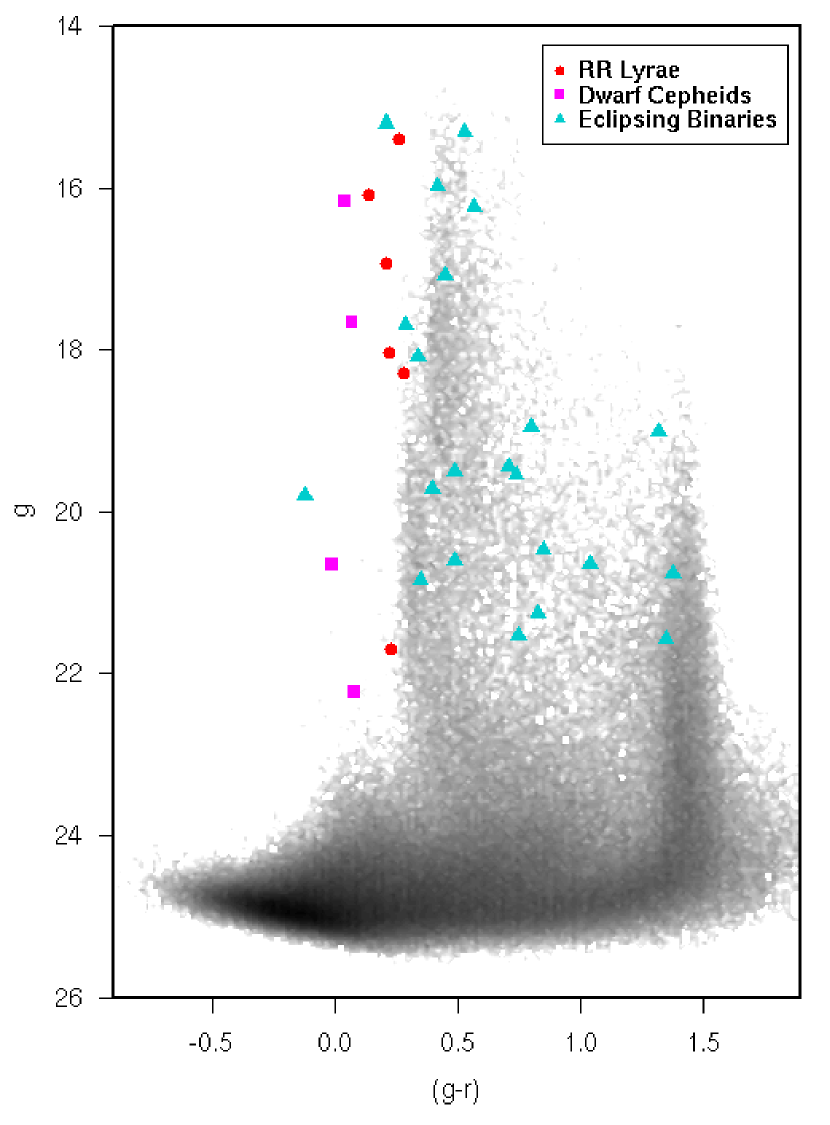
A color-magnitude diagram (CMD) of the full DECam field is shown in Figure 2, together with the periodic variable stars found within it. This CMD was obtained by averaging the multiple individual observations of each star. As expected, RR Lyrae stars and dwarf cepheids (red circles and magenta squares) are located in a narrow range of color in this diagram (, the instability strip), while eclipsing binaries are widely spread in color.
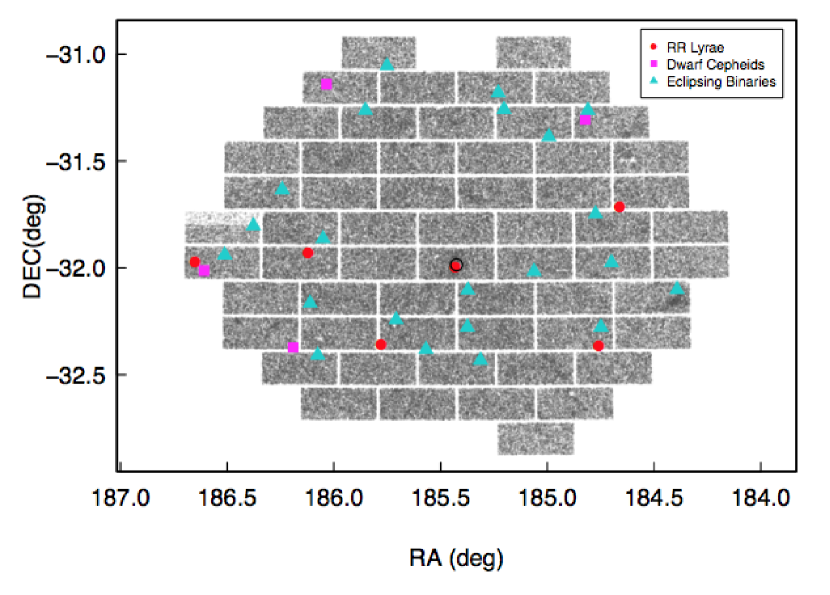
Figure 3 shows the location of the variable stars in the field.444Notice there is no data in chip N31, which is located on the east side of the southernmost row of CCDs. This was due to an error in the photometry pipeline, which skipped this CCD. Since this chip is far enough from Hydra II, its inclusion would not have changed the results discussed in this paper. The circle in one of the central CCDs indicates the location and half-light radius of Hydra II. Only one of the variable stars, an RR Lyrae star, lies within the half-light radius of the galaxy555This result was confirmed by an alternative method for searching variable stars, described in Bernard et al. (2009).. Thus, the rest of the variable stars are likely to be Milky Way field stars.
| ID | RA(2000.0) | DEC(2000.0) | g | r | i | Amp i | Period (d) | Type | |||||
|---|---|---|---|---|---|---|---|---|---|---|---|---|---|
| 3.4557 | 12:23:00.33 | -31:03:15.0 | 56 | 19.55 | 0.77 | 57 | 18.81 | 0.74 | 51 | 18.45 | 0.75 | 0.233 | EW |
| 5.5304 | 12:20:55.22 | -31:10:48.3 | 109 | 21.54 | 0.72 | 112 | 20.79 | 0.54 | 102 | 20.38 | 0.45 | 0.228 | EB |
| 7.16439 | 12:24:08.42 | -31:08:23.6 | 81 | 16.17 | 0.73 | 76 | 16.13 | 0.53 | 69 | 16.09 | 0.39 | 0.0589 | DC |
| 8.9 | 12:19:14.43 | -31:15:46.2 | 107 | 19.79 | 0.26 | 108 | 19.91 | 0.25 | 102 | 19.92 | 0.22 | 0.340 | EW |
| 8.9705 | 12:19:17.35 | -31:18:18.2 | 111 | 20.66 | 0.63 | 112 | 20.67 | 0.50 | 102 | 20.65 | 0.38 | 0.0447 | DC |
| 9.3499 | 12:19:58.30 | -31:23:07.6 | 56 | 16.24 | 0.72 | 57 | 15.67 | 0.71 | 50 | 15.42 | 0.69 | 0.270 | EW |
| 9.8816 | 12:20:48.77 | -31:15:28.2 | 107 | 20.60 | 0.19 | 108 | 20.11 | 0.16 | 102 | 19.87 | 0.13 | 0.120 | EW |
| 11.8451 | 12:23:24.56 | -31:15:44.3 | 107 | 18.96 | 0.12 | 108 | 18.16 | 0.09 | 102 | 17.80 | 0.06 | 0.629 | EW |
| 19.11108 | 12:18:38.43 | -31:42:51.1 | 56 | 16.93 | 0.78 | 57 | 16.72 | 0.53 | 51 | 16.57 | 0.41 | 0.599 | RRab |
| 24.1361 | 12:24:58.18 | -31:38:02.2 | 76 | 17.08 | 0.55 | 93 | 16.63 | 0.52 | 90 | 16.40 | 0.49 | 0.360 | EW |
| 26.8646 | 12:19:05.84 | -31:44:49.1 | 107 | 18.09 | 0.13 | 108 | 17.75 | 0.11 | 102 | 17.57 | 0.11 | 0.173 | EW |
| 30.2585 | 12:24:12.26 | -31:51:47.9 | 111 | 15.97 | 0.16 | 111 | 15.55 | 0.19 | 99 | 15.34 | 0.17 | 0.171 | EW |
| 31.1203 | 12:25:30.57 | -31:48:10.8 | 106 | 21.58 | 1.07 | 107 | 20.23 | 0.60 | 98 | 19.38 | 0.50 | 0.290 | EA |
| 33.15473 | 12:18:47.89 | -31:58:31.4 | 111 | 15.20 | 0.30 | 104 | 14.99 | 0.33 | 97 | 14.88 | 0.29 | 0.665 | EW |
| 34.6157 | 12:20:15.00 | -32:00:57.5 | 111 | 19.45 | 0.11 | 112 | 18.74 | 0.10 | 102 | 18.40 | 0.08 | 0.575 | EW |
| 35.6516 | 12:21:43.51 | -31:59:42.8 | 111 | 21.70 | 0.68 | 112 | 21.47 | 0.48 | 102 | 21.30 | 0.38 | 0.645 | RRab |
| 37.4763 | 12:24:28.77 | -31:55:27.0 | 111 | 18.28 | 0.47 | 112 | 18.00 | 0.33 | 102 | 17.84 | 0.28 | 0.658 | RRab |
| 38.5537 | 12:26:02.85 | -31:56:20.6 | 111 | 20.46 | 0.14 | 112 | 19.61 | 0.13 | 102 | 18.67 | 0.09 | 0.145 | EW |
| 38.8646 | 12:26:26.01 | -32:00:43.8 | 111 | 17.66 | 0.80 | 112 | 17.59 | 0.49 | 102 | 17.53 | 0.35 | 0.275 | DC |
| 38.9496 | 12:26:35.89 | -31:58:13.7 | 111 | 16.08 | 0.48 | 112 | 15.94 | 0.33 | 102 | 15.85 | 0.25 | 0.336 | RRc |
| 39.2293 | 12:17:34.22 | -32:06:04.0 | 90 | 17.70 | 0.27 | 83 | 17.41 | 0.24 | 65 | 17.26 | 0.24 | 0.375 | EW |
| 41.11296 | 12:21:29.40 | -32:06:15.2 | 111 | 15.30 | 0.52 | 83 | 14.77 | 0.43 | 67 | 14.52 | 0.38 | 0.290 | EW |
| 43.11303 | 12:24:26.73 | -32:09:55.7 | 108 | 19.02 | 0.37 | 108 | 17.70 | 0.29 | 100 | 16.93 | 0.30 | 0.695 | EA |
| 46.2031 | 12:18:59.71 | -32:16:39.4 | 110 | 20.77 | 0.33 | 112 | 19.39 | 0.27 | 101 | 18.56 | 0.20 | 0.250 | EB |
| 46.2447 | 12:19:02.16 | -32:21:55.5 | 69 | 18.03 | 1.12 | 66 | 17.81 | 0.88 | 69 | 17.60 | 0.68 | 0.535 | RRab |
| 47.9286 | 12:21:29.88 | -32:16:38.3 | 111 | 19.50 | 0.63 | 112 | 19.01 | 0.58 | 102 | 18.77 | 0.56 | 0.355 | EW |
| 48.10426 | 12:23:07.03 | -32:21:15.8 | 106 | 15.40 | 0.61 | 100 | 15.14 | 0.41 | 85 | 14.99 | 0.34 | 0.604 | RRab |
| 48.4574 | 12:22:16.57 | -32:22:54.2 | 55 | 19.72 | 0.11 | 57 | 19.32 | 0.08 | 51 | 19.10 | 0.09 | 0.139 | EW |
| 48.8938 | 12:22:50.08 | -32:14:34.1 | 107 | 21.26 | 0.81 | 108 | 20.43 | 0.69 | 102 | 20.06 | 0.66 | 0.213 | EW |
| 50.108 | 12:24:45.82 | -32:22:19.0 | 56 | 22.23 | 1.04 | 57 | 22.15 | 0.81 | 51 | 22.08 | 0.60 | 0.0611 | DC |
| 53.1299 | 12:21:15.21 | -32:25:55.8 | 108 | 20.64 | 0.47 | 107 | 19.60 | 0.41 | 101 | 19.07 | 0.41 | 0.295 | EB |
| 55.3234 | 12:24:18.22 | -32:24:29.8 | 105 | 20.84 | 0.23 | 108 | 20.49 | 0.19 | 102 | 20.29 | 0.19 | 0.214 | EW |
Note. — ID nomenclature stands by chip_number.star_number (for example, 35.6516 is star number 6516 in CCD 35); , and are the number of observations for a given star in each band. The different types of stars are: RRab and RRc = RR Lyrae stars of the type ab and c; DC = dwarf cepheids; EW = eclipsing contact binaries; EB = semi–detached eclipsing binaries; EA = detached eclipsing binaries.
| ID | E(B-V) | (i) | Distance | Distance | ||||
|---|---|---|---|---|---|---|---|---|
| from (kpc) | from (kpc) | |||||||
| 19.11108 | 0.053 | 0.10 | 0.16 | 16.47 | 16.64 | 16.03 0.08 | 16.10.6 | 16.51.2 |
| 35.6516 | 0.053 | 0.10 | 0.16 | 21.19 | 21.40 | 20.890.11 | 1518 | 15412 |
| 37.4763 | 0.061 | 0.12 | 0.19 | 17.72 | 17.93 | 17.330.08 | 291 | 302 |
| 38.9496 | 0.075 | 0.15 | 0.23 | 15.71 | 15.77 | 15.010.08 | 10.90.4 | 11.00.8 |
| 46.2447 | 0.072 | 0.14 | 0.23 | 17.46 | 17.67 | 16.980.09 | 251 | 272 |
| 48.10426 | 0.067 | 0.13 | 0.21 | 14.86 | 15.04 | 14.430.09 | 7.70.3 | 7.90.6 |
3.1 RR Lyrae stars
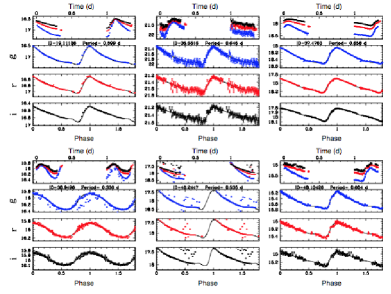
Six RR Lyrae stars were found in the observed field. Five of them are of type ab and one is of type c. Only one of these RR Lyrae stars (ID=35.6516) appears to be associated with Hydra II (see § 4). Figure 4 shows the light curve of the RR Lyrae stars. We fit light-curve templates to the data using the set derived by Sesar et al. (2010) from multi–band light curves of RR Lyrae stars in SDSS stripe 82. To fit each template we used minimization (following Vivas et al., 2008), allowing for variations around the period given by the LK method, and the amplitude, maximum magnitude and initial phase derived from the data. The mean magnitude of the RR Lyrae stars in each band was calculated by transforming the fitted template to intensity, integrating under the curve, and transforming the mean back to magnitudes. Interstellar extinction values were obtained using the re–calibration made by Schlafly & Finkbeiner (2011) of the Schlegel et al. (1998) dustmaps.
The mean magnitude of the RR Lyrae stars can be used to derive the distance to the stars. For this, we used the relationships provided by Cáceres & Catelan (2008), which are based on theoretical models for the SDSS bandpasses. These models are consistent with a distance modulus to the Large Magellanic Cloud of mag (Catelan et al., 2004). Cáceres & Catelan (2008) recommend using the longer wavelength infrared band for deriving distances because the and bands do not show tight period-luminosity relationships for RR Lyrae stars. We therefore use:
| (3) |
which has an uncertainty of 0.045 mag. The following relationship between and [Fe/H] is also taken from Cáceres & Catelan (2008):
| (4) |
We assumed [Fe/H] as the mean metallicity of the Galactic halo (Suntzeff et al., 1991), except for star 35.6516, which is likely to be associated with Hydra II. For this star we used [Fe/H], which was directly measured by Kirby et al. (2015) for Hydra II stars. The abundances () were assumed as 0.2 and 0.3 for the halo and dwarf galaxies respectively, based on Pritzl et al. (2005). The latter is appropriate for dwarf galaxies with [Fe/H]. To estimate the error we took into account the photometric error ( mags for the brighest stars, mag in for 35.6516), calibration errors ( in , and respectively), error in (10%, Schlegel et al., 1998), uncertainty in the relationship ( mag), period uncertainty ( days), and abundance dispersion. For the halo stars we assumed (Suntzeff et al., 1991); for Hydra II, Kirby et al. (2015) measured a dispersion of 0.4 dex. For the abundances we assumed uncertainties of 0.1 dex. The final error in the true distance modulus() was calculated using:
| (5) |
where
| (6) |
As a double check, we calculated the distance in an independent way by transforming the magnitudes to using the transformation equations derived by R. Lupton and available on the SDSS webpage666http://classic.sdss.org/dr4/algorithms/sdssUBVRITransform.html#Lupton2005,
| (7) |
and then applying the -[Fe/H] relationship given in Cacciari & Clementini (2003),
| (8) |
The results from both methods are compatible within their errors and are given in Table 2. The RR Lyrae star associated with Hydra II is highlighted in boldface. We adopted the distance derived from the magnitudes as they are more precise than the ones derived using the magnitudes.
3.2 Eclipsing Binaries
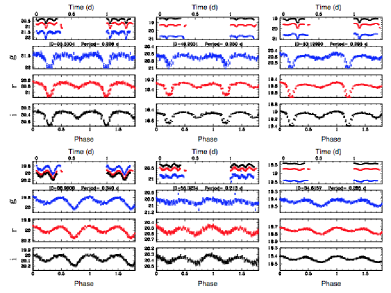
Twenty-two eclipsing binaries were found in the field. Figures 5 - 8 show their light curves, which have been grouped according to their shape.
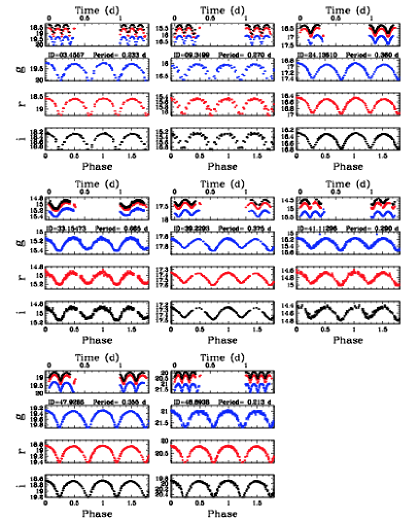
In the first group we have eight contact binaries (EW), which have the typical shape for W UMa stars with rounded tops and eclipses that in most cases show only slight differences in depth (Figures 5). All of these stars have periods between 0.2 and 0.6 d. Then, we have a group of six stars with sinusoidal light curves (Figure 6). These stars are also contact eclipsing binaries of the type EW. Because of their light-curve shape, they are sometimes confused with RRc (see discussion by Drake et al., 2014). We do not believe these stars are RRc because their periods are too short and their colors are red in all cases except one (see below). If the stars in this group are true EW type, then it is very likely that their periods are double those found by the LK algorithm (the LK algorithm value is the one reported in Table 1) because a full period would have two eclipses.
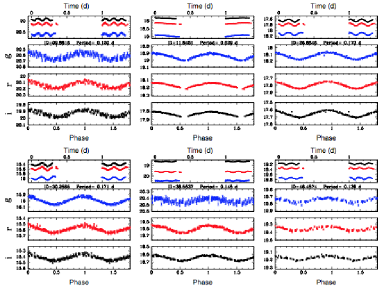
The stars in Figure 7 are semi-detached binaries (EB or Lyrae), which show significant variations in the depth of the eclipses. Finally, two detached binaries (EA or Algol type) are shown in the top row (left and middle panels) of Figure 8. These stars show almost flat maxima and V-shaped eclipses.
A few eclipsing binaries are located in the color range of the instability strip (see Figure 2). However, their classification is unmistakable because of the shape of their light curves (see for example star 33.15473, which shows eclipses of different depth). Only in one of these cases (star 26.8646 at ) is the light curve sinusoidal and may resemble that of type c RR Lyrae stars. However, its short period (0.17 d) and low amplitude (Amp g ) make it very unlikely for the star to be a real RRc (see Palaversa et al., 2013; Drake et al., 2014). The star is also located toward the red side of the instability strip, which is not the case for RRc stars.
3.3 Dwarf Cepheid Stars (and an Anomalous Cepheid?)
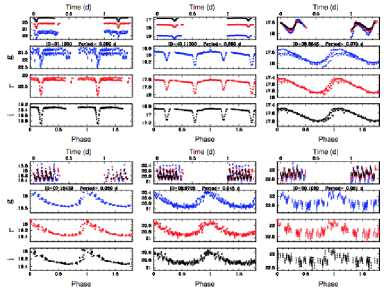
Dwarf cepheid stars encompass the pulsating variable stars in the region where the instability strip intersects the main sequence. Dwarf cepheids from Pop I systems are known as Scuti, while those from Pop II systems are called SX Phe stars. Not knowing with certainty the stellar population to which the stars in our field belong, we prefer to name them by the collective name dwarf cepheids (Mateo et al., 1998). The main characteristic of this group of stars is their very short period (just a few hours). In dSph galaxies these stars show large amplitudes ( mags, Vivas & Mateo, 2013). We have found four stars that have the characteristics of dwarf cepheid stars, namely, 07.16439, 08.9705, 50.1080 and 38.8646 (Figure 8). The first three in this group (bottom row in Figure 8) have exactly these properties, with periods ranging between 0.04 and 0.06 d. We cannot a priori calculate the distance to these stars without knowing their pulsation mode. However, applying the Period-Luminosity relationships by Nemec et al. (1994) for both fundamental and first overtone modes, we find that stars 7.16439, 8.9705 and 50.1080 must be located at 3 or 4 kpc, 27 or 31 kpc and 63 or 72 kpc, respectively. To obtain these numbers, we transformed first the mean magnitudes to Johnson (see above). Thus, independent of their pulsation mode, they should be halo field stars and the more likely correct classification for these stars is therefore SX Phe. Their large amplitude supports this classification (Breger, 2000). The last star in this group (38.8646, top/right in Figure 8) is more difficult to classify. Its period (0.275 d) is somewhat larger than typical for dwarf cepheid stars. On the other hand, although the period and amplitude is right where RRc stars are expected, the shape of the light curve is too asymmetric for this class of stars. It is possible that 38.8646 is then an anomalous cepheid. According to Pritzl et al. (2002), the period for this star may be on the short side for anomalous cepheids (although there are stars with periods as short as 0.3 d), but still, considering all of its properties (color, amplitude, period, shape), this is the most likely classification. It is possible that this star is displaying a slight change of period from one night to the other since in the first night it shows a full cycle while in the second night, which spans the same time range, the cycle is not complete. This is causing the double sequence in the phased light curves in Figure 8.
4 Variable stars in Hydra II: the information provided by its RR Lyrae star
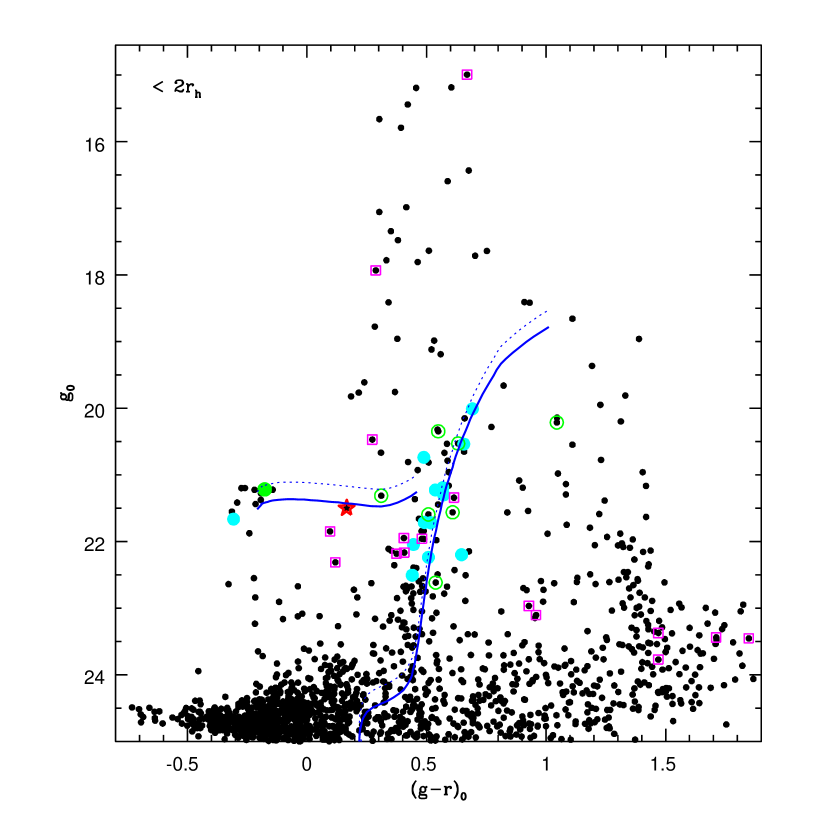
Figure 9 shows the CMD containing all stars within 2 half-light radii of the galaxy. The features of the galaxy are visible in this CMD with the top of the red giant branch at , a group of blue horizontal branch (BHB) stars at and the main sequence turn-off at the faint limit of the diagram. As mentioned before, one RR Lyrae star (35.6516 at ) is located well within of the galaxy, at from its center. We have marked this star, at its mean magnitude and color, with a red star symbol in Figure 9. The star lies at the level of the horizontal branch of Hydra II, hence its association with the galaxy is clear. Unfortunately, although Kirby et al. (2015) included some potential BHB stars in their spectroscopic sample, star 35.6516 is not among them. Thus, no final confirmation from radial velocity is available. Needless to say, Galactic halo RR Lyrae stars at distances larger than kpc are very rare (Zinn et al., 2014; Watkins et al., 2009). Indeed, notice the lack of RR Lyrae stars for (Figure 2). It is highly unlikely that this is a field halo star.
| ID | RA (deg) | DEC (deg) | Ampg | Ampr | Ampi | ||
|---|---|---|---|---|---|---|---|
| 35.6652 | 185.430960 | -32.037326 | 14.99 | 0.669 | 0.3 | 0.5 | 0.2 |
| 35.7152 | 185.451049 | -32.026565 | 17.93 | 0.288 | 0.2 | 0.1 | 0.1 |
| 35.6106 | 185.422854 | -31.942608 | 20.47 | 0.274 | 0.6 | 0.5 | 0.6 |
| 35.17189 | 185.451179 | -32.026491 | 21.34 | 0.615 | 2.6 | 1.8 | 1.3 |
| 35.17407 | 185.457215 | -31.954393 | 21.85 | 0.097 | 1.0 | 0.8 | 0.5 |
| 35.16949 | 185.441125 | -32.012642 | 21.95 | 0.405 | 0.8 | 0.6 | 0.5 |
| 35.7151 | 185.455066 | -31.946172 | 21.96 | 0.481 | 2.1 | 1.5 | 2.2 |
| 35.15898 | 185.405407 | -32.004393 | 22.17 | 0.407 | 1.4 | 1.4 | 1.1 |
| 35.5412 | 185.405288 | -32.004220 | 22.18 | 0.375 | 1.8 | 0.6 | 0.6 |
| 35.7273 | 185.457382 | -31.954359 | 22.31 | 0.119 | 1.9 | 1.6 | 1.0 |
From Table 2 we can put the distance to Hydra II at kpc from the Sun, or 148 kpc from the Galactic center (assuming kpc). This is further away than the original estimate of the heliocentric distance made by Martin et al. (2015, kpc) based on the average magnitude of several stars at the horizontal branch. In Martin et al. (2015), the RR Lyrae star was measured with which is near maximum light. This surely influenced their distance estimate. The solid line in Figure 9 represents an old (13 Gyr) and metal-poor ([Fe/H]) Parsec isochrone777http://stev.oapd.inaf.it/cgi-bin/cmd (Bressan et al., 2012) shifted to a distance of 151 kpc. For reference we also show the same isochrone at the distance reported in the discovery paper (134 kpc, dotted line). Radial velocity members and non-members from Kirby et al. (2015) are shown as cyan and green circles, respectively. A special case among the non-members is indicated as a solid green circle. Although this star had the correct radial velocity to be a member of Hydra II, it was discarded as a member by Kirby et al. (2015) since it was too bright in their photometry for being an HB star888The star has ID=191385 in Kirby et al. (2015) with in their photometry.. Our photometry locates this star among the HB candidates and we conclude it must be a member. Although we do not have an explanation for the discrepancy, we noticed that the spectra of this star in Kirby et al. has a S/N more similar to stars of magnitude (our magnitude) than to others stars with observed with the same slitmask (hence, under identical observing conditions). The other radial velocity confirmed member in the HB of Hydra II is the faintest object within the group of candidates, at . There seems to be an apparent inconsistency between the distance given by the RR Lyrae star and the location of the other BHB candidates (at ) since the latter appear slightly brighter than the isochrone at the HB level. Confirmation of the rest of the BHB candidates as members would be needed to resolve this apparent mismatch. But even if all those BHB candidates are real members, there are other possible explanations for the apparent discrepancy. To estimate the distance we used the mean metallicity provided by Kirby et al. (2015). However, the 5 stars measured by Kirby et al. present a large dispersion in the range . Using the highest metallicity measured by Kirby et al. (which is a perfectly reasonable value for an RR Lyrae star), we obtained a heliocentric distance of 149 kpc. Thus, the discrepancy would be shortened (or disappear) if the metallicity of the RR Lyrae star is higher than the mean of the galaxy. We note that a dispersion in metallicity of 0.4 dex was included in the error propagation of the distance modulus, and thus, this lower value of distance is within our error estimation. Another possibility for the apparent discrepancy is that the RR Lyrae stars and the BHB stars have different evolutionary stage, with the latter being more evolved than the RR Lyrae star.
The increase in heliocentric distance also means that the physical size is larger and the galaxy is more luminous than previously thought. The revised values for these quantities are pc and , which re-affirms the nature of this system as a dwarf galaxy since it further separates it from the more compact group of globular clusters.
The possible association of Hydra II with the Magellanic Clouds (Martin et al., 2015) is still compatible with the new distance derived here. Hydra II still appears to lead the Clouds, being at a distance and location in the sky that is consistent with the future orbit of the LMC. It resides kpc from the LMC’s orbital plane. Further indications of this association come from the spectroscopic work by Kirby et al. (2015), who measured a radial velocity similar to the gas in the Magellanic stream at that position in the sky.
We note that there are no more RR Lyrae stars of similar magnitude in the neighborhood that could be interpreted as possible tidal debris material.
The lack of anomalous cepheids in Hydra II indicates that younger stellar populations may not exist in this galaxy or, if they exist, that they are not significant. On the other hand SX Phe stars are expected at 1.2 to 3 mag below the horizontal branch (Vivas & Mateo, 2013). Thus, if Hydra II has these type of stars they should have magnitudes between 22.9 and 24.7. Our photometric errors increase significantly in this magnitude range ( mags), potentially explaining why we may have not detected SX Phe stars in the galaxy. The faintest star we detected in the field is an SX Phe at but it is located too far from the center of Hydra II for us to suspect any relationship between them.
Figure 9 also shows the location of other variable stars that do not show periodic variability on scales of day. We examined the time series for each one of these stars including data from the discovery paper (Martin et al., 2015), which date from March 2013 ( days before the dataset presented here). No firm conclusions were drawn from this exercise, although some of these stars may be long period variables. Except for the stars at the faint end (), all others seem to be genuine variables. The position and observed amplitudes for these suspected variables (10 stars) are reported in Table 3.
5 RR Lyrae stars in ultra–faint dwarf galaxies
All dwarf galaxies that have been searched for variable stars, including the ultra–faint galaxies, have at least one RR Lyrae star. In Table 4 we show the number of RR Lyrae stars in all of the ultra faint dwarfs that have been explored to date, sorted by decreasing number of . Data for the absolute magnitudes and the number of RR Lyrae stars for most systems were taken from Sand et al. (2012) and Baker & Willman (2015), respectively. Data for Bootes III were taken from Sesar et al. (2014) and Correnti et al. (2009), and for Hydra II we adopted the values derived in this paper. Of all the galaxies with only one RR Lyrae star, Bootes III and Hydra II are the most luminous. There are several galaxies which are less luminous than Hydra II and contain one, or even two, RR Lyrae stars.
| Galaxy | ||
|---|---|---|
| Bootes I | 15 | |
| Hercules | 9 | |
| Bootes III | 1 | |
| Ursa Major I | 7 | |
| Leo IV | 3 | |
| Hydra II | 1 | |
| Canes Venatici II | 2 | |
| Ursa Major II | 1 | |
| Coma Berenice | 2 | |
| Segue2 | 1 | |
| BootesII | 1 | |
| Segue1 | 1 |
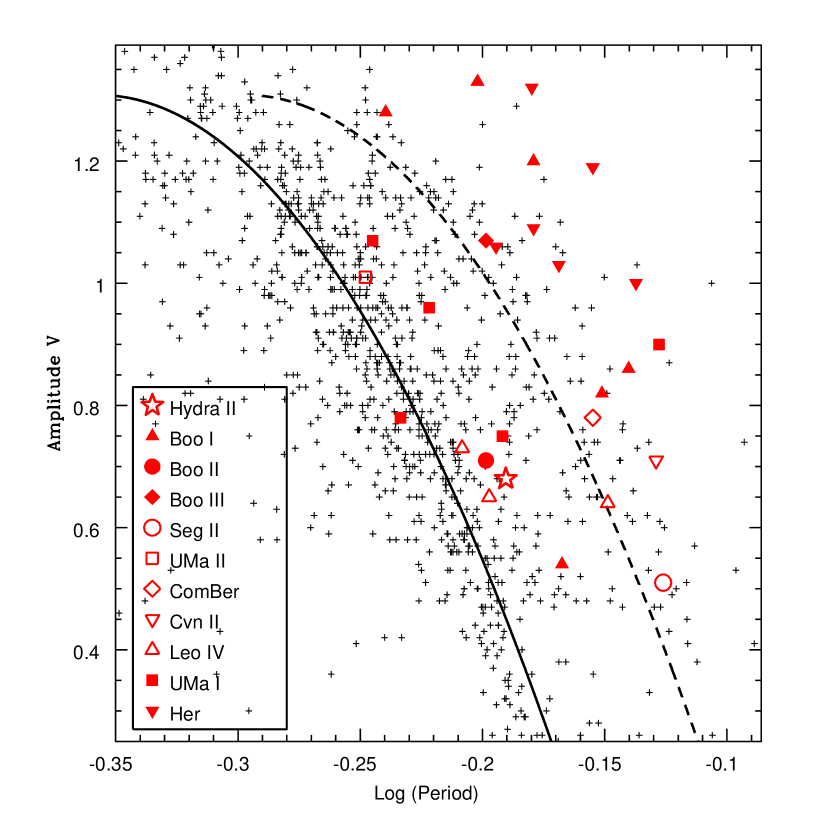
Globular clusters with 5 or more RR Lyrae stars are classified in Oosterhoff groups I and II based on the mean periods of their RRab stars; the mean periods are 0.55 and 0.65 days for Oo I and OoII systems, respectively (Catelan & Smith, 2015). The mean periods of RRab in a system or, more generally, the distribution of the RR Lyrae stars in the Period-Amplitude plane (or Bailey diagram) and its comparison with the locus in the same plane of RR Lyrae stars in Oo I and Oo II clusters, is also often used as reference to classify a stellar system in Oo I or Oo II like. Figure 10 shows the location of the Hydra II RR Lyrae star in the Bayley diagram, together with the location of the ab-type RR Lyrae in the other ultra–faint galaxies () that have been explored so far for variable stars (11 galaxies including Hydra II)999We are not including Segue 1 because although Simon et al. (2011) reports one RR Lyrae variable in this faint system based on spectroscopic variability, no accurate period or amplitude of the light curve has been derived for it.. To include the RR Lyrae variable of Hydra II in this diagram, we transformed first the best fit light curves templates in and into a light-curve using Equation 7. Our estimate for the amplitude of star 35.6516 is 0.56 mags. For Bootes I, only band amplitudes are available (Siegel, 2006). We transformed to amplitudes using , which was obtained from combining the and equations in Dorfi & Feuchtinger (1999). In the case of Bootes II, Bootes III and Ursa Major II, we revised the light curve parameters as explained in the Appendix.
Based on the period of the only RR Lyrae star in this system, Hydra II is then classified as an Oo II system. However, based on the Period-Amplitude diagram, Hydra II could be classified as an Oo-intermediate galaxy. This ambiguity in the classification is a reminder that Oosterhoff groups are based on mean properties of systems with several RR Lyrae stars. Most clusters present a spread around the mean values of the periods or around the loci in Bailey’s diagram (see discussion in Catelan, 2009; Catelan & Smith, 2015) and so, one star alone may not indicate the right group. In Hydra II, as it is the case for several other of the Milky Way’s ultra–faint dwarfs, only one RRab is present.
We also show in Figure 10 the distribution of halo field stars from the La Silla–QUEST survey (Zinn et al., 2014). It is clear that while the halo stars concentrate toward the Oo I locus, most of the RR Lyrae stars in the ultra-faint dwarfs (including Hydra II) are mainly located in the region of the Oo-intermediate and OoII loci. The mean period of the ensemble of 28 RR Lyrae stars in 11 ultra–faint dwarfs is 0.667 d. This value is significantly different from the mean value of the RR Lyrae stars in the halo (0.586 d) and in large satellite galaxies like the LMC (0.576 d), SMC (0.596 d), Sagittarius (0.575 d) and Fornax (0.585 d) (Zinn et al., 2014). If the Milky Way was formed by the accretion of small sub-structures as expected by the LCDM cosmology, the ultra–faint galaxies may contribute to the Oo II tail of the population of halo RR Lyrae, but they do not seem to be the source of the main population. As suggested by Zinn et al. (2014) the accretion of large galaxies similar to the LMC, SMC, Sgr or Fornax seems to be needed to assemble the RR Lyrae population of the halo. Fiorentino et al. (2015) proposed a similar scenario based on the existence of high amplitude short period (HASP) RR Lyrae stars in the Magellanic Clouds and Sgr dSph. They discarded Fornax-like galaxies as progenitor based on the lack of HASP stars in that galaxy. Similarly, as shown in Figure 10, not one of the RR Lyrae stars in the ultra–faint dwarf galaxies are located within the HASP region.
6 Conclusions
We obtained high–cadence time series photometry in the , , and bands in the field of the newly discovered ultra–faint galaxy Hydra II with DECam at CTIO to search for and characterize short period variable stars. We found 32 periodic variable stars in the field but only one, an RR Lyrae star, is located within the half–light radius of Hydra II. Assumed to be a Hydra II member, this star allowed us to improve the distance estimation to the galaxy. The distance calculation yielded 151 kpc from the Sun, or 148 kpc from the Galactic center, a distance which is farther away than the original estimate in the discovery paper (Martin et al., 2015). The larger distance also implies a larger physical size, pc, and brighter absolute magnitude, , for Hydra II.
No anomalous cepheids were found in the galaxy, suggesting that Hydra II does not contain a significant intermediate–age population.
The pulsational properties of the Hydra II RR Lyrae star are similar to those in other ultra-faint galaxies and they are different to the bulk of RR Lyrae stars in the halo of the Milky Way. Thus, in a hierarchical formation scenario, ultra–faint galaxies may have contributed to the long-period tail (Oo II group) of the period distribution of field RR Lyrae stars but accretion of large galaxies such as the Magellanic Clouds, Sagittarius or Fornax is needed to account for the predominantly Oo I population in the galactic halo.
Until now, all dwarf galaxies that have been adequately searched for variable stars have yielded RR Lyrae stars, which confirms that these systems predominantly contain old, metal-poor stellar populations. Hydra II is no exception.
Appendix A Revision of light curve parameters of RR Lyrae stars in Bootes II, Bootes III and Ursa Major II
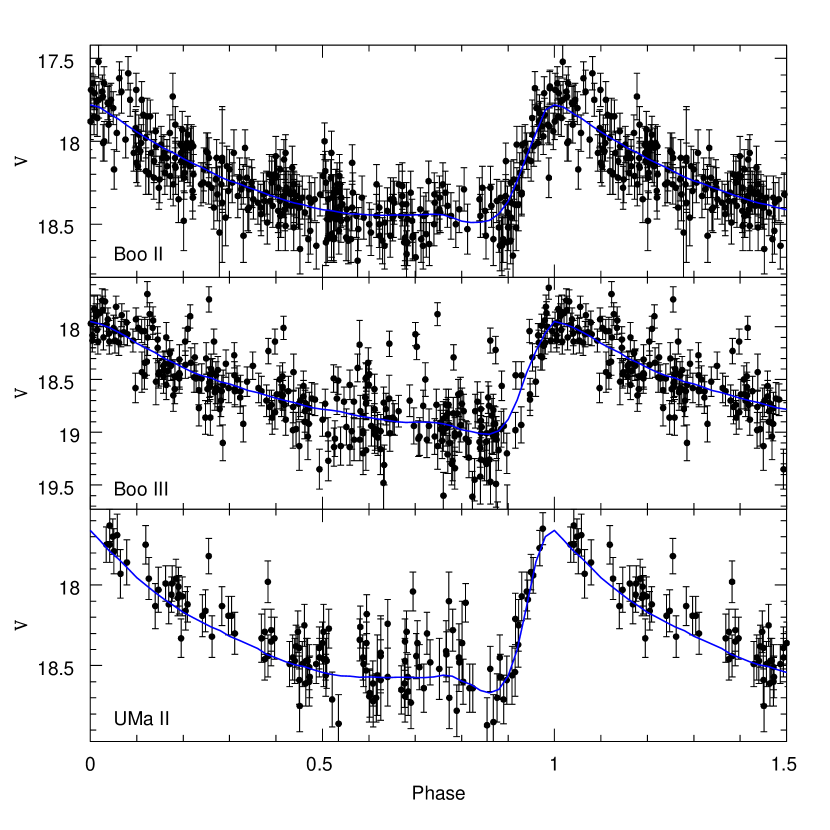
One RR Lyrae star of the type ab has been identified in each of the ultra-faint galaxies Bootes II, Bootes III and Ursa Major II. Data for these three stars are available on the CRTS webpage and with a large number of epochs () to ensure good light curve parameters. Dall’Ora et al. (2012) presented a small number of observations for the RR Lyrae star in Ursa Major II and they warned about a possible different period. This star has 136 epochs in CRTS and we found a period of 0.56512 d. No periodic signal near the 0.6593 d given by Dall’Ora et al. (2012) was found with the CRTS data. For the RR Lyrae star in Bootes III, Sesar et al. (2014) report multi-epoch observations in the Mould–R band from the Palomar Transient Factory (PTF). We used the CRTS data to derive the parameters for the band and thus were able to directly compare with other RR Lyrae stars in ultra–faint dwarfs in the Period–Amplitude diagram. Finally, Sesar et al. (2014) also report one RR Lyrae in Bootes I from the CRTS. However, the authors fitted the light curve using templates in the band. Here we use band templates to re–derive the parameters of its lightcurve. The results we obtained for this star are quite similar to those by Sesar et al. (2014).
We downloaded the light curve for the three variable stars in the CRTS101010http://nesssi.cacr.caltech.edu/DataRelease/ Data Release 2 (CRTS, Drake et al., 2009) based on the coordinates provided by Sesar et al. (2014) and Dall’Ora et al. (2012). We fit templates to the light curves following the same procedure described above for Hydra II. In this case however, we used the templates provided by Layden (1998) because they are more appropriate for band observations. The re–derived light curves for the stars in these three galaxies are shown in Figure 11 and the parameters are in Table 5. The table includes the period found previously by Dall’Ora et al. (2012) and Sesar et al. (2014).
| Galaxy | ID (CRST) | Period (d) | Amp (V) | N | Previous Period (d) | Previous Reference | |
|---|---|---|---|---|---|---|---|
| Bootes II | CSS_J135807.0+125123 | 0.66349 | 0.71 | 349 | 18.23 | 0.63328 | Sesar et al. (2014) |
| Bootes III | CSS_J140034.5+255552 | 0.63328 | 1.07 | 310 | 18.56 | 0.63327 | Sesar et al. (2014) |
| Ursa Major II | CSS_J085037.5+631009 | 0.56512 | 1.01 | 136 | 18.24 | 0.6593 | Dall’Ora et al. (2012) |
References
- Baker & Willman (2015) Baker, M., & Willman, B. 2015, AJ, 150, 160
- Bechtol et al. (2015) Bechtol, K., Drlica-Wagner, A., Balbinot, E., et al. 2015, ApJ, 807, 50
- Bernard et al. (2009) Bernard, E. J., Monelli, M., Gallart, C., et al. 2009, ApJ, 699, 1742
- Boettcher et al. (2013) Boettcher, E., Willman, B., Fadely, R., et al. 2013, AJ, 146, 94
- Breger (2000) Breger, M. 2000, in Astronomical Society of the Pacific Conference Series, Vol. 210, Delta Scuti and Related Stars, ed. M. Breger & M. Montgomery, 3
- Bressan et al. (2012) Bressan, A., Marigo, P., Girardi, L., et al. 2012, MNRAS, 427, 127
- Cacciari & Clementini (2003) Cacciari, C., & Clementini, G. 2003, in Lecture Notes in Physics, Berlin Springer Verlag, Vol. 635, Stellar Candles for the Extragalactic Distance Scale, ed. D. Alloin & W. Gieren, 105–122
- Cáceres & Catelan (2008) Cáceres, C., & Catelan, M. 2008, ApJS, 179, 242
- Catelan (2009) Catelan, M. 2009, Ap&SS, 320, 261
- Catelan et al. (2004) Catelan, M., Pritzl, B. J., & Smith, H. A. 2004, ApJS, 154, 633
- Catelan & Smith (2015) Catelan, M., & Smith, H. A. 2015, Pulsating Stars
- Clementini et al. (2012) Clementini, G., Cignoni, M., Contreras Ramos, R., et al. 2012, ApJ, 756, 108
- Correnti et al. (2009) Correnti, M., Bellazzini, M., & Ferraro, F. R. 2009, MNRAS, 397, L26
- Dall’Ora et al. (2012) Dall’Ora, M., Kinemuchi, K., Ripepi, V., et al. 2012, ApJ, 752, 42
- Deason et al. (2011) Deason, A. J., Belokurov, V., & Evans, N. W. 2011, MNRAS, 416, 2903
- Deason et al. (2015) Deason, A. J., Wetzel, A. R., Garrison-Kimmel, S., & Belokurov, V. 2015, MNRAS, 453, 3568
- D’Onghia & Lake (2008) D’Onghia, E., & Lake, G. 2008, ApJ, 686, L61
- Dorfi & Feuchtinger (1999) Dorfi, E. A., & Feuchtinger, M. U. 1999, A&A, 348, 815
- Drake et al. (2009) Drake, A. J., Djorgovski, S. G., Mahabal, A., et al. 2009, ApJ, 696, 870
- Drake et al. (2014) Drake, A. J., Graham, M. J., Djorgovski, S. G., et al. 2014, ApJS, 213, 9
- Drlica-Wagner et al. (2015) Drlica-Wagner, A., Bechtol, K., Rykoff, E. S., et al. 2015, ApJ, 813, 109
- Fiorentino & Monelli (2012) Fiorentino, G., & Monelli, M. 2012, A&A, 540, A102
- Fiorentino et al. (2012) Fiorentino, G., Stetson, P. B., Monelli, M., Bono, G., Bernard, E. J., & Pietrinferni, A. 2012, ApJ, 759, L12
- Fiorentino et al. (2015) Fiorentino, G., Bono, G., Monelli, M., et al. 2015, ApJ, 798, L12
- Flaugher et al. (2015) Flaugher, B., Diehl, H. T., Honscheid, K., et al. 2015, AJ, 150, 150
- Garofalo et al. (2013) Garofalo, A., Cusano, F., Clementini, G., et al. 2013, ApJ, 767, 62
- Greco et al. (2008) Greco, C., Dall’Ora, M., Clementini, G., et al. 2008, ApJ, 675, L73
- Kim & Jerjen (2015) Kim, D., & Jerjen, H. 2015, ApJ, 808, L39
- Kim et al. (2015) Kim, D., Jerjen, H., Mackey, D., Da Costa, G. S., & Milone, A. P. 2015, ApJ, 804, L44
- Kirby et al. (2015) Kirby, E. N., Simon, J. D., & Cohen, J. G. 2015, ApJ, 810, 56
- Klypin et al. (1999) Klypin, A., Kravtsov, A. V., Valenzuela, O., & Prada, F. 1999, ApJ, 522, 82
- Koposov et al. (2015) Koposov, S. E., Belokurov, V., Torrealba, G., & Evans, N. W. 2015, ApJ, 805, 130
- Lafler & Kinman (1965) Lafler, J., & Kinman, T. D. 1965, ApJS, 11, 216
- Layden (1998) Layden, A. C. 1998, AJ, 115, 193
- Martin et al. (2015) Martin, N. F., Nidever, D. L., Besla, G., et al. 2015, ApJ, 804, L5
- Mateo et al. (1998) Mateo, M., Hurley-Keller, D., & Nemec, J. 1998, AJ, 115, 1856
- Mateu et al. (2012) Mateu, C., Vivas, A. K., Downes, J. J., et al. 2012, MNRAS, 427, 3374
- McNamara (2011) McNamara, D. H. 2011, AJ, 142, 110
- Moore et al. (1999) Moore, B., Ghigna, S., Governato, F., et al. 1999, ApJ, 524, L19
- Moretti et al. (2009) Moretti, M. I., Dall’Ora, M., Ripepi, V., et al. 2009, ApJ, 699, L125
- Musella et al. (2009) Musella, I., Ripepi, V., Clementini, G., et al. 2009, ApJ, 695, L83
- Musella et al. (2012) Musella, I., Ripepi, V., Marconi, M., et al. 2012, ApJ, 756, 121
- Nemec et al. (1994) Nemec, J. M., Nemec, A. F. L., & Lutz, T. E. 1994, AJ, 108, 222
- Nidever et al. (2011) Nidever, D. L., Majewski, S. R., Muñoz, R. R., et al. 2011, ApJ, 733, L10
- Palaversa et al. (2013) Palaversa, L., Ivezić, Ž., Eyer, L., et al. 2013, AJ, 146, 101
- Pritzl et al. (2002) Pritzl, B. J., Armandroff, T. E., Jacoby, G. H., & Da Costa, G. S. 2002, AJ, 124, 1464
- Pritzl et al. (2005) Pritzl, B. J., Venn, K. A., & Irwin, M. 2005, AJ, 130, 2140
- Ripepi et al. (2014) Ripepi, V., Marconi, M., Moretti, M. I., et al. 2014, MNRAS, 437, 2307
- Sales et al. (2011) Sales, L. V., Navarro, J. F., Cooper, A. P., et al. 2011, MNRAS, 418, 648
- Sand et al. (2012) Sand, D. J., Strader, J., Willman, B., et al. 2012, ApJ, 756, 79
- Schlafly & Finkbeiner (2011) Schlafly, E. F., & Finkbeiner, D. P. 2011, ApJ, 737, 103
- Schlegel et al. (1998) Schlegel, D. J., Finkbeiner, D. P., & Davis, M. 1998, ApJ, 500, 525
- Sesar et al. (2010) Sesar, B., Ivezić, Ž., Grammer, S. H., et al. 2010, ApJ, 708, 717
- Sesar et al. (2014) Sesar, B., Banholzer, S. R., Cohen, J. G., et al. 2014, ApJ, 793, 135
- Siegel (2006) Siegel, M. H. 2006, ApJ, 649, L83
- Simon et al. (2011) Simon, J. D., Geha, M., Minor, Q. E., et al. 2011, ApJ, 733, 46
- Smith (1995) Smith, H. A. 1995, RR Lyrae stars (Cambridge Astrophysics Series, Cambridge, New York: Cambridge University Press, —c1995)
- Stetson (1987) Stetson, P. B. 1987, PASP, 99, 191
- Stetson (1994) —. 1994, PASP, 106, 250
- Suntzeff et al. (1991) Suntzeff, N. B., Kinman, T. D., & Kraft, R. P. 1991, ApJ, 367, 528
- Torrealba et al. (2015) Torrealba, G., Catelan, M., Drake, A. J., et al. 2015, MNRAS, 446, 2251
- Valdes et al. (2014) Valdes, F., Gruendl, R., & DES Project. 2014, in Astronomical Society of the Pacific Conference Series, Vol. 485, Astronomical Data Analysis Software and Systems XXIII, ed. N. Manset & P. Forshay, 379
- Vivas et al. (2008) Vivas, A. K., Jaffé, Y. L., Zinn, R., et al. 2008, AJ, 136, 1645
- Vivas & Mateo (2013) Vivas, A. K., & Mateo, M. 2013, AJ, 146, 141
- Vivas & Zinn (2006) Vivas, A. K., & Zinn, R. 2006, AJ, 132, 714
- Watkins et al. (2009) Watkins, L. L., Evans, N. W., Belokurov, V., et al. 2009, MNRAS, 398, 1757
- Wheeler et al. (2015) Wheeler, C., Oñorbe, J., Bullock, J. S., et al. 2015, MNRAS, 453, 1305
- Zinn et al. (2014) Zinn, R., Horowitz, B., Vivas, A. K., et al. 2014, ApJ, 781, 22
- Zorotovic et al. (2010) Zorotovic, M., Catelan, M., Smith, H. A., et al. 2010, AJ, 139, 357