Effect of magnetism on lattice dynamics of SrFe2As2 using high-resolution inelastic x-ray scattering
Abstract
Phonon spectra of detwinned SrFe2As2 crystals, as measured by inelastic x-ray scattering, show clear anisotropy accompanying the magneto-structural transition at 200 K. We model the mode splitting using magnetic DFT calculations, including a phenomenological reduction in force-constant anisotropy that can be attributed to magnetic fluctuations. This serves as a starting point for a general model of phonons in this material applicable to both the antiferromagnetically ordered phase and the paramagnetic phase. Using this model, the measured splitting in the magnetic phase below , and the measured phonon linewidth, we set a lower bound on the mean magnetic fluctuation frequency above at 210 K.
pacs:
The close proximity of superconductivity to an antiferromagnetic (AFM) phase in the iron-pnictides suggests that magnetic fluctuations are involved in the pairing mechanism that leads to the high superconducting transition temperature ()Kamihara et al. (2008). In fact, early density functional theory (DFT) calculations suggested that the electron-phonon coupling is too weak to account for the observed high-Boeri et al. (2008), implying that the superconductivity is not phonon mediated. On the other hand, the physical properties of iron-pnictides do exhibit a strong sensitivity to the latticeKreyssig et al. (2008); Lee et al. (2008); Mizuguchi et al. (2010); Yildirim (2009); Kuroki et al. (2009). This makes it interesting to study the relation between spin and lattice degrees of freedom in iron-pnictides.
Members of the AFe2As2 (A = Ba, Sr or Ca) iron-pnictide family typically exhibit, on cooling, a tetragonal () to orthorhombic () structural phase transition below followed by a magnetic phase transition into a collinear AFM ordered phase below ( )Zhao et al. (2008); Huang et al. (2008); Rotter et al. (2008), both of which break the 90∘ rotational C4 symmetry of the underlying tetragonal lattice. The emergence of the symmetry breaking also manifests in pronounced in-plane anisotropies as reported by transportChu et al. (2010), angle-resolved photoemission spectroscopy (ARPES)Yi et al. (2011), neutron scatteringZhao et al. (2009), optical spectroscopyNakajima et al. (2011) and torque magnetometryKasahara et al. (2012). This is often referred to as nematic order, and its origin has been one of the most intensively debated issues in iron-pnictide materialsFernandes et al. (2014). Despite the evidence of anisotropic behaviour, the phonon response is surprisingly isotropicFukuda et al. (2011); Reznik et al. (2009); Parshall et al. (2014). Phonon anisotropy should exist, in principle, and mode splitting has been seen using Raman scatteringChauvière et al. (2009), but anisotropy has not been observed at non-zero momentum transfers.
Here we report an inelastic x-ray scattering (IXS) study of detwinned single crystals of SrFe2As2. Our results clearly show anisotropy in phonon structure below Zhao et al. (2008) characterized by energy shifts and intensity changes of phonons at tetragonally-equivalent momentum transfers. To the best of our knowledge, this is the first observation of phonon anisotropy in iron-pnictides at finite momentum transfer. We compare our results to the DFT calculations and find that the best agreement is obtained by reducing the anisotropy of magnetic calculations by roughly a factor of 3. Based on this analysis, the underlying magnetic state of iron-pnictides and its effect on phonon response are discussed.
Single crystals of SrFe2As2 were grown by a self flux method described in Ref. Kobayashi et al. (2013). The crystals undergo concomitant structural and magnetic phase transitions at = 200 K. The tetragonal lattice parameters are Å and Å at room temperature. Throughout this paper, we use tetragonal notation with axes along the next-nearest-neighbor iron atoms. The magnetic structure of SrFe2As2 below is collinear with the ordered moment aligned antiferromagnetically (ferromagnetically) along the [1 0] ( [1 1 0] ) direction corresponding to the longer -axis (shorter -axis) of the orthorhombic lattice.
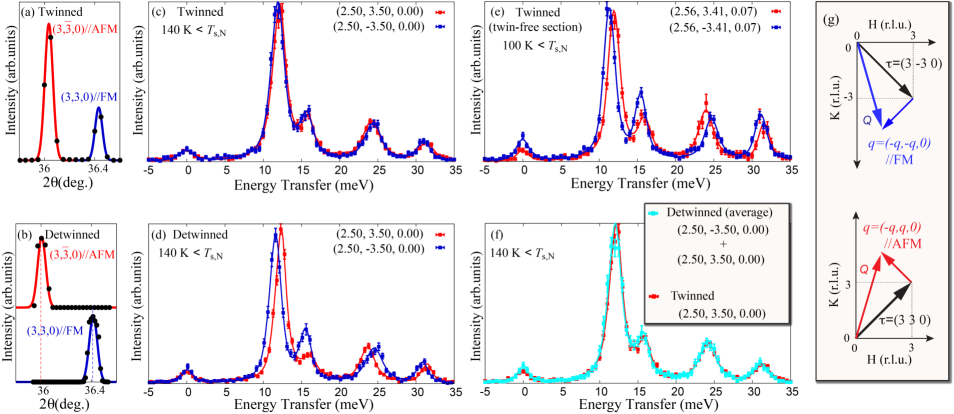
In the AFM phase, SrFe2As2 generally forms small twin domains, which obscure its intrinsic anisotropic properties. To avoid twinning, we applied uniaxial compressive pressure to a crystal before cooling below . The crystal was glued between two copper prongs (similar to a tuning fork) with a screw used to carefully adjust the pressure parallel to one [1 1 0] direction. For a twinned crystal, Bragg reflections of the tetragonal type exhibit splitting in 2 corresponding to two distinct -spacings (Fig. 1 (a)). Application of uniaxial pressure favors formation of domains with the shorter lattice constant parallel to the pressure axis [see Fig. 1(b)].
Phonon measurements using IXS were performed at BL35XUBaron et al. (2000) and BL43LXU Baron (2010) of SPring-8 in Japan. The scattered radiation was collected using a two-dimensional (2-D) analyzer array on a 10 m horizontal 2 arm, which allows parallelization of data collection in a 2-D section of momentum space Baron et al. (2008). The energy resolution was determined from measurements of plexiglas to be 1.5 meV - 1.8 meV at 21.747 keV (Si (11 11 11) geometry) depending on the analyzer crystals. The data were collected in transverse geometries along two tetragonally-equivalent lines corresponding to the two -M directions 111The literature is not always consistent as to the labelling of the Q point, often using M and occasionally X. We note this inconsistency here and use M in this paper.: (1) with parallel to the AFM ordered direction; (2) with parallel to the FM ordered direction [see Fig. 1 (g)]. These two -M directions become inequivalent in the AFM phase. Quantitative results were obtained by fitting the IXS spectra with the sum of a resolution-limited elastic peak and several damped harmonic oscillators (DHOs) for the phonon modes convoluted with the experimentally determined resolution function.
In Figs. 1 (c) and (d), we compare IXS spectra at for twinned and detwinned SrFe2As2 crystals in the AFM ordered state. For the twinned crystal in Fig. 1 (c), there is no clear evidence for any change between two tetragonally-equivalent momentum positions due to the twinning, except for a tiny ( 0.1 meV) energy shift of some of the modes. However, once detwinned, clear phonon anisotropy can be observed as easily seen in Fig. 1 (d) where both the frequencies and intensities of the modes change. In one case, we were able to observe the same effect even without the application of external pressure when we were fortunate enough to isolate large single domain section of a crystal. The resulting twin structure was not stable when the temperature was cycled, so most experiments were carried out under pressure. However, the fact that the same effect was observed without pressure [see Fig. 1 (e)] serves to confirm that the pressure does not significantly affect the response of these samples. Furthermore, IXS spectra measured on the stress-free twinned crystal can be reproduced by averaging those measured on detwinned crystal [see Fig.1 (f)]. This further confirms the intrinsic anisotropy of phonon structure in the AFM phase.
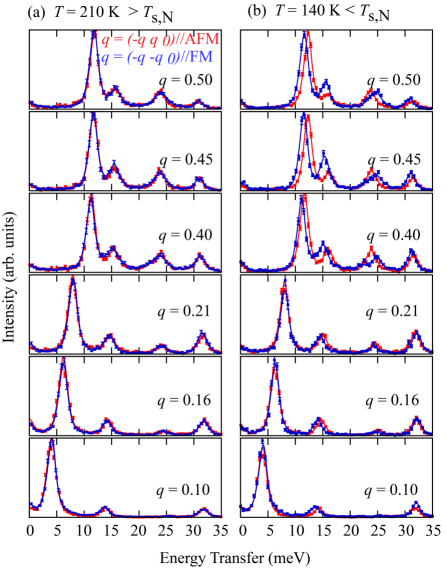
The momentum dependence of the changes observed across are shown in Fig.2. Above , IXS spectra are essentially identical in the two -M directions [see Fig. 2 (a)], as the crystal has rotational symmetry in tetragonal paramagnetic (PM) phase. In contrast, on lowering temperature below , which breaks the rotational symmetry, anisotropic phonon shifts develop between two -M directions [see Fig.2 (b)]. No significant change in line-width was observed across ( full-width at half-maximum (FWHM) of the 24 meV mode at = 0.50 is 0.70 0.10 meV for 140 K and 0.74 0.09 meV for 210 K ). Note that the small orthorhombic structural distortion ((a - b)/(a + b) 0.5 ) is expected to have only a very small direct effect on the phonons between the two -M directionsReznik et al. (2009). We therefore expect that the changes in the phonon energies are predominantly the result of the onset of the magnetic order, as opposed to the small orthorhombic structural distortion.
We compare the experimental results to the DFT calculations. All calculations were performed using the relaxed tetragonal structure () with generalized gradient approximation (GGA) using projector-augmented wave (PAW) pseudopotentials, as implemented in the Vienna Ab initio Simulation Package (VASP)Kresse and Hafner (1993); Kresse and Furthmüller (1996); Kresse and Furthmüller (1996). Phonons were calculated using a direct methodParlinski et al. (1997) for both nonmagnetic and magnetic ground states.
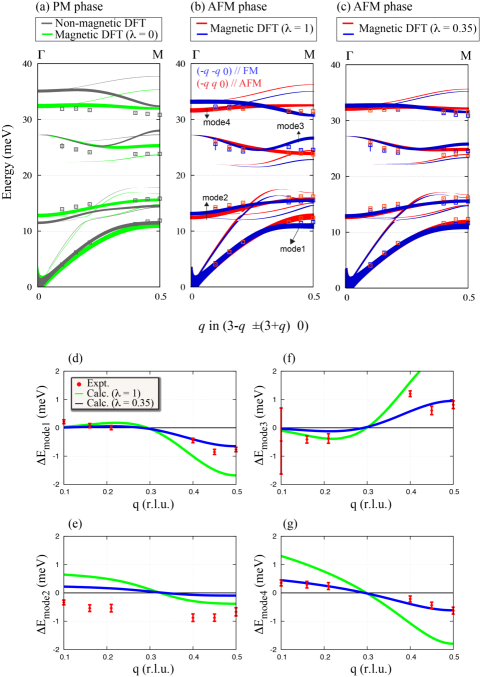
Fig. 3 shows the results of calculations and the data from the detwinned crystal. The non-magnetic calculation (grey curve in Fig. 3 (a)) fails to reproduce the experimental data, especially for the branch dispersing from 35 meV at point. The calculated energy of this branch is significantly higher than observed. The calculations can be brought into better agreement with the data if magnetism is included in the calculations [see the red and blue curves in Fig. 3 (b)], as suggested by the earlier work Fukuda et al. (2011); Reznik et al. (2009); Hahn et al. (2009). In general, magnetism has the biggest effect on some high energy branches, with lower energy branches relatively unaffected. Note that the change in relative intensity for the modes at 15 meV in Fig.1 (d) is also reproduced by calculations. However, the magnetic calculations predict splitting of modes that is much larger than we observe. This is evident in Fig. 3 (b), where the magnetic calculations give mode splitting of several meV near zone boundary, while our data shows splitting of 1 meV at most.
To gain insight into our results, we consider a phenomenological modification to the real space force-constant (FC) matrices. We decompose the magnetic FC matrices into parts obeying (tetragonal) and (magnetic) rotational symmetry as where and are the cartesian directions, and and specify a pair of atoms. The symmetry-recovered matrices are obtained by averaging tetragonally-equivelent matrices in the magnetic DFT. A similar symmetrization procedure has also been used to compute the FC matrices of iron in the high-temperature PM phaseKörmann et al. (2012). We then reconstruct the effective FC matrices by scaling term linearly in ,
| (1) |
where is a scaling factor that accounts for renormalization of the FC anisotropy. The optimal value of in the AFM phase is determined to be by numerical optimization of the magnitude of mode splitting E to match the measured values at each momentum transfer. We also considered a model where exponentially decays with length between a pair of atoms, but the best fit was obtained with the uniform linear scaling in Eq. 1. This, as well as the fact that we observe similar mode splitting at both high and low regions, indicates that there is not any characteristic length scale to the renormalization of FC anisotropy.
In Fig. 3 (c), we compare the rescaled magnetic calculations with the experimental data. One can see that the rescaled calculations show better overall agreement. In Fig.3 (d) - (g), the momentum dependence of the calculated mode splitting is shown in comparison with the experimental data. With a linear rescaling of FC anisotropy, the calculated mode splitting can be reduced to the level of the experimental data, except for mode 2 at 14 meV [see Fig.3 (e)]. The discrepancy between the calculated dispersion for mode 2 and the experimental values might be an indication of some missing ingredient that is not properly included in the calculations (e.g. orbital ordering). Nonetheless, the degree of agreement with the experimental data suggest that linear rescaling model in Eq. 1 is a good starting point to describe lattice dynamics of iron-pnictides.
Having established the better overall agreement with the data, we now move on to the physical interpretation of our results. The overestimation of the phonon anisotropy by the DFT calculations is reminiscent of the tendency of DFT calculations in iron-pnictides to give a significantly larger ordered moment (/Fe) Mazin et al. (2008); Mazin and Johannes (2009) than is observed in most experiments ()Zhao et al. (2008); Huang et al. (2008). It is interesting to note that a reduction factor of in Eq. (1) relative to the DFT is roughly comparable to that found for magnetic moment. This suggests that the magnitude of mode splitting is proportional to the size of the ordered moments. On the other hand, recent Fe 3 core level photoemission spectroscopy has revealed the presence of large local moment of fluctuating on a femtosecond time scale in the PM phaseVilmercati et al. (2012). These fluctuating local moments are expected to be ordered below , but the size of the ordered moment is, as mentioned above, significantly smaller than that of the local moments. On the theoretical side, there have been several attempts to understand the origin of the reduced ordered moment beyond DFT, using dynamical mean-field theory (DMFT)Hansmann et al. (2010); Yin et al. (2011a, b). These can explain the presence of large local moments which only give rise to much smaller ordered moment below . For example, Z. P. Yin have suggested that there is the strong orbital differentiation, with the orbitals more correlated than the orbitalsYin et al. (2011b). In this situation, the static ordered moment originates predominantly from more localized orbitals while fluctuating local moments in the orbitals do not acquire a static component below . Such orbital-selective correlations result in the reduced ordered moment in the AFM phase, and in analogy to this, one can expect the reduced phonon anisotropy. In this context, the term of Eq.(1) arises from the ordered moment while the term includes the contribution of the fluctuating moments. Note that even in the PM phase, where long-range AFM order is destroyed, the averaged magnetic FC matrices ( in Eq.1) gives better agreement with phonon dispersion than non-magnetic DFT [see grey and green curves in Fig.3 (a)]. We take this as an indication of the presence of fluctuating magnetism above , consistent with Ref. Vilmercati et al. (2012).
To understand the effect of fluctuations on the phonon response, we consider a simple model of a mass, , on a spring, where the spring constant fluctuates between two values, at random times governed by a negative exponential distribution with mean dwell time . As shown in the supplemental materials222See Supplemental Material for Phonon line-width and splitting in the presence of a fluctuating force constant., the shape of the power spectrum of the displacement is governed by and the frequency difference : for slow fluctuations, , there are two well defined lines whose width (FWHM) is given by , while for fast fluctuations, , the lines coalesce into a single line of width . Taking, as an example, the phonon widths quoted earlier of meV above and meV below with a splitting of meV, and assuming other contributions to the line width do not change through , suggests a mean magnetic fluctuation frequency THz. This assumes the broadening above is less than meV, where the 0.14 is the error on the difference. This frequency is lower than the limits suggested by other methodsVilmercati et al. (2012), but still valuable. A measurement with higher resolution (e.g. 0.01 meV as has been demonstrated in Ref.Aynajian et al. (2008)) might determine the fluctuation frequency more exactly.
We note that recently it was found, for small , that TA modes polarized in the [1 0 0] direction soften at Niedziela et al. (2011) and above Parshall et al. (2015) , and this was suggested to be related to the size of the fluctuating magnetic domainsParshall et al. (2015). While different than the present work, where we observe clear energy splitting over the full zone below , for differently polarized modes, that work also shows the sensitivity of the phonon measurements to magnetic order, and, indeed serves to highlight the potential to use careful phonon measurements to investigate both static and dynamical aspects of magneto-elastic coupling.
In summary, we reveal phonon anisotropy of SrFe2As2 below via measurements of detwinned single crystal, which allows us to measure single domain phonon structure in the AFM phase. The observed phonon anisotropy can be modeled by magnetic DFT calculations with a phenomenological reduction in force-constant anisotropy by roughly a factor of 3. In analogy to the small ordered moment in this materials, we suggest that the presence of magnetic fluctuations significantly reduces the phonon anisotropy that reflects the coupling to the static magnetic order.
Acknowledgements.
N.M acknowledges support from RIKEN Junior Research Associate Program. Work at SPring-8 was carried out under proposal numbers 2013A1467, 2013B1361, 2014A1207, 2014B1760, 2015A1813. This work was partially supported by JST IRON-SEA project, Japan.References
- Kamihara et al. (2008) Y. Kamihara, T. Watanabe, M. Hirano, and H. Hosono, Journal of the American Chemical Society 130, 3296 (2008).
- Boeri et al. (2008) L. Boeri, O. V. Dolgov, and A. A. Golubov, Phys. Rev. Lett. 101, 026403 (2008).
- Kreyssig et al. (2008) A. Kreyssig, M. A. Green, Y. Lee, G. D. Samolyuk, P. Zajdel, J. W. Lynn, S. L. Bud’ko, M. S. Torikachvili, N. Ni, S. Nandi, J. B. Leão, S. J. Poulton, D. N. Argyriou, B. N. Harmon, R. J. McQueeney, P. C. Canfield, and A. I. Goldman, Phys. Rev. B 78, 184517 (2008).
- Lee et al. (2008) C.-H. Lee, A. Iyo, H. Eisaki, H. Kito, M. T. Fernandez-Diaz, T. Ito, K. Kihou, H. Matsuhata, M. Braden, and K. Yamada, Journal of the Physical Society of Japan 77, 083704 (2008).
- Mizuguchi et al. (2010) Y. Mizuguchi, Y. Hara, K. Deguchi, S. Tsuda, T. Yamaguchi, K. Takeda, H. Kotegawa, H. Tou, and Y. Takano, Superconductor Science and Technology 23, 054013 (2010).
- Yildirim (2009) T. Yildirim, Physica C: Superconductivity 469, 425 (2009), superconductivity in Iron-Pnictides.
- Kuroki et al. (2009) K. Kuroki, H. Usui, S. Onari, R. Arita, and H. Aoki, Phys. Rev. B 79, 224511 (2009).
- Zhao et al. (2008) J. Zhao, W. Ratcliff, J. W. Lynn, G. F. Chen, J. L. Luo, N. L. Wang, J. Hu, and P. Dai, Phys. Rev. B 78, 140504 (2008).
- Huang et al. (2008) Q. Huang, Y. Qiu, W. Bao, M. A. Green, J. W. Lynn, Y. C. Gasparovic, T. Wu, G. Wu, and X. H. Chen, Phys. Rev. Lett. 101, 257003 (2008).
- Rotter et al. (2008) M. Rotter, M. Tegel, D. Johrendt, I. Schellenberg, W. Hermes, and R. Pöttgen, Phys. Rev. B 78, 020503 (2008).
- Chu et al. (2010) J.-H. Chu, J. G. Analytis, K. De Greve, P. L. McMahon, Z. Islam, Y. Yamamoto, and I. R. Fisher, Science 329, 824 (2010).
- Yi et al. (2011) M. Yi, D. Lu, J.-H. Chu, J. G. Analytis, A. P. Sorini, A. F. Kemper, B. Moritz, S.-K. Mo, R. G. Moore, M. Hashimoto, W.-S. Lee, Z. Hussain, T. P. Devereaux, I. R. Fisher, and Z.-X. Shen, Proceedings of the National Academy of Sciences 108, 6878 (2011).
- Zhao et al. (2009) J. Zhao, D. T. Adroja, D.-X. Yao, R. Bewley, S. Li, X. F. Wang, G. Wu, X. H. Chen, J. Hu, and P. Dai, Nat Phys 5, 555 (2009).
- Nakajima et al. (2011) M. Nakajima, T. Liang, S. Ishida, Y. Tomioka, K. Kihou, C. H. Lee, A. Iyo, H. Eisaki, T. Kakeshita, T. Ito, and S. Uchida, Proceedings of the National Academy of Sciences 108, 12238 (2011).
- Kasahara et al. (2012) S. Kasahara, H. J. Shi, K. Hashimoto, S. Tonegawa, Y. Mizukami, T. Shibauchi, K. Sugimoto, T. Fukuda, T. Terashima, A. H. Nevidomskyy, and Y. Matsuda, Nature 486, 382 (2012).
- Fernandes et al. (2014) R. M. Fernandes, A. V. Chubukov, and J. Schmalian, Nat Phys 10, 97 (2014).
- Fukuda et al. (2011) T. Fukuda, A. Q. R. Baron, H. Nakamura, S. Shamoto, M. Ishikado, M. Machida, H. Uchiyama, A. Iyo, H. Kito, J. Mizuki, M. Arai, and H. Eisaki, Phys. Rev. B 84, 064504 (2011).
- Reznik et al. (2009) D. Reznik, K. Lokshin, D. C. Mitchell, D. Parshall, W. Dmowski, D. Lamago, R. Heid, K.-P. Bohnen, A. S. Sefat, M. A. McGuire, B. C. Sales, D. G. Mandrus, A. Subedi, D. J. Singh, A. Alatas, M. H. Upton, A. H. Said, A. Cunsolo, Y. Shvyd’ko, and T. Egami, Phys. Rev. B 80, 214534 (2009).
- Parshall et al. (2014) D. Parshall, R. Heid, J. L. Niedziela, T. Wolf, M. B. Stone, D. L. Abernathy, and D. Reznik, Phys. Rev. B 89, 064310 (2014).
- Chauvière et al. (2009) L. Chauvière, Y. Gallais, M. Cazayous, A. Sacuto, M. A. Méasson, D. Colson, and A. Forget, Phys. Rev. B 80, 094504 (2009).
- Kobayashi et al. (2013) T. Kobayashi, S. Miyasaka, S. Tajima, T. Nakano, Y. Nozue, N. Chikumoto, H. Nakao, R. Kumai, and Y. Murakami, Phys. Rev. B 87, 174520 (2013).
- Baron et al. (2000) A. Baron, Y. Tanaka, S. Goto, K. Takeshita, T. Matsushita, and T. Ishikawa, Journal of Physics and Chemistry of Solids 61, 461 (2000).
- Baron (2010) A. Baron, SPring-8 Inf. Newsl. 15, 14 (2010).
- Baron et al. (2008) A. Q. Baron, J. P. Sutter, S. Tsutsui, H. Uchiyama, T. Masui, S. Tajima, R. Heid, and K.-P. Bohnen, Journal of Physics and Chemistry of Solids 69, 3100 (2008).
- Note (1) The literature is not always consistent as to the labelling of the Q point, often using M and occasionally X. We note this inconsistency here and use M in this paper.
- Kresse and Hafner (1993) G. Kresse and J. Hafner, Phys. Rev. B 47, 558 (1993).
- Kresse and Furthmüller (1996) G. Kresse and J. Furthmüller, Computational Materials Science 6, 15 (1996).
- Kresse and Furthmüller (1996) G. Kresse and J. Furthmüller, Phys. Rev. B 54, 11169 (1996).
- Parlinski et al. (1997) K. Parlinski, Z. Q. Li, and Y. Kawazoe, Phys. Rev. Lett. 78, 4063 (1997).
- Hahn et al. (2009) S. E. Hahn, Y. Lee, N. Ni, P. C. Canfield, A. I. Goldman, R. J. McQueeney, B. N. Harmon, A. Alatas, B. M. Leu, E. E. Alp, D. Y. Chung, I. S. Todorov, and M. G. Kanatzidis, Phys. Rev. B 79, 220511 (2009).
- Körmann et al. (2012) F. Körmann, A. Dick, B. Grabowski, T. Hickel, and J. Neugebauer, Phys. Rev. B 85, 125104 (2012).
- Mazin et al. (2008) I. I. Mazin, M. D. Johannes, L. Boeri, K. Koepernik, and D. J. Singh, Phys. Rev. B 78, 085104 (2008).
- Mazin and Johannes (2009) I. I. Mazin and M. D. Johannes, Nat Phys 5, 141 (2009).
- Vilmercati et al. (2012) P. Vilmercati, A. Fedorov, F. Bondino, F. Offi, G. Panaccione, P. Lacovig, L. Simonelli, M. A. McGuire, A. S. M. Sefat, D. Mandrus, B. C. Sales, T. Egami, W. Ku, and N. Mannella, Phys. Rev. B 85, 220503 (2012).
- Hansmann et al. (2010) P. Hansmann, R. Arita, A. Toschi, S. Sakai, G. Sangiovanni, and K. Held, Phys. Rev. Lett. 104, 197002 (2010).
- Yin et al. (2011a) Z. P. Yin, K. Haule, and G. Kotliar, Nat Phys 7, 294 (2011a).
- Yin et al. (2011b) Z. P. Yin, K. Haule, and G. Kotliar, Nat Mater 10, 932 (2011b).
- Note (2) See Supplemental Material for Phonon line-width and splitting in the presence of a fluctuating force constant.
- Aynajian et al. (2008) P. Aynajian, T. Keller, L. Boeri, S. M. Shapiro, K. Habicht, and B. Keimer, Science 319, 1509 (2008).
- Niedziela et al. (2011) J. L. Niedziela, D. Parshall, K. A. Lokshin, A. S. Sefat, A. Alatas, and T. Egami, Phys. Rev. B 84, 224305 (2011).
- Parshall et al. (2015) D. Parshall, L. Pintschovius, J. L. Niedziela, J.-P. Castellan, D. Lamago, R. Mittal, T. Wolf, and D. Reznik, Phys. Rev. B 91, 134426 (2015).