Metrology with -symmetric cavities: Enhanced sensitivity near the -phase transition
Abstract
We propose and analyze a new approach based on parity-time () symmetric microcavities with balanced gain and loss to enhance the performance of cavity-assisted metrology. We identify the conditions under which -symmetric microcavities allow to improve sensitivity beyond what is achievable in loss-only systems. We discuss its application to the detection of mechanical motion, and show that the sensitivity is significantly enhanced in the vicinity of the transition point from unbroken- to broken- regimes. We believe that our results open a new direction for -symmetric physical systems and it may find use in ultra-high precision metrology and sensing.
pacs:
42.65.Yj, 06.30.Ft, 42.50.WkIntroduction.— The measurement of physical quantities with high precision is the subject of metrology. This has attracted much attention due to the increasing interest in, e.g., gravitational wave detection RSchnabel , sensing of nanostructures Zhao ; Shi , as well as global positioning and navigation ESBurillo ; PMarks . Developments in metrology over the past two decades have provided the necessary tools to determine the fundamental limits of measuring physical quantities and the resources required to achieve them HMWiseman ; GYXiang .
Among many different approaches, cavity-assisted metrology (CAM), where a high-quality () factor cavity or resonator is coupled to a device under test (DUT), has emerged as a versatile and efficient experimental approach to achieve high-precision measurements. In CAM, the coupling between the resonator and the DUT manifests itself as a back-action-induced resonance frequency shift, resonance mode splitting, or a sideband in the output transmission spectrum Clerk . Cavity-assisted metrology has been successfully applied for reading out the state of a qubit Siddiqi , measuring tiny mechanical motions Aspelmeyer ; Dobrindt ; Guerlin ; Szorkovszky ; Galland ; Nunnenkamp ; Rabl ; Liao , and detecting nanoparticles with single-particle resolution JZhuNatPhonics ; HeNatNanotechnology .
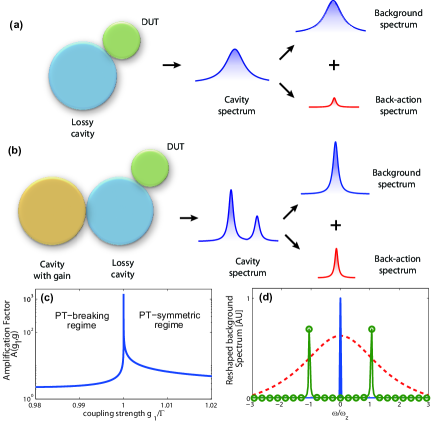
The readout signal (i.e., the transmission spectrum) of CAM is determined by the sum between the background spectrum of the cavity and the back-action spectrum of the DUT. The background spectrum is determined by the of the cavity whereas the back-action spectrum is determined by the strength of the cavity-DUT coupling (also dependent on ) and the quantity to be measured. A broad background spectrum masks the back-action spectrum and decreases signal-to-noise ratio (SNR) [Fig. 1(a)]. A higher coupling-strength between the cavity and the DUT and a higher of the cavity will be helpful to detect very weak signals and enable to resolve fine structures in the output spectra [Fig. 1(b)]. A higher is also necessary to enhance the coupling strength between the cavity and the DUT. For example, for optomechanical resonators, the detection of tiny motions requires a strong optomechanical coupling, which is only possible with an high -factor. Therefore, CAM will benefit significantly from a narrower background spectrum which is fundamentally limited by the material absorption loss of the cavity. Techniques that will help to reach the fundamental detection limit and measure very weak signals with existing cavities are being actively sought.
We show that the performance of CAM is significantly enhanced if the passive cavity (i.e., lossy; without optical gain) of the CAM is coupled to an auxiliary cavity with optical gain (i.e., active cavity) that balances the loss of the passive cavity. Such coupled systems with balanced gain and loss are referred to as parity-time () symmetric systems Bender , which have been widely studied both theoretically AASukhorukovPRA ; HRamezaniPRA ; ZLinPRL ; XZhuOL ; CHangPRL ; GSAgarwal ; HBenistyOE ; NLazaridesPRL ; YLumerPRL and experimentally AGuo ; CERuterNatPhys ; ARegensburgerNature ; LFengNatMaterial ; JSchindler ; SBittner ; CMBender ; NBenderPRL ; BPengNatPhys . As a specific application of -CAM, we show the enhancement in the detection of the motion of a nanomechanical resonator in the proximity of the passive microcavity of the -CAM. The enhancement is significant in the vicinity of the -phase transition point through which the system transits from broken- to unbroken- symmetry and vice versa. The mechanism for the enhancement of the measurement sensitivity in our system is attributed to two features. First, due to gain-loss balance we have almost lossless (extremely high-) supermodes and hence much narrower background spectrum. Thus, it becomes easier to resolve sideband induced by the DUT. Second, effective interaction strength between the optical modes and the DUT is significantly enhanced thereby allowing detection of very weak perturbations in the DUT.
Cavity-assisted metrology (CAM) with -symmetric microcavities.— The traditional CAM system is composed of a lossy resonant optical cavity coupled to a DUT [Fig. 1(a)]. The interaction Hamiltonian is given by , where is the annihilation operator of the cavity; is the DUT’s observable being measured; and is the coupling strength between the DUT and the cavity. In order to realize the -CAM, an active cavity is directly coupled to the lossy cavity connected [Fig. 1(b)]. Here we consider the -symmetric optical microcavities discussed in Ref. BPengNatPhys , where the inter-cavity coupling strength is controlled by the distance between the cavities, and the gain-to-loss ratio of the cavities is adjusted by the power of the optical pump of the active cavity. The Hamiltonian describing this -CAM is
| (1) |
where is the annihilation operator of the active cavity; and , respectively, denote the loss and gain rates of the passive and active cavities; is the inter-cavity coupling strength; and corresponds to the effective frequencies of the two cavities.
Without the interaction term , Eq.(1) accounts for the coupling between the optical modes of the microcavities and leads to two supermodes that are described with the complex frequencies , where , , and . Clearly, experiences a transition from a real to an imaginary value and vice versa at , where . At the transition point, the complex eigenfrequencies coalesce, that is .
For , is real (denoted as ) and hence the complex eigenfrequencies of the supermodes become , implying that two supermodes have different resonance frequencies [i.e., ] but the same damping rates and linewidths [i.e., ]. The separation of resonance frequencies is then given by . However, for , is imaginary, that is and hence the complex eigenfrequencies of the supermodes become , implying that two supermodes are degenerate in their resonance frequencies [i.e., ] but have different damping rates and linewidths quantified by .
When the gain of the active cavity balances the loss of the passive cavity, corresponds to a -phase transition point, where the supermodes coalesce, and becomes zero, implying a lossless system. The regime defined by corresponds to a -symmetric phase, where the lossless supermodes are split by . The regime defined by denotes the broken -phase where the supermodes have the same resonance frequencies, but one of them becomes lossy and the other becomes amplifying.
Rewriting the non-Hermitian Hamiltonian (1) in the supermode picture, we find that the effective coupling strength between the supermodes and the DUT can be written as Supp
| (2) |
Clearly, in the vicinity of the transition point , the effective coupling strength is significantly larger than . Therefore, the sensitivity is drastically enhanced near the transition point.
The mechanism of the -enhanced sensitivity can be seen in a more quantitative manner by calculating the output spectrum. Intuitively, the gain-loss balance of the -symmetric system makes the background spectrum narrower, and the cavity with gain in the system, which works as a dynamical amplifier, amplifies the back-action spectrum of the DUT and thus increases the sensitivity of the measurement. In the regime of weak coupling between the cavity and the DUT, we can omit the back-action of the cavity on the DUT. Then the normalized spectrum can be written as Supp
| (3) |
Here is the single-cavity background Lorentz spectrum calculated by setting the inter-cavity coupling strength . Here is the back-action spectrum from the DUT, with representing the spectrum of the DUT, and and are the Fourier and inverse Fourier transforms, respectively. The time-domain function is a form factor that will broaden the back-action spectrum Supp .
Equation (3) implies that the structure and the presence of the interaction between the lossy cavity and the DUT give rise to an amplification factor acting on the back-action spectrum [see Fig. 1(c)]. In the -breaking regime, when increases, first increases slowly from a very small value and then, near the phase transition point, increases very sharply, reaching a very high value. When is further increased and the system enters the -symmetric regime, the amplification factor drops sharply to a small value and continues decreasing, albeit with very slow rate as is increased.
In Fig.1(d) we show the background spectrum for a lossy cavity (red dashed curve) and for a structure in the -symmetric (green curve with circles) and in the broken--symmetric regimes (blue curve). Clearly, due to the presence of gain, the susceptibility coefficient reshapes , leading to a background spectrum which is significantly narrower than that of a single lossy cavity. Note that in the -symmetric regime, the background spectrum is split into two due to the strong coupling between the cavities, and that split resonance peaks seen in the spectrum is narrower than the resonance of the single lossy cavity. Combining the narrower background spectrum in a structure with the very high amplification factor in the vicinity of the -phase transition point will certainly lead to a significantly enhanced sensitivity for the CAM.
Optomechanical transducer by breaking.— Here let us discuss an optomechanical transducer operated in the vicinity of the -phase transition point. We consider that the lossy cavity of the structure supports a mechanical mode. The Hamiltonian of this optomechanical system is obtained from Eq. (1) by replacing the operator by , where is the annihilation operator of the mechanical mode. Similar to Eq. (3), we can obtain the output spectrum of this optomechanical system and compare it with the single-cavity case [see Fig. 2(b)]
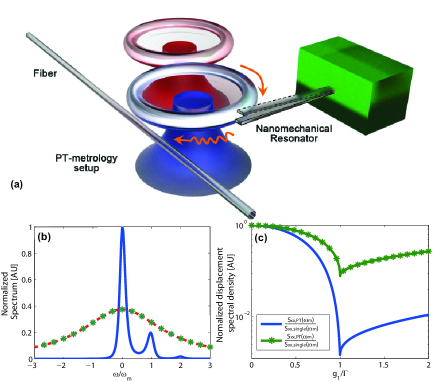
Here, let us consider a particular -symmetric optomechanical transducer realized by microtoriod resonators showed in Fig. 2(a). This -metrology system consists of two coupled microtoriod-resonators, where one is a silica microtoriod which acts as a passive cavity and the other is a -doped silica microtoriod which is taken as the active cavity BPengNatPhys . The microtoriod-based -metrology system is used to detect the tiny motion of the mechanical oscillator, e.g., a nanomechanical beam or cantilever, via the optical evanescent field of the passive microtoroid Anetsberger . In order to clearly show the differences between and a single-lossy-cavity optomechanics, we carried out numerical simulations using experimentally accessible values of system parameters: , MHz, MHz, MHz, MHz, MHz, and MHz. Since we have deliberately chosen the optomechanical coupling strength very small, the susceptibility coefficient of the single-cavity optomechanical system becomes very small, and thus the back-action spectrum of the mechanical oscillator is masked by the background spectrum of the cavity [see red dashed curve in Fig. 2(b)]. The output spectrum of the -symmetric transducer [blue curve in Fig. 2(b)] shows two distinct features originating from the gain-loss balance and the amplification mechanism. First, the background spectrum is narrower and the resonance peak located at has a higher value than the single loss-cavity peak. Second, the back-action spectrum of the mechanical motion is clearly seen as a sideband peak sitting on the background spectrum at . One can also see the second-order mechanical sideband as a smaller peak located away from the main peak of the background spectrum. These confirm that the -symmetric structure operated in the vicinity of the -phase transition point has the potential ability to detect very weak mechanical motion.
To show the enhancement of the measurement-sensitivity by the -symmetric structure, we compare the displacement spectral densities and of the -symmetric transducer and the single-lossy-cavity transducer. In fact, the displacement spectral density and the backaction force spectral density of the optomechanical transducer can be calculated as Supp ; Dobrindt :
| (4) | |||
| (5) |
where is the input power. It can be shown that and satisfy the Heisenberg inequality Braginsky : , which means that it is possible to obtain a smaller displacement spectral density when we increase the backaction force spectral density. As shown in Eq. (4), the displacement spectral density is proportional to the decay rate of the supermode and inversely proportional to the square of the effective optomechanical coupling strength . Since can be efficiently increased in the vicinity of the -transition point [see Eq. (2)] and the damping rate of the supermode will be decreased by the gain-loss balance of the -symmetric structure, thus the displacement spectral density of the optomechanical transducer will beat those limits given by the single-cavity case. This is confirmed by the numerical results shown in Fig. 2. Here can be more than two-order of magnitude smaller than the displacement spectral density of the single cavity.
Finally to show the effect of the presence of the gain in the structure, we compare the sensitivity of a system, formed by two coupled lossy cavities having loss rates of and with that of the -symmetric system formed by coupling a lossy cavity of loss rate with a gain cavity of gain rate Supp . Note that the loss rates of the cavities coupled to the mechanical mode is the same (i.e., ) for both systems. For the system formed by two lossy cavities, there also exists a degenerate point where the eigenfrequencies and the corresponding eigenstates of the system coalesce. This transition point is generally known as the exceptional point (EP) and has been studied in detail within the field of non-Hermitian Hamiltonian loss-2014 . For such a system the EP takes place at . In the vicinity of an EP, we have , as can be deduced from Eq. (2). For , the supermodes are split by but have the same damping rates , whereas for , the supermodes are degenerate at frequency but have different damping rates . Similar to the analysis for the -system, we derived the output spectrum in the vicinity of the EP and the amplification factor Supp . We find the ratio of the amplification factor of the -system to the two-lossy-cavity system to be , which implies that the amplification factor of the -system is higher and the ratio approaches infinite if the gain-to-loss ratio in the -system is well-balanced. In Fig. 2(b), we see that the normalized spectrum for the two-lossy-cavity (curve with green stars) is similar to that of the single-cavity system when the damping rates of the cavities are the same, and thus the back-action spectrum of the mechanical motion cannot be detected by the two-lossy-cavity. We also compare the displacement spectral density of -system with that of EP-system in Fig. 2(c). We can observe similar decrease of the displacement spectral density for and EP systems near the transition point, but the -system performs much better because the effective damping rate of the -system is much smaller due to the gain-loss balance of the -symmetric structure.
Conclusion.— We have proposed -metrology as a efficient approach to improve the sensitivity and detection limit of cavity-assisted metrology beyond what is attainable in the conventional settings, where the system to-be-measured is coupled to a lossy cavity. In -metrology a second cavity with gain is coupled to the lossy cavity to compensate its loss, thereby increasing the quality factor of the effective optical mode that is used to detect the weak signal, and enhancing the effective coupling strength between the cavity and the DUT. The enhancement is remarkable especially in the vicinity of the transition point where the supermodes of the system coalesce in their frequencies, and can be further enhanced as the gain-to-loss ratio approaches 1. We have showed that it is possible to realize an ultra-sensitive optomechanical transducer whose sensitivity is at least two order of magnitude better than the conventional single-cavity optomechanical transducers. We believe that this approach can be used for improving the performance of nanoparticle sensors Jan , navigation systems, gravity-wave detectors and other cavity-assisted detection schemes.
YXL and JZ are supported by the National Basic Research Program of China (973 Program) under Grant No. 2014CB921401, the Tsinghua University Initiative Scientific Research Program, and the Tsinghua National Laboratory for Information Science and Technology (TNList) Cross-discipline Foundation. JZ is supported by the NSFC under Grant Nos. 61174084, 61134008, 60904034. YXL is supported by the NSFC under Grant Nos. 10975080, 61025022, 91321208. F.N. is partially supported by the RIKEN iTHES Project, MURI Center for Dynamic Magneto-Optics via the AFOSR award number FA9550-14-1-0040, and a Grant-in-Aid for Scientific Research (A). LY is supported by ARO Grant No. W911NF-12-1-0026.
References
- (1) R. Schnabel, N. Mavalvala, D. E. McClelland, and P. K. Lam, Nat. Comm. 1, 121 (2010).
- (2) N. Zhao, J. L. Hu, S. W. Ho, J.T.K. Wan, and R. B. Liu, Nature Nanotechnology 6, 242 (2011).
- (3) F. Shi et al., Nature Physics 10, 21 (2014).
- (4) E. Sánchez-Burillo, J. Duch, J. Gómez-Gardeñes, and D. Zueco, Sci. Rep. 2, 605 (2012).
- (5) P. Marks, New Scientist 222, 19 (2014).
- (6) H. M. Wiseman, Phys. Rev. Lett. 75, 4587-4590 (1995).
- (7) G. Y. Xiang, B. L. Higgins, D. W. Berry, H. M. Wiseman, and G. J. Pryde, Nat. Photon. 5, 43-47(2011).
- (8) A. A. Clerk, M. H. Devoret, S. M. Girvin, Florian Marquardt, and R. J. Schoelkopf, Rev. Mod. Phys. 82, 1155 (2010).
- (9) I. Siddiqi et al., Phys. Rev. B 73, 054510 (2006).
- (10) M. Aspelmeyer, T. J. Kippenberg, and F. Marquardt, arXiv:1303.0733v1.
- (11) J. M. Dobrindt and T. J. Kippenberg, Phys. Rev. Lett. 104, 033901 (2010).
- (12) C. Guerlin et al., Nature 448, 889 (2007).
- (13) A. Szorkovszky, A. A. Clerk, A. C. Doherty, and W. P. Bowen, New J. Phys. 16, 043023 (2014).
- (14) C. Galland, N. Sangouard, N. Piro, N. Gisin, and T. J. Kippenberg, Phys. Rev. Lett. 112, 143602 (2014).
- (15) A. Nunnenkamp, K. Børkje, and S. M. Girvin, Phys. Rev. Lett. 117, 063602 (2011).
- (16) P. Rabl, Phys. Rev. Lett. 107, 063601 (2011).
- (17) J.-Q Liao, H. K. Cheung, and C. K. Law, Phys. Rev. A 85, 025803 (2012).
- (18) J. Zhu et al., Nature Photonics 4, 46-49 (2010).
- (19) L. He, S. K. Ozdemir, J. Zhu, W. Kim, and L. Yang, Nature Nanotechnology 6, 428-432 (2011).
- (20) C. M. Bender, Rept. Prog. Phys. 70, 947-1018 (2007).
- (21) A. A. Sukhorukov, Z. Xu, and Y. S. Kivshar, Phys. Rev. A 82, 043818 (2010).
- (22) H. Ramezani, T. Kottos, R. El-Ganainy, and D. N. Christodoulides, Phys. Rev. A 82, 043803 (2010).
- (23) Z. Lin et al., Phys. Rev. Lett. 106, 213901 (2011).
- (24) X. Zhu, L. Feng, P. Zhang, X. Yin, and X. Zhang, Opt. Lett. 38, 2821 (2013).
- (25) C. Hang, G. Huang, and V. V. Konotop, Phys. Rev. Lett. 110, 083604 (2013).
- (26) G. S. Agarwal and K. Qu, Phys. Rev. A 85, 031802 (2012).
- (27) H. Benisty et al., Opt. Exp. 19, 18004 (2011).
- (28) N. Lazarides and G. P. Tsironis, Phys. Rev. Lett. 110, 053901 (2013).
- (29) Y. Lumer, Y. Plotnik, M. C. Rechtsman, and M. Segev, Phys. Rev. Lett. 111, 26390 (2013).
- (30) A. Guo et al., Phys. Rev. Lett. 103, 093902 (2009).
- (31) C. E. Rüter et al., Nat. Phys. 6, 192 (2010).
- (32) A. Regensburger et al., Nature 488, 167 (2012).
- (33) L. Feng et al., Nat. Mater. 12, 108 (2012).
- (34) J. Schindler, A. Li, M. C. Zheng, F. M. Ellis, and T. Kottos, Phys. Rev. A 84, 040101(R) (2011).
- (35) S. Bittner et al., Phys. Rev. Lett. 108, 024101 (2012).
- (36) C. M. Bender, B. K. Berntson, D. Parker, E. Samuel, Am. J. Phys. 81, 173-179 (2013).
- (37) N. Bender et al., Phys. Rev. Lett. 110, 234101 (2013).
- (38) B. Peng et al., Nat. Phys. 10, 394-398 (2014).
- (39) See Supplementary Materials for more details.
- (40) G. Anetsberger,O. Arcizet, Q. P. Unterreithmeier, R. Riviere, A. Schliesser, E. M. Weig, J. P. Kotthaus and T. J. Kippenberg. Nature Phys. 5, 909-914 (2009)
- (41) H. Jing et al., Phys. Rev. Lett. 113, 053604 (2014).
- (42) J. M. Dobrindt and T. J. Kippenberg, Phys. Rev. Lett. 104, 033901 (2010).
- (43) V. B. Braginsky and F. Khalili, Quantum measurement (Cambridge University Press, Cambridge, England, 1992).
- (44) B. Peng et al., Science 346, 328 (2014).
- (45) J. Wiersig, Phys. Rev. Lett. 112, 203901 (2014).