,
High accuracy CO2 line intensities determined from theory and experiment
Abstract
Atmospheric CO2 concentrations are being closely monitored by remote sensing experiments which rely on knowing line intensities with an uncertainty of 0.5% or better. Most available laboratory measurements have uncertainties much larger than this. We report a joint experimental and theoretical study providing rotation-vibration line intensities with the required accuracy. The ab initio calculations are extendible to all atmospherically important bands of CO2 and to its isotologues. As such they will form the basis for detailed CO2 spectroscopic line lists for future studies.
pacs:
33.20.Ea, 33.20.Vq, 92.60.hg, 92.60.VbThe quantity of carbon dioxide (CO2) in the earth’s atmosphere and its role in climate change has become a hotly debated topic both in scientific and non-scientific circles. Several agencies are flying (for example GOSAT Butz et al. (2011), ACE Bernath et al. (2005), MIPAS Fischer et al. (2008), OCO-2 Crisp et al. (2004)) or preparing to launch (such as CarbonSat Velazco et al. (2011) and ASCENDS Abshire et al. (2010)) experiments or even whole missions to explicitly monitor the atmospheric CO2 content or to do this as part of wider scientific programmes. Similarly, international ground-based networks such as the total carbon column observation network (TCCON) Wunch et al. (2011) and the Network for the Detection of Atmospheric Composition Change (NDACC) Hase (2012) are also dedicated to monitoring atmospheric CO2. A major aim of this activity is to establish CO2 concentrations at the parts per million (ppm) level or, preferably, better. These projects aim not only to look at global CO2 levels and their variations, but also at sources and sinks of CO2. This activity is clearly vital to monitoring and hopefully controlling the anthropic greenhouse effect due to CO2 and hence climate change.
All CO2 remote sensing activities, from both the ground and space, rely on monitoring CO2 vibration-rotation spectra. They are therefore heavily dependent on laboratory spectroscopy for reliable parameters which are essential for interpreting the atmospheric spectroscopic data. These parameters are of three types: line centres, line profiles and line intensities. Line centres or positions are established to high accuracy in many laboratory high resolution spectroscopy studies and in general do not require significant improvement for studies of the earth’s atmosphere. Line profiles are more difficult to determine, but significant progress on these has been made in recent years with, for example, the inclusion of line mixing in both the HITRAN database Rothman et al. (2013) and many retrieval models. Here we specifically focus on the issue of determining accurate line intensities. We present first results from a newly-developed experiment designed to measure line intensities with an uncertainty of 0.3 %, and a new ab initio model also designed to achieve this level of accuracy.
Accurate line intensities are crucial for a successful retrieval since they relate directly to the CO2 column being retrieved. Without high accuracy values for line intensities, reliable retrievals are simply not possible. If current missions are to fulfil their goals intensities accurate to 0.3 – 0.5 % are really required Miller et al. (2007). The laboratory procedures used up to now simply do not give this level of accuracy and current retrievals values are limited by the available laboratory data Connor et al. (2008); Wuebbeler et al. (2011); Sioris et al. (2014). Data are required not only for the main isotopologue, 12C16O2, but also for isotopically substituted species such as 14C16O2, which can be used to monitor recently added fossil-fuel-derived carbon emissions Lehman et al. (2013).
It is much harder to accurately measure line intensities than line positions in the laboratory. Typical uncertainties for experimental line intensity data used in atmospheric models and retrievals are 3 to 10 % Wang et al. (2005); Perevalov et al. (2008); Song et al. (2010) and even high quality measurements (eg Boudjaadar et alBoudjaadar et al. (2006)) usually only provide accuracies in the 1 to 3 % range, still significantly worse than required for precision remote sensing. There are three published studies aimed at measuring CO2 line intensities with an accuracy better than 1 % Casa et al. (2007, 2009); Wuebbeler et al. (2011). However these studies only considered a small set of lines, in the case of Wuebbler et al Wuebbeler et al. (2011) only a single line, and do not agree with each other within their given uncertainties. On the theory side Huang et al have recently performed a comprehensive treatment of the CO2 vibration-rotation spectrum Huang et al. (2012, 2013, 2014) using theoretical procedures similar to those employed here. These studies produced an excellent spectroscopically determined potential energy surface (PES), which we use below, but had a more limited goal for the accuracy of their intensities of between 3 and 5 %.
The aim of this work is to provide an accurate theoretical solution to the problem of CO2 line intensities based on the application of high-accuracy, ab initio quantum mechanical calculations tested against laboratory measurements of unprecedented low uncertainty. An advantage of our calculations is that they can be applied not only to all bands of importance but also to all isotopically substituted variants of the molecule with essentially uniform precision. The disadvantage of ab initio methods has been traditionally that they are hard to perform to high accuracy and it is difficult to estimate their uncertainty. Here we present a joint experimental and theoretical study demonstrating an ab initio theoretical model capable of reproducing line intensities of 12C16O2 with a combined uncertainty of about 0.3%.
Theoretically, the intensity of a given spectral line is directly proportional to the square of the transition dipole, , where and are the initial and final wavefunction. For a vibration-rotation transition, is the dipole moment surface (DMS) and the integration runs over all coordinates of the nuclei. The accurate calculation of molecular line intensities requires an accurate DMS and an accurate potential energy surface (PES) to provide wavefunctions. The rotation-vibration Schrödinger equation is solved numerically to compute wavefunctions; we use the DVR3D program suite Tennyson et al. (2004) for that purpose. Experience shows that best results are obtained by combining a spectroscopically determined PES with a fully ab initio DMS Lodi et al. (2011).
Here we use the highly accurate, empirical, CO2 PES of Huang et al Huang et al. (2012). What we require is an extra-high-accuracy CO2 DMS. Systematic studies of the DMS of water Lodi et al. (2008, 2011) have shown that sub-1 % accuracy requires consideration of many effects neglected in standard ab initio treatments and that there is a strong correlation between the accuracy of the DMS and the underlying PES associated with it Lodi et al. (2011). A number of studies Huang et al. (2012); Pavanello et al. (2012) have also demonstrated the importance of generating the DMS using a dense grid of points. As shown for water Polyansky et al. (2003, 2013), the key ingredients for a high-accuracy ab initio treatment involve the use of multireference configuration interaction (MRCI) calculations with large basis sets (5 or 6-zeta quality) and of large active spaces. It is furthermore necessary to add various corrections due to relativity (and even quantum electrodynamics) and failure of the Born-Oppenheimer (BO) approximation.
Water is a 10 electron system which lends itself to large systematic calculations. These calculations scale combinatorially and therefore are not currently computationally feasible for the 22-electron CO2 molecule. For this reason it was necessary to design a new model: preliminary test calculations with this model, detailed in the supplementary material, were performed for CO.
Our calculations used the MOLPRO Werner et al. (2012) quantum chemistry package to calculate the PES and DMS of CO2 at about 2000 randomly-selected points with energies up to about 15 000 cm-1 above the minimum. The calculations used all-electron MRCI and the aug-cc-pwCVQZ basis set. Relativistic corrections were determined from the one-electron mass-velocity-Darwin (MVD1) term and fitted separately. The DMS was determined using finite-field effects rather than as an expectation value. As CO2 is heavier and more rigid than water, it transpired that non-BO corrections are of lesser importance, as has been shown before Huang et al. (2012), and were not included. Full details of the calculation, including analytic representations of our final ab initio DMS, which were obtained as polynomial expansions in symmetry coordinates, and the associated PES are given in the supplementary material.
DVR3D calculations for the three fundamental bands of 12C16O2 using our ab initio PES show that the discrepancy between calculated and observed energy levels is about 1 cm-1, almost an order of magnitude smaller than the best previous ab initio calculations Huang et al. (2012). This level of accuracy for the energy levels should be a pointer towards the accuracy of the corresponding DMS and suggests that the intensity of strong and medium lines should be predicted to within 0.5 %.
We made the most accurate measurements ever reported for CO2 line intensities using the frequency-stabilized cavity ring-down spectroscopy (FS-CRDS) Hodges et al. (2004); Hodges and Ciuryło (2005); Long et al. (2012) technique. FS-CRDS is a high-accuracy method that yields absorption spectra in terms of known integer multiples of the longitudinal mode spacing of a resonant optical cavity (-axis) and observed cavity decay times (-axis). In contrast to other absorption spectroscopy methods, this approach is immune to intensity and frequency fluctuations in the probe laser, consists of a relatively compact sample volume and does not require explicit determination of the absorption path length. Our gas samples consisted of a known molar fraction of CO2 in air with values that were referenced to gravimetrically prepared primary standard mixtures. Further, to mitigate exchange of CO2 with internal surfaces of the spectrometer, the sample gas was continuously introduced into the absorption spectrometer. Using this approach we measured the spectroscopic areas of 27 vibration-rotation transitions of CO2 in the wave number region 6200 - 6258 cm-1. These spectroscopic features correspond to - and -branch transitions of the 12C16O2 (30013)-(00001) vibrational band.
The individual transitions were probed using the frequency-agile, rapid scanning spectroscopy (FARS) method Truong et al. (2013) to rapidly and precisely tune the laser in a stepwise fashion through successive cavity resonances. To this end, we used a high-finesse (1.6105), 75-cm-long cavity ring-down spectrometer whose length was actively stabilized with respect to a frequency-stabilized HeNe laser having a drift (on the time scale of spectrum acquisition) of less than 0.5 MHz. Two continuous-wave, distributed-feedback diode (DFB) lasers (1 MHz nominal line width) provided the wavelength coverage required to interrogate all the CO2 transitions reported.
Relative standard deviations in the absorption coefficient, , at a given frequency, , were 0.08 , and over the entire 10 GHz spectral window spectra were acquired in 45 s giving spectrum signal-to-noise (SNR) ratios of 5000:1. Between 20 and 100 spectra were acquired at pressures corresponding to 6.7 kPa, 13.3 kPa and 20 kPa. Typically, we fit each observed line with the sum of a linear baseline and multiple quadratic speed-dependent Nelkin-Ghatak profiles (qSDNGPs) Ciuryło (1988) (one for each observed line) to the etalon-subtracted spectrum (). This analysis gave the fitted area (, ) at each pressure, , and temperature, . Here we report the average, measured, pressure-independent line intensity .
Gas pressure and cell temperature were actively stabilized to minimize drift during the acquisition of each spectrum, and the measurements of and were traceable to NIST primary standards. Nominal relative standard uncertainties (RSUs) considered include: spectrum tuning step size (0.001 ), statistical uncertainty in fitted area (0.01 ), pressure (0.015 ), systematic residual area uncertainty (0.02 ), uncertainty in isotopic composition (0.02 ), gas temperature (0.05 ), variations in baseline etalons (0.05-0.9 ) and sample molar fraction (0.07 ). Adding these components in quadrature gives RSU values ranging from 0.1 - 1, with the strongest lines being relatively insensitive to baseline uncertainties and having RSUs between 0.1 and 0.2 . We attribute these exceptionally low combined uncertainties to the high fidelity and sensitivity of the FS-CRDS method and to the accurately known CO2 concentration in the sample gas.
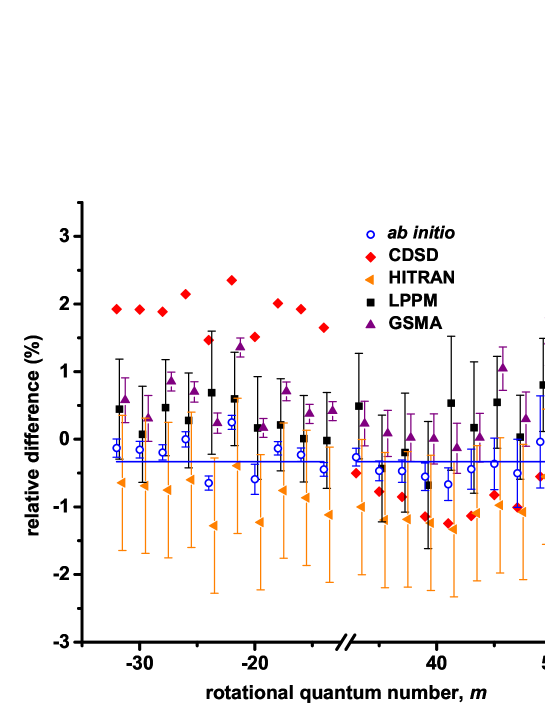
Figure 1 compares literature values for the (30013) – (00001) band of 12C16O2 with the present ab initio calculations and our measurements. These results are summarized as the relative intensity difference versus rotational quantum number . The literature results include two independent sets of measurements reported by Boudjaadar et al. Boudjaadar et al. (2006) (LPPM and GSMA) and other intensities given in HITRAN 2012 Rothman et al. (2013). These three data sets are based on Fourier transform spectroscopy measurements of pure carbon dioxide samples. We also include intensities archived in the carbon dioxide spectral databank (CDSD) Tashkun and Perevalov (2011), which are based on fits to several spectroscopic measurements. When taken together, the relative intensity differences have a standard deviation and mean of 0.9 , and 0.03 , respectively. We find the smallest root-mean-square deviation (0.23 ) and minimum absolute relative difference (0.33 ) when comparing the present calculations to our measurements. These results confirm that the relative uncertainties of the present ab initio intensity calculations and measurements are in good agreement and well below the percent level, which constitutes a substantial improvement over previous intensity measurements.
Intensities of the (20012) – (00001) band of 12C16O2 has also been the subject of precision studies. As shown in Fig. 2, only one of the intensities measured by Casa et al Casa et al. (2007, 2009) is within 0.3 % of our calculations, while the average relative difference is greater than 1 %. However, for one of these problematic lines, R(12), the intensity has been remeasured independently by Wuebbeler et al Wuebbeler et al. (2011). This remeasured value is within 0.2 % of our calculated value. It would appear that the intensities of Casa et al are measured less accurately than claimed.
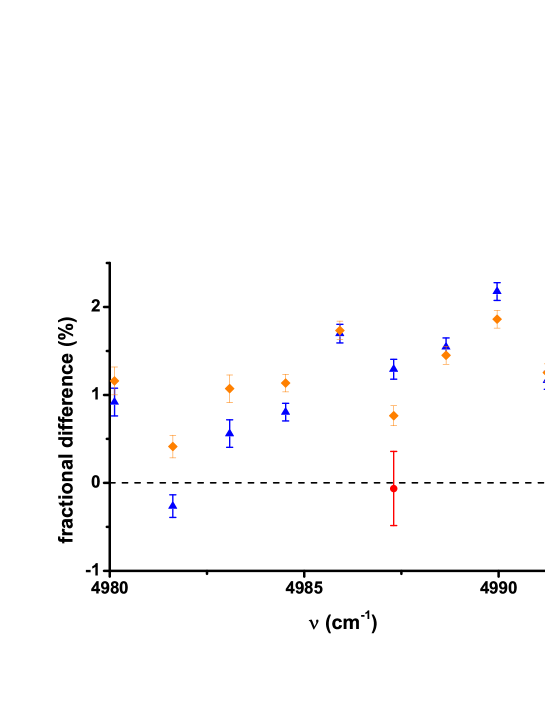
Table 1 compares our calculated intensities with those given in HITRAN for different R(10) transitions: these results are typical of comparisons with other transitions. Good agreement, within the rather large HITRAN uncertainties, is found in all cases. In particular, we note that very good agreement, to about 0.4 % and 0.2 % respectively, is obtained for transitions within the two fundamental bands, (01101) – (00001) and (00011) – (00001) (fuller results are given in the supplementary material). We suggest that this is not a coincidence. These HITRAN intensities are the result of calculations using a fitted, effective DMS Tashkun et al. (1999). As the constants of the effective DMS responsible for these strong fundamental bands are determined by fits to both these and over 100 other bands, the large amount of data available from a wide variety of experiments leads to an overall accuracy of the line intensities which should significantly improve on the average 2-5 % uncertainty in the experimental data used in the fit. The excellent agreement demonstrates both the extreme accuracy of our calculations and the effectiveness of the Hamiltonian fit in this case. Furthermore, for all bands, the relative differences between the HITRAN and calculated intensities are generally much smaller in magnitude than the rather large HITRAN uncertainties given in Table 1. We suggest that our new intensities generally represent a considerable improvement in accuracy and that the HITRAN uncertainties may be reduced substantially by taking into account the present calculations.
| Band | /cm-1 | (H) | (C) | (H-C)/H (%) | Unc.(%) |
|---|---|---|---|---|---|
| (01101) | 676.01 | 1.524() | 1.519() | 0.35 | 5 |
| (11102) | 1941.12 | 7.262() | 5.975() | 17.73 | 20 |
| (11101) | 2085.46 | 2.576() | 2.571() | 0.19 | 10 |
| (00011) | 2357.32 | 3.116() | 3.117() | -0.04 | 5 |
| (21103) | 3190.15 | 1.302() | 1.284() | 1.42 | 20 |
| (21102) | 3347.91 | 1.694() | 1.721() | -1.61 | 20 |
| (21101) | 3509.27 | 1.071() | 1.108() | -3.47 | 20 |
| (10012) | 3621.06 | 3.351() | 3.395() | -1.31 | 5 |
| (02211) | 3667.64 | 1.765() | 1.787() | -1.23 | 20 |
| (10011) | 3722.94 | 5.162() | 5.228() | -1.27 | 5 |
| (31104) | 4424.87 | 3.062() | 3.356() | -9.61 | 20 |
| (31103) | 4599.65 | 3.865() | 3.986() | -3.14 | 20 |
| (31102) | 4761.96 | 5.544() | 5.687() | -2.58 | 20 |
| (20013) | 4861.93 | 2.370() | 2.370() | 0.00 | 5 |
| (12212) | 4896.40 | 4.070() | 3.972() | 2.40 | 20 |
| (31101) | 4946.98 | 3.061() | 2.362() | 22.85 | 20 |
| (20012) | 4985.93 | 1.127() | 1.156() | -2.60 | 5 |
| (12211) | 5070.13 | 4.949() | 4.889() | 1.21 | 20 |
| (30013) | 6236.03 | 1.515() | 1.551() | -2.38 | 10 |
We present new high accuracy measurements and ab initio calculations of transition intensities for the key 12C16O2 molecule. Agreement between calculations and experiments is at the 0.3 level, which represents a significant improvement over previous theoretical and measured values. Our theoretical procedure is capable of producing comprehensive line lists not only for 12C16O2 but also for the various isotopically substituted versions. These line lists, for which experimental line frequencies can be used, will give a significant and important improvement in CO2 line intensities available for atmospheric remote sensing and other studies. These line lists will be presented elsewhere.
Acknowledgement
This work was supported by UK Natural Environment Research Council under grant NE/J010316, ERC Advanced Investigator Project 267219, the Russian Fund for Fundamental Studies, and the Climate Sciences Measurements Program of the National Institute of Standards and Technology and state project IAP RAS No.0035-2014-009.
References
- Butz et al. (2011) A. Butz, S. Guerlet, O. Hasekamp, D. Schepers, A. Galli, I. Aben, C. Frankenberg, J. M. Hartmann, H. Tran, A. Kuze, et al., Geophys. Res. Lett. 38, L14812 (2011).
- Bernath et al. (2005) P. F. Bernath, C. T. McElroy, M. C. Abrams, C. D. Boone, M. Butler, C. Camy-Peyret, M. Carleer, C. Clerbaux, P. F. Coheur, R. Colin, et al., Geophys. Res. Lett. 32, L15S01 (2005).
- Fischer et al. (2008) H. Fischer, M. Birk, C. Blom, B. Carli, M. Carlotti, T. von Clarmann, L. Delbouille, A. Dudhia, D. Ehhalt, M. Endemann, et al., Atmos. Chem. Phys. 8, 2151 (2008).
- Crisp et al. (2004) D. Crisp, R. Atlas, F. Breon, L. Brown, J. Burrows, P. Ciais, B. Connor, S. Doney, I. Fung, D. Jacob, et al., Adv. Space Res. 34, 700 (2004).
- Velazco et al. (2011) V. A. Velazco, M. Buchwitz, H. Bovensmann, M. Reuter, O. Schneising, J. Heymann, T. Krings, K. Gerilowski, and J. P. Burrows, Atmos. Meas. Tech. 4, 2809 (2011).
- Abshire et al. (2010) J. B. Abshire, H. Riris, G. R. Allan, C. J. Weaver, J. Mao, X. Sun, W. E. Hasselbrack, A. Yu, A. Amediek, Y. Choi, et al., SPIE 7832, 78320D (2010).
- Wunch et al. (2011) D. Wunch, G. C. Toon, J.-F. L. Blavier, R. A. Washenfelder, J. Notholt, B. J. Connor, D. W. T. Griffith, V. Sherlock, and P. O. Wennberg, Phil. Trans. Royal Soc. London A 369, 2087 (2011).
- Hase (2012) F. Hase, Atmos. Meas. Tech. 5, 603 (2012).
- Rothman et al. (2013) L. S. Rothman, I. E. Gordon, Y. Babikov, A. Barbe, D. C. Benner, P. F. Bernath, M. Birk, L. Bizzocchi, V. Boudon, L. R. Brown, et al., J. Quant. Spectrosc. Radiat. Transf. 130, 4 (2013).
- Miller et al. (2007) C. E. Miller, D. Crisp, P. L. DeCola, S. C. Olsen, J. T. Randerson, A. M. Michalak, A. Alkhaled, P. Rayner, D. J. Jacob, P. Suntharalingam, et al., J. Geophys. Res. 112, D10314 (2007).
- Connor et al. (2008) B. J. Connor, H. Boesch, G. Toon, B. Sen, C. Miller, and D. Crisp, J. Geophys. Res. 113, D05305 (2008).
- Wuebbeler et al. (2011) G. Wuebbeler, G. J. P. Viquez, K. Jousten, O. Werhahn, and C. Elster, J. Chem. Phys. 135, 204304 (2011).
- Sioris et al. (2014) C. E. Sioris, C. D. Boone, R. Nassar, K. J. Sutton, I. E. Gordon, K. A. Walker, and P. F. Bernath, Atmos. Meas. Tech. 7, 2243 (2014).
- Lehman et al. (2013) S. J. Lehman, J. B. Miller, C. Wolak, J. Southon, P. P. Tans, S. A. Montzka, C. Sweeney, A. Andrews, B. LaFranchi, T. P. Guilderson, et al., Radiocarbon 55, 1484 (2013).
- Wang et al. (2005) L. Wang, V. I. Perevalov, S. A. Tashkun, Y. Ding, and S.-M. Hu, J. Mol. Spectrosc. 234, 84 (2005).
- Perevalov et al. (2008) B. V. Perevalov, A. Campargue, B. Gao, S. Kassi, S. A. Tashkun, and V. I. Perevalov, J. Mol. Spectrosc. 252, 190 (2008).
- Song et al. (2010) K. F. Song, S. Kassi, S. A. Tashkun, V. I. Perevalov, and A. Campargue, J. Quant. Spectrosc. Radiat. Transf. 111, 332 (2010).
- Boudjaadar et al. (2006) D. Boudjaadar, J.-Y. Mandin, V. Dana, N. Picqué, and G. Guelachvili, J. Mol. Spectrosc. 236, 158 (2006).
- Casa et al. (2007) G. Casa, D. A. Parretta, A. Castrillo, R. Wehr, and L. Gianfrani, J. Chem. Phys. 127, 084311 (2007).
- Casa et al. (2009) G. Casa, R. Wehr, A. Castrillo, E. Fasci, and L. Gianfrani, J. Chem. Phys. 130, 184306 (2009).
- Huang et al. (2012) X. Huang, D. W. Schwenke, S. A. Tashkun, and T. J. Lee, J. Chem. Phys. 136, 124311 (2012).
- Huang et al. (2013) X. Huang, R. S. Freedman, S. A. Tashkun, D. W. Schwenke, and T. J. Lee, J. Quant. Spectrosc. Radiat. Transf. 130, 134 (2013).
- Huang et al. (2014) X. Huang, R. R. Gamache, R. S. Freedman, D. W. Schwenke, and T. J. Lee, J. Quant. Spectrosc. Radiat. Transf. 147, 134 (2014).
- Tennyson et al. (2004) J. Tennyson, M. A. Kostin, P. Barletta, G. J. Harris, O. L. Polyansky, J. Ramanlal, and N. F. Zobov, Comput. Phys. Commun. 163, 85 (2004).
- Lodi et al. (2011) L. Lodi, J. Tennyson, and O. L. Polyansky, J. Chem. Phys. 135, 034113 (2011).
- Lodi et al. (2008) L. Lodi, R. N. Tolchenov, J. Tennyson, A. E. Lynas-Gray, S. V. Shirin, N. F. Zobov, O. L. Polyansky, A. G. Császár, J. van Stralen, and L. Visscher, J. Chem. Phys. 128, 044304 (2008).
- Pavanello et al. (2012) M. Pavanello, L. Adamowicz, A. Alijah, N. F. Zobov, I. I. Mizus, O. L. Polyansky, J. Tennyson, T. Szidarovszky, A. G. Császár, M. Berg, et al., Phys. Rev. Lett. 108, 023002 (2012).
- Polyansky et al. (2003) O. L. Polyansky, A. G. Császár, S. V. Shirin, N. F. Zobov, P. Barletta, J. Tennyson, D. W. Schwenke, and P. J. Knowles, Science 299, 539 (2003).
- Polyansky et al. (2013) O. L. Polyansky, R. I. Ovsyannikov, A. A. Kyuberis, L. Lodi, J. Tennyson, and N. F. Zobov, J. Phys. Chem. A 117, 9633–9643 (2013).
- Werner et al. (2012) H.-J. Werner, P. J. Knowles, G. Knizia, F. R. Manby, and M. Schütz, WIREs Comput. Mol. Sci. 2, 242 (2012).
- Hodges et al. (2004) J. T. Hodges, H. P. Layer, W. M. Miller, and G. E. Scace, Rev. Sci. Instrum. 75, 849 (2004).
- Hodges and Ciuryło (2005) J. T. Hodges and R. Ciuryło, Rev. Sci. Instrum. 76, 023113 (2005).
- Long et al. (2012) D. A. Long, A. Cygan, R. D. van Zee, M. Okumura, C. E. Miller, D. Lisak, and J. T. Hodges, Chem. Phys. Lett. 536, 1 (2012).
- Truong et al. (2013) G. W. Truong, K. O. Douglass, S. E. Maxwell, R. D. van Zee, D. F. Plusquellic, J. T. Hodges, and D. A. Long, Nat. Photon. 7, 532 (2013).
- Ciuryło (1988) R. Ciuryło, Phys. Rev. A 58, 1029 (1998).
- Tashkun and Perevalov (2011) S. A. Tashkun and V. I. Perevalov, J. Quant. Spectrosc. Radiat. Transf. 112, 1403 (2011).
- Tashkun et al. (1999) S. A. Tashkun, V. I. Perevalov, J. L. Teffo, and V. G. Tyuterev, J. Quant. Spectrosc. Radiat. Transf. 62, 571 (1999).
- (38) See Supplemental Material [url], which includes Refs. [39-45]
- (39) Lodi, L. & Tennyson, J. J. Phys. B: At. Mol. Opt. Phys. 43, 133001 (2010).
- (40) Pyykkö, P. et al. Phys. Rev. A 63, 024502 (2001).
- (41) Polyansky, O. L., Lodi, L., Tennyson, J. & Zobov, N. F. Towards experimental accuracy from first principles: ab initio calculation of the energy levels and line intensities for the CO molecule (2014). (in preparation).
- (42) Tennyson, J. & Sutcliffe, B. T. J. Mol. Spectrosc. 101, 71–82 (1983).
- (43) Verkouteren, R. M. Anal. Chem. 71, 4740–4746 (1999).
- (44) Long, D. A., Wójtewicz, S. & Hodges, J. T. SPIE 8726, 87260O–2 (2013).
- (45) Courtois, J., Bielska, K. & Hodges, J. T. JOSA B 30, 1486–1495 (2013).