789\Yearpublication2015\Yearsubmission2015\Month11\Volume999\Issue88\DOIThis.is/not.aDOI
later
Chemical composition of a sample of bright solar-metallicity stars ††thanks: Data obtained at Observatoire de Haute Provence, with the SOPHIE spectrograph.
Abstract
We present a detailed analysis of seven young stars observed with the spectrograph SOPHIE at the Observatoire de Haute-Provence for which the chemical composition was incomplete or absent in the literature. For five stars, we derived the stellar parameters and chemical compositions using our automatic pipeline optimized for F, G, and K stars, while for the other two stars with high rotational velocity, we derived the stellar parameters by using other information (parallax), and performed a line-by-line analysis. Chromospheric emission-line fluxes from Ca ii are obtained for all targets. The stellar parameters we derive are generally in good agreement with what is available in the literature. We provide a chemical analysis of two of the stars for the first time. The star HIP 80124 shows a strong Li feature at 670.8 nm implying a high lithium abundance. Its chemical pattern is not consistent with it being a solar sibling, as has been suggested.
keywords:
Galaxy: abundances - stars: abundance – stars: activity – stars: atmospheres1 Introduction
Active stars are late-type stars which show emission components of resonance lines in their spectra, which originate in chromospheric layers of the stellar atmosphere. In the solar atmosphere, line emissions appear in regions where magnetic fields are strong, so the presence of these fields must be linked to the solar activity. Several properties of these stars have been analysed (Strassmeier 2009; Mamajek & Hillenbrand 2008; Pizzolato et al. 2003). For example, correlation of activity with magnetic fields (e.g. Montesinos et al. 1987); with rotational periods (e.g. Karak et al. 2014; Takeda et al. 2010; Suárez Mascareño et al. 2015; Montes et al. 2001), (but we have to warn that does not strictly mean rotation period); inverse correlation with age due to decrease of stellar rotation with age (e.g. López-Santiago et al. 2010); binarity (e.g Eker et al. 2008); and relation with Li abundance (e.g. Strassmeier et al. 2012; Takeda et al. 2010; Israelian et al. 2009; Delgado Mena et al. 2014, 2015). We found no complete abundance analyses in the literature for some of the bright members of this class of stars. Accurate metallicity determination is important to derive stellar age, when this is based on isochrones, so that one can use the isochrones at the right metallicity. Their chemical composition is also important to put these stars in the correct place in the chemical evolution in the Milky Way and in the investigation of atmospheric phenomena, such as diffusion.
The sample of active stars for which a detailed chemical analysis is lacking or missing is large, but our choice of the sample we analysed was constrained in brightness and coordinates by the telescope size and assigned telescope time we had. Among the interesting candidates, we selected the ones with the constraint to be observable at the beginning of March, in the last part of the night, and being bright enough to give a quality spectrum sufficient for a chemical analysis with the spectrograph SOPHIE on a 2 m class telescope. We present the chemical analysis of seven bright stars observed at Observatoire de Haute-Provence (OHP): HIP 67344, HIP 74858, HIP 75132, HIP 81284, HIP 90864, HIP 80124, and UMi.
2 Observations
The spectra were obtained between the 1st and 5th March 2014 at Observatoire de Haute-Provence, using the SOPHIE spectrograph (Bouchy & Sophie Team 2006; Perruchot et al. 2008, 2011) with the High Efficiency (HE) fibers, that provide a resolving power in the range between 43 000 and 37 000, depending on the position along the order111http://www.obs-hp.fr/guide/sophie/thorium_psf.html. The spectra cover the wavelength range from 387.2 nm to 694.3 nm. We have a single spectrum for each program star except for HIP 80124 for which we have two observations. The time of the observations and exposure times are provided in Table 1. In the table we provide also the radial velocity (RV) derived by the Geneva pipeline, along with its root mean square error. We used this RV to shift the spectra before analysing them with our automatic pipeline. We need a precision in RV of the order of the for the chemical analysis and the pipeline of SOPHIE is largely adapted for this. The pipeline derives also the projected rotational velocity () that we provide although we did not use it. The method for deriving is based on the width of the cross-correlation function and is described in detail in Boisse et al. (2010, Appendix B), the expected accuracy for the SOPHIE High Resolution (HR) fibres is 1 . No estimate is provided for the HE mode that we use. Since the resolving power in HE mode is roughly one half of that in HR mode we think that it is justified to assume an error of 2 on the estimates. We also stress that the above method has been shown to provide robust results for up to 20 , but it is not well calibrated for fast rotators, in which cases the errors can be much larger. For HIP 75132 (HD 136655) the pipeline failed to determine and for HIP 79022 (eta UMi) it gave an unrealistically high value.
| star | V | UT | UT | MJD | RV | S/N | ||
|---|---|---|---|---|---|---|---|---|
| HIP (HD) | date | h:m:s.sss | days | s | km/s | km/s | order 15 | |
| Ceres | 2014-03-02 | 02:12:37.657 | 56718.092106 | 600 | 3.7 | |||
| HIP 67344 (HD 120205) | 8.34 | 2014-03-05 | 02:11:44.823 | 56721.611164 | 2700 | 4.6 | 152 | |
| HIP 74858 (HD 136137) | 6.65 | 2014-03-02 | 04:08:49.329 | 56718.678534 | 600 | 6.2 | 145 | |
| HIP 75132 (HD 136655) | 9.02 | 2014-03-05 | 03:00:24.486 | 56721.648568 | 3600 | 150 | ||
| HIP 81284 (HD 150202) | 7.97 | 2014-03-06 | 03:05:39.845 | 56722.650633 | 3600 | 7.8 | 195 | |
| HIP 90864 (HD 171067) | 7.19 | 2014-03-04 | 03:46:59.156 | 56720.678779 | 4000 | 3.8 | 81 | |
| HIP 80124 (HD 147443) | 8.71 | 2014-03-02 | 03:52:49.614 | 56718.651949 | 1800 | 38 | 110 | |
| HIP 80124 (HD 147443) | 8.71 | 2014-03-04 | 03:42:41.831 | 56720.634653 | 3600 | 34 | 74 | |
| HIP 79822 ( UMi) | 4.95 | 2014-03-06 | 04:08:19.898 | 56722.172454 | 300 | 85a | 258 |
a this value comes from our analysis.
3 Chemical analysis
A sub-sample of our spectra have been analysed with the pipeline MyGIsFOS (Sbordone et al. 2014). This code simulates the traditional analysis in an automatic way; it derives atmospheric parameters and detailed stellar abundances. The analysis done by MyGIsFOS proceeds as follows:
-
•
The effective temperature, , is derived from a set of isolated Fe i lines. A null slope is imposed to the linear fit of the lower energy of the Fe i lines versus the abundance.
-
•
The micro-turbulence, , is derived by imposing a null slope to the equivalent width (EW) of isolated Fe i lines as a function of the abundance derived from these lines.
-
•
log g is determined from Fe i and Fe ii ionisation equilibrium.
-
•
Fe abundance is determined from Fe i lines.
-
•
The enhancement of -elements is determined by measuring lines of various elements, and using their average abundance ratio [X/Fe], as as an estimate of [/Fe].
-
•
All [X/H] for all X element represented in the spectrum are derived from lines of X i or X ii.
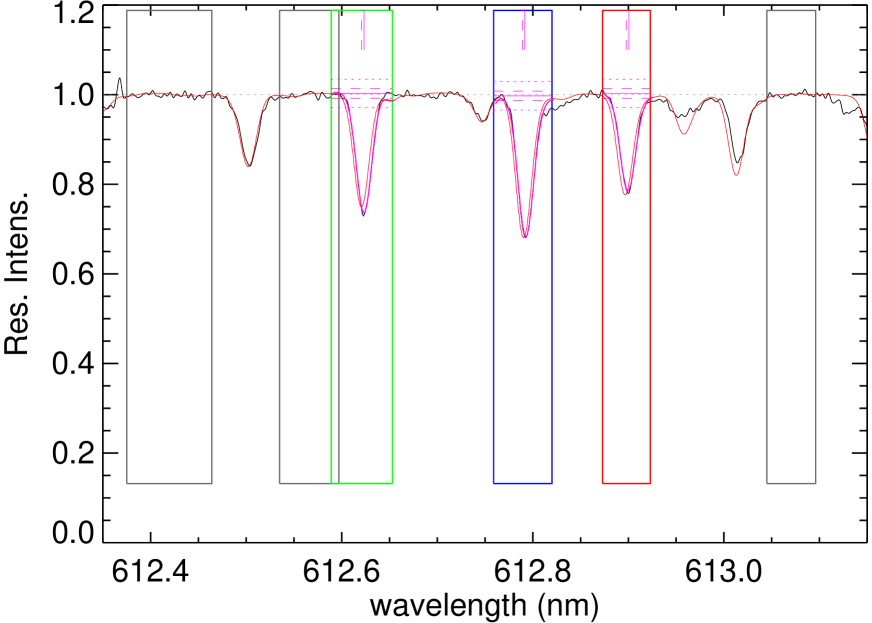
An example of the analysis done by MyGIsFOS is shown in Fig. 1.
Five stars (HIP 67344, HIP 74858, HIP 75132, HIP 81284, and HIP 90864) have been analysed with MyGIsFOS. The other two stars (HIP 80124 and UMi) have a high rotational velocity () and MyGIsFOS is not optimised for the analysis of these type of objects. For these two stars, we selected the features to take into consideration in the analysis upon visual inspection.
MyGIsFOS does not derive , this is an input parameters. We broaden the synthetic profiles taking into account the instrumental broadening and the stellar rotation. This approach is valid only with slow rotating stars, from our experience below about 10 . We optimised the analysis of MyGIsFOS by changing the total broadening for each star, and, known the instrumental broadening, the we derive is in agreement, within about one with the values presented in Table 1. For the two stars we did not analysed with MyGIsFOS (HIP 80124 and UMi), by line profile fitting and assuming a resolving power of 40 000, we derived a of 26 and 85 , which are not in agreement with the values provided in Table 1.
All the analysis was done with spectral synthesis computed with SYNTHE (Kurucz 1993b, 2005) in its Linux version (Sbordone et al. 2004; Sbordone 2005) based on ATLAS 9 and ATLAS 12 (Kurucz 1993a, 2005) models.
The stellar parameters derived are listed in Table 2 whereas the detailed chemical abundances are presented in tables on a star-by-star basis and are discussed in their own sections. The upper limits in the Li abundance evidence a non-detection of lithium. It has been derived by applying the Cayrel’s formula (Cayrel 1988) with the measured S/N and assuming a 3 detection limit.
For testing purposes, we analysed the spectrum of Ceres observed with SOPHIE during the same observing run and the stellar parameters we derived are shown in Table 2. The reference solar abundances we adopted from Caffau et al. (2011) for Li, S, and Fe, and from Lodders et al. (2009) for the other elements.
| Star | [Fe/H] | [/Fe] | Ca ii -H,K | (Li) | |||
|---|---|---|---|---|---|---|---|
| Ceres | 5700 | 4.36 | 1.19 | –0.08 | 0.02 | ||
| HIP 67344 (HD 120205) | 5310 | 4.55 | 1.22 | 0.04 | 0.05 | emission | |
| HIP 74858 (HD 136137) | 5201 | 3.15 | 1.31 | 0.00 | 0.05 | emission | |
| HIP 75132 (HD 136655) | 5161 | 4.58 | 0.94 | 0.17 | 0.07 | emission | |
| HIP 81284 (HD 150202) | 5198 | 3.26 | 1.14 | 0.04 | 0.09 | emission | |
| HIP 90864 (HD 171067) | 5496 | 4.22 | 0.97 | –0.16 | 0.10 | ||
| HIP 80124 (HD 147443) | 6260 | 4.20 | 1.5 | +0.06 | 0.11 | emission | |
| HIP 79822 ( UMi) | 6946 | 4.05 | 2.0 | –0.10 | -0.04 |
3.1 HIP 67344 (HD 120205)
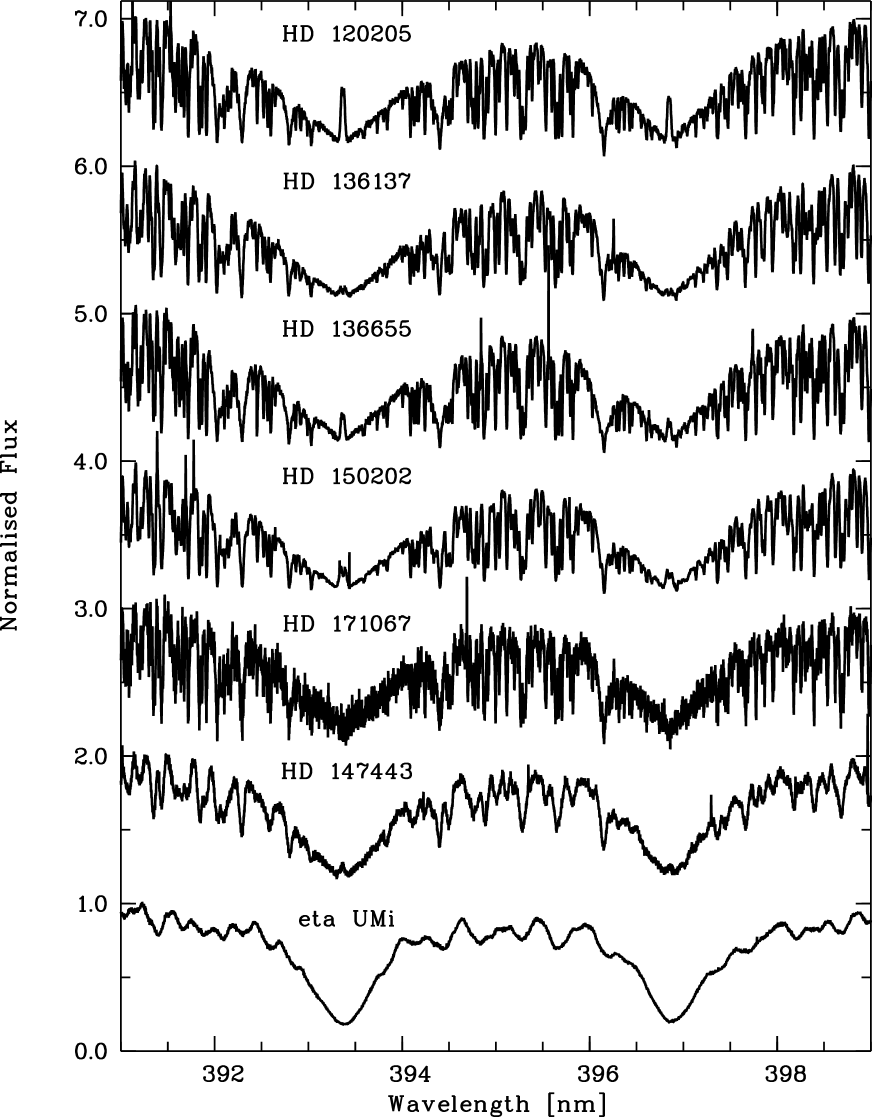
This young, single G type star was analysed using MyGIsFOS. From the SOPHIE spectrum, the following stellar parameters were determined: (//[Fe/H]) 5310 K/4.55/+0.04 and a micro-turbulence parameter of =1.22 . The abundances are reported in Table 3. The star appears to be a dwarf star with solar-metallicity. The Ca ii-H and -K lines show clear core emission (see Fig. 2).
The stellar parameters for this star available in the literature are in good agreement with our results. Casagrande et al. (2011), who derive =5286 K, give the most recent revision of the parameters present in the Geneva-Copenhagen Catalogue. The main improvement in this edition is the use of the IR flux method to derive and this corresponds also to a new metallicity scale. The effective temperature from Masana et al. (2006) is K. From Mortier et al. (2013) we have =5303 K, [Fe/H]=0.08, with a stellar mass of , and no detected planet. From Strassmeier et al. (2012) the stellar parameters are 5260 K/4.36/+0.03, with a (Li)=1.13. We could not derive the Li abundance from the SOPHIE spectrum, because no Li line is detectable. On the other hand, slightly blue-shifted in wavelength with respect to the Li doublet position, we detect a line (at 670.7473 nm) that is compatible with a Sm ii line, that would provide .
| Element | Na | (X) | [X/H] | [X/Fe] | |||
|---|---|---|---|---|---|---|---|
| Na i | 2 | 6.30 | 6.41 | 0.11 | 0.01 | 0.07 | 0.1080 |
| Al i | 3 | 6.47 | 6.55 | 0.08 | 0.05 | 0.04 | 0.1203 |
| Si i | 6 | 7.52 | 7.62 | 0.10 | 0.04 | 0.06 | 0.1155 |
| Si ii | 1 | 7.52 | 7.53 | 0.01 | –0.03 | ||
| S i | 1 | 7.16 | 7.23 | 0.07 | 0.03 | ||
| Ca i | 2 | 6.33 | 6.43 | 0.10 | 0.05 | 0.05 | 0.1174 |
| Sc ii | 6 | 3.10 | 3.21 | 0.11 | 0.13 | 0.06 | 0.1769 |
| Ti i | 22 | 4.90 | 4.98 | 0.08 | 0.07 | 0.04 | 0.1261 |
| Ti ii | 4 | 4.90 | 5.04 | 0.14 | 0.09 | 0.10 | 0.1523 |
| V i | 10 | 4.00 | 4.07 | 0.07 | 0.11 | 0.02 | 0.1561 |
| Cr i | 6 | 5.64 | 5.68 | 0.04 | 0.06 | 0.00 | 0.1218 |
| Mn i | 3 | 5.37 | 5.43 | 0.06 | 0.24 | 0.01 | 0.2605 |
| Fe i | 72 | 7.52 | 7.56 | 0.04 | 0.11 | 0.00 | 0.1522 |
| Fe ii | 14 | 7.52 | 7.56 | 0.04 | 0.12 | 0.00 | 0.1695 |
| Co i | 5 | 4.92 | 4.98 | 0.06 | 0.03 | 0.01 | 0.1113 |
| Ni i | 14 | 6.23 | 6.21 | –0.02 | 0.17 | –0.06 | 0.2045 |
| Cu i | 1 | 4.21 | 4.24 | 0.03 | –0.01 | ||
| Y ii | 3 | 2.21 | 2.22 | 0.01 | 0.21 | –0.03 | 0.2384 |
| a N: number of lines analysed of each element. | |||||||
3.2 HIP 74858 (HD 136137)
We could not find any chemical analysis for this young evolved star in the literature. The Ca ii-H and -K lines show a core emission (see Fig. 2). According to our analysis based on MyGIsFOS, the star is a sub-giant with solar metallicity. We derived the stellar parameters 5201 K/3.15/0.0. The chemical composition we derived is reported in Table 4.
| Element | N | (X) | [X/H] | [X/Fe] | |||
|---|---|---|---|---|---|---|---|
| Na i | 2 | 6.30 | 6.49 | 0.19 | 0.01 | 0.19 | 0.1023 |
| Al i | 3 | 6.47 | 6.50 | 0.03 | 0.02 | 0.03 | 0.1039 |
| Si i | 7 | 7.52 | 7.53 | 0.01 | 0.04 | 0.02 | 0.1103 |
| Si ii | 2 | 7.52 | 7.67 | 0.15 | 0.11 | 0.15 | 0.1646 |
| S i | 1 | 7.16 | 7.05 | –0.11 | –0.11 | ||
| Ca i | 3 | 6.33 | 6.37 | 0.04 | 0.03 | 0.05 | 0.1054 |
| Sc ii | 4 | 3.10 | 3.26 | 0.16 | 0.11 | 0.16 | 0.1661 |
| Ti i | 22 | 4.90 | 4.96 | 0.06 | 0.10 | 0.06 | 0.1434 |
| Ti ii | 5 | 4.90 | 4.90 | 0.00 | 0.20 | 0.00 | 0.2372 |
| V i | 9 | 4.00 | 4.01 | 0.01 | 0.12 | 0.02 | 0.1572 |
| Cr i | 6 | 5.64 | 5.62 | –0.02 | 0.04 | –0.02 | 0.1091 |
| Mn i | 3 | 5.37 | 5.34 | –0.03 | 0.27 | –0.03 | 0.2871 |
| Fe i | 77 | 7.52 | 7.52 | 0.00 | 0.10 | 0.00 | 0.1445 |
| Fe ii | 16 | 7.52 | 7.52 | 0.00 | 0.12 | 0.00 | 0.1729 |
| Co i | 4 | 4.92 | 4.91 | –0.01 | 0.08 | –0.01 | 0.1276 |
| Ni i | 14 | 6.23 | 6.19 | –0.04 | 0.13 | –0.04 | 0.1691 |
| Cu i | 1 | 4.21 | 4.13 | –0.08 | –0.08 | ||
| Y ii | 3 | 2.21 | 2.35 | 0.14 | 0.23 | 0.14 | 0.2633 |
3.3 HIP 75132 (HD 136655)
This star is in a double system (separation 69 arcsec) with the companion (K 2) almost two magnitudes fainter (V= 9.02 and 10.99, respectively), with a high probability to be a physical double system (Shaya & Olling 2011).
The stellar parameters we derive for this star (5161 K/4.58/+0.17) are slightly different with respect to those in Strassmeier et al. (2012) (5010 K/4.27/+0.09). In particular we derived an effective temperature larger by 151 K, a gravity 0.31 dex higher, and a metallicity 0.08 dex higher. If we fix the temperature at 5010 K from Strassmeier et al. (2012), we obtain a perfect agreement with Strassmeier et al. (2012). Our chemical analysis, reported in Table 5, shows that this star has an over-solar metallicity, with a low Mn abundance, that can probably be explained with effect due to deviation from local thermodynamical equilibrium (LTE).
The radial velocity of this star is considered to be constant by Griffin et al. (2010) from 9 CORAVEL measurements between March and September 2009. The constancy of the radial velocity is confirmed by Strassmeier et al. (2012) who find from 112 STELLA measurements that span 842 days. Our SOPHIE radial velocity is slightly higher than both these series of measurements, (0.4 larger than the STELLA measurement and 1.3 than the CORAVEL measurement). STELLA radial velocities are offset to the CORAVEL RVs by (Strassmeier et al. 2012). We do not believe this points towards any radial velocity variability of this star, but rather to zero point offsets between the three instruments. See for example Pasquini et al. (2012) for combining SOPHIE radial velocities with those of other spectrographs.
| Element | N | (X) | [X/H] | [X/Fe] | |||
|---|---|---|---|---|---|---|---|
| Al i | 2 | 6.47 | 6.71 | 0.24 | 0.12 | 0.07 | 0.1701 |
| Si i | 6 | 7.52 | 7.86 | 0.34 | 0.15 | 0.17 | 0.1880 |
| Ca i | 2 | 6.33 | 6.57 | 0.24 | 0.02 | 0.07 | 0.1187 |
| Sc ii | 7 | 3.10 | 3.43 | 0.33 | 0.15 | 0.15 | 0.2274 |
| Ti i | 18 | 4.90 | 5.16 | 0.26 | 0.08 | 0.09 | 0.1438 |
| Ti ii | 4 | 4.90 | 5.17 | 0.27 | 0.17 | 0.09 | 0.2357 |
| V i | 6 | 4.00 | 4.28 | 0.28 | 0.22 | 0.11 | 0.2483 |
| Cr i | 5 | 5.64 | 5.87 | 0.23 | 0.06 | 0.06 | 0.1328 |
| Mn i | 1 | 5.37 | 5.39 | 0.02 | –0.15 | ||
| Fe i | 65 | 7.52 | 7.69 | 0.17 | 0.12 | 0.00 | 0.1663 |
| Fe ii | 15 | 7.52 | 7.70 | 0.18 | 0.17 | 0.00 | 0.2370 |
| Co i | 3 | 4.92 | 5.28 | 0.36 | 0.11 | 0.19 | 0.1579 |
| Ni i | 13 | 6.23 | 6.49 | 0.26 | 0.18 | 0.09 | 0.2173 |
| Cu i | 1 | 4.21 | 4.57 | 0.36 | 0.19 | ||
| Y ii | 3 | 2.21 | 2.25 | 0.04 | 0.21 | –0.13 | 0.2687 |
| Ba ii | 1 | 2.17 | 2.30 | 0.13 | –0.05 |
3.4 HIP 81284 (HD 150202)
This star is known in the literature to be an SB1 system (Strassmeier et al. 2000) and as such it was studied by Griffin et al. (2009). The late spectral type K0 quoted by Griffin et al. (2009) is taken from the Chromospheric Active Binaries catalogue by Eker et al. (2008) who gave a of 4950 K and a of 8.1 , values taken from Strassmeier et al. (2000). However, it is not mentioned that these authors measured two spectra from which they derived two different values of , 5.6 and 8.1 .
From our SOPHIE spectrum we derive an intermediate value . The spectral type according to Strassmeier et al. (2012) should in fact be G8III. This star is a photometric variable, with a light curve in Hipparcos magnitude from to giving 8.099 and 8.140 V magnitude, respectively. The photometric variability, discovered by Hipparcos, satisfies the criteria of GCVS (General Catalogue of Variable Stars, Samus et al. 2008, 2010) and as such this star has the designation of GI Dra (Kazarovets et al. 1999). The assigned variability type is “SRD:” i.e. uncertain Semi-Regular variable of type D. Semi-regular variable are giants and super-giants stars of spectral type F, G, or K, sometimes with emission lines in their spectra. The amplitudes of light variation are in the range between 0.1 and 4 mag, and the range of periods is between 29 and 1100 days (SX Her, SV UMa).
Strassmeier et al. (2012) show this star to be active, and we confirm it by seeing a clear emission in the core of the Ca ii-H and -K lines (see Fig. 2). Our radial velocity of about puts the star close to the minimum of the variation which ranges from to (Griffin et al. 2009).
A determination of effective temperature, gravity and metallicity for this star, based on selected spectral orders in the range 549-623 nm, has previously been done by Strassmeier et al. (2012) who determined a of 5010 K, =3.06, and . We derive a of 5198 K, 188 K higher than Strassmeier et al. (2012), = 3.26, and (Table 2). McDonald et al. (2012) used the spectral energy distribution from 420 nm to 25000 nm to derive , luminosity, and IR excess of a large sample of Hipparcos stars. They obtained a of 5100 K, and an average IR excess of 1.330 with a peak at 12 nm for HIP 81284.
By fixing the temperature at 5010 K, as in Strassmeier et al. (2012), we have a reasonable agreement of the stellar parameters from our analysis, 5010 K/2.72/0.0, versus 5010 K/3.06/–0.12 from (Strassmeier et al. 2012).
Lithium can be detected from the 670.8 nm resonance line and we performed a full 3D NLTE spectral analysis of the lithium doublet with the NLTE3D+Linfor3D codes, based on 3D hydro-dynamical stellar atmospheres taken from the CIFIST 3D model atmosphere grid (Ludwig et al. 2009). These models are the outcome of realistic numerical simulations performed with the CO5BOLD code (Freytag et al. 2012). From our high-resolution SOPHIE spectrum (R40 000, SNR80) it is clear that the Li doublet at 670.8 nm is blended with lines of other elements. For this reason the spectral synthesis was carried out by using the list of blending lines taken from Meléndez et al. (2012) in the range 670.70 nm and 670.86 nm, as presented in Table 6. To compute the lithium line profile to an adequate accuracy, we considered its full isotopic and hyper-fine structure computed by Kurucz222http://kurucz.harvard.edu/atoms/0300/lidlines.dat, represented by twelve components, six of which belong to 6Li and six to 7Li, as shown in Table 7.
| [nm] | Element/Molecule | [eV] | |
|---|---|---|---|
| 670.7000 | Si i | 5.954 | -2.560 |
| 670.7172 | Fe i | 5.538 | -2.810 |
| 670.7205 | CN | 1.970 | -1.222 |
| 670.7272 | CN | 2.177 | -1.416 |
| 670.7282 | CN | 2.055 | -1.349 |
| 670.7300 | C2 | 0.933 | -1.717 |
| 670.7371 | CN | 3.050 | -0.522 |
| 670.7433 | Fe i | 4.608 | -2.250 |
| 670.7460 | CN | 0.788 | -3.094 |
| 670.7461 | CN | 0.542 | -3.730 |
| 670.7470 | CN | 1.880 | -1.581 |
| 670.7473 | Sm ii | 0.933 | -1.910 |
| 670.7548 | CN | 0.946 | -1.588 |
| 670.7595 | CN | 1.890 | -1.451 |
| 670.7596 | Cr i | 4.208 | -2.667 |
| 670.7645 | CN | 0.946 | -3.330 |
| 670.7660 | C2 | 0.926 | -1.743 |
| 670.7809 | CN | 1.221 | -1.935 |
| 670.7848 | CN | 3.600 | -2.417 |
| 670.7899 | CN | 3.360 | -3.110 |
| 670.7930 | CN | 1.980 | -1.651 |
| 670.7970 | C2 | 0.920 | -1.771 |
| 670.7980 | CN | 2.372 | -3.527 |
| 670.8023 | Si i | 6.000 | -2.800 |
| 670.8026 | CN | 1.980 | -2.031 |
| 670.8094 | V i | 1.218 | -2.922 |
| 670.8099 | Ce ii | 0.701 | -2.120 |
| 670.8147 | CN | 1.870 | -1.884 |
| 670.8282 | Fe i | 4.988 | -2.700 |
| 670.8315 | CN | 2.640 | -1.719 |
| 670.8347 | Fe i | 5.486 | -2.580 |
| 670.8370 | CN | 2.640 | -2.540 |
| 670.8420 | CN | 0.768 | -3.358 |
| 670.8534 | Fe i | 5.558 | -2.936 |
| 670.8541 | CN | 2.500 | -1.876 |
| 670.8577 | Fe i | 5.446 | -2.684 |
| (Å) | Li isotope | [eV] | |
|---|---|---|---|
| 670.7756 | 7Li | 0.000 | -0.428 |
| 670.7768 | 7Li | 0.000 | -0.206 |
| 670.7907 | 7Li | 0.000 | -0.808 |
| 670.7908 | 7Li | 0.000 | -1.507 |
| 670.7919 | 7Li | 0.000 | -0.808 |
| 670.7920 | 7Li | 0.000 | -0.808 |
| 670.7920 | 6Li | 0.000 | -0.479 |
| 670.7923 | 6Li | 0.000 | -0.178 |
| 670.8069 | 6Li | 0.000 | -0.831 |
| 670.8070 | 6Li | 0.000 | -1.734 |
| 670.8074 | 6Li | 0.000 | -0.734 |
| 670.8075 | 6Li | 0.000 | -0.831 |
The lithium abundance was derived through fitting a grid of synthetic spectra to the SOPHIE data. Three parameters were varied independently to find the best fit ( minimisation): the total Li abundance , which controls the line strength, a global wavelength shift , and a residual line broadening described by a Gaussian kernel with FWHM (in velocity space). During the fitting procedure we kept the continuum fixed, and since the lithium isotopic ratio was not the goal of our analysis for this star, we constrained its value to the solar value of % (Lemoine, Ferlet, & Vidal-Madjar 1995), which is well matched by the meteoritic value of 8.33% (Anders & Grevesse 1989).
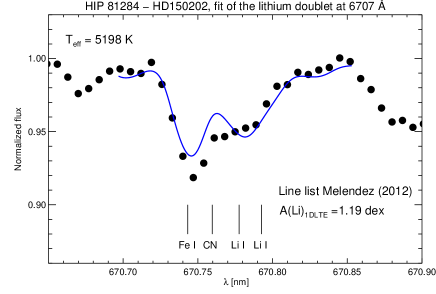
We started by using synthetic spectra computed in LTE from a standard 1D ATLAS9 model atmosphere (Kurucz 1993a, 2005) with parameters =5198 K, =3.26, and [Fe/H]=0.0, and we find . Subsequently, the abundance resulting from the fit (shown in Fig. 3, upper panel) is corrected for 3D hydro-dynamical+NLTE effects.
Following the procedure outlined in Appendix A, we derive a 3D+NLTE correction of dex at =5198 K, resulting in . This result is in very good agreement with dex from Strassmeier et al. (2012) – a value obtained from equivalent-width measurements and NLTE corrected using the computations of Pavlenko & Magazzú (1996), even though these authors adopted a lower effective temperature (see below). The error associated with was calculated by examining both systematic and statistical uncertainties. The systematic error arises from the uncertainty of the stellar parameters, and it was tested by means of ATLAS9 models under the assumption of LTE. Since the lithium line is mainly sensitive to the effective temperature of the star, the error due to changes in gravity and metallicity are not considered. We employed 1D ATLAS9 model atmospheres with =3.26, [Fe/H]=0.0, and K. A change in temperature of K is translated into a change in of dex. The statistical error comprises the global uncertainty resulting from the fit between observed data and our synthetic spectra. The final error on of dex is the sum in quadrature of the two contributions, where the change in due to changes in is clearly predominant.
We also performed a 3D+NLTE spectrum analysis considering the lower 5010 K of Strassmeier et al. (2012), following the same procedure. We find = dex which was corrected for the 3D hydro-dynamical effects to get the final value of dex, almost a factor two lower than for 5198 K. Assuming a closer to the one from Strassmeier et al. (2012) (Fig. 3, lower panel) allows to achieve a better fit of the observed Fe i and CN lines that mostly contribute to the blending of the lithium resonance doublet. The higher effective temperature =5198 K derived from our high-resolution SOPHIE spectrum seems too high to fit properly the main features responsible for the blending (Fig. 3, upper panel).
The results of the analysis of the other elements present in the spectrum are shown in Table 8.
| Element | N | (X) | [X/H] | [X/Fe] | |||
|---|---|---|---|---|---|---|---|
| Li i | 2 | 1.03 | 1.37 | ||||
| Na i | 2 | 6.30 | 6.52 | 0.22 | 0.02 | 0.18 | 0.1065 |
| Al i | 3 | 6.47 | 6.54 | 0.07 | 0.02 | 0.03 | 0.1078 |
| Si i | 7 | 7.52 | 7.56 | 0.04 | 0.07 | –0.01 | 0.1237 |
| Si ii | 1 | 7.52 | 7.71 | 0.19 | 0.14 | ||
| S i | 1 | 7.16 | 7.08 | –0.08 | –0.12 | ||
| Ca i | 3 | 6.33 | 6.46 | 0.13 | 0.02 | 0.09 | 0.1071 |
| Sc ii | 5 | 3.10 | 3.26 | 0.16 | 0.10 | 0.11 | 0.1701 |
| Ti i | 21 | 4.90 | 5.05 | 0.15 | 0.12 | 0.11 | 0.1588 |
| Ti ii | 6 | 4.90 | 4.92 | 0.02 | 0.23 | –0.03 | 0.2678 |
| V i | 8 | 4.00 | 4.11 | 0.11 | 0.13 | 0.07 | 0.1654 |
| Cr i | 6 | 5.64 | 5.72 | 0.08 | 0.07 | 0.04 | 0.1238 |
| Fe i | 78 | 7.52 | 7.56 | 0.04 | 0.11 | 0.00 | 0.1488 |
| Fe ii | 16 | 7.52 | 7.57 | 0.05 | 0.14 | 0.00 | 0.1940 |
| Co i | 3 | 4.92 | 4.96 | 0.04 | 0.12 | –0.01 | 0.1577 |
| Ni i | 14 | 6.23 | 6.26 | 0.03 | 0.14 | –0.01 | 0.1714 |
| Cu i | 1 | 4.21 | 4.26 | 0.05 | 0.00 | ||
| Y ii | 4 | 2.21 | 2.30 | 0.09 | 0.19 | 0.04 | 0.2367 |
3.5 HIP 90864 (HD 171067)
This star has already been analysed by several authors. Seven values are reported in the Pastel catalogue (Soubiran et al. 2010) and they are in very good agreement () among themselves and in even better agreement () if we remove the coolest value of 5500 K from Pompéia et al. (2011). This latter value is in good agreement with the we derive (5496 K) and the value of 5520 K from Strassmeier et al. (2012). Our relatively low [Fe/H]=–0.16, is lower than the three values in the Pastel catalogue () but again in agreement with [Fe/H]=–0.15 from Strassmeier et al. (2012). Our chemical analysis is presented in Table 9. Valenti & Fischer (2005) analysed a Keck spectrum and derived the stellar parameters ( =5643 K, =4.50, [M/H]=–0.03, =1.2 ) and the abundances of , , , , and . Our values are lower, but this is not surprising since out effective temperature is about 150 K lower than their adopted value.
| Element | N | (X) | [X/H] | [X/Fe] | |||
|---|---|---|---|---|---|---|---|
| Na i | 2 | 6.30 | 6.14 | –0.16 | 0.02 | 0.01 | 0.1091 |
| Al i | 3 | 6.47 | 6.29 | –0.18 | 0.06 | –0.01 | 0.1243 |
| Si i | 4 | 7.52 | 7.41 | –0.11 | 0.08 | 0.06 | 0.1323 |
| Si ii | 2 | 7.52 | 7.61 | 0.09 | 0.18 | 0.25 | 0.2125 |
| S i | 1 | 7.16 | 7.03 | –0.13 | 0.04 | ||
| Ca i | 6 | 6.33 | 6.26 | –0.07 | 0.06 | 0.10 | 0.1243 |
| Sc ii | 6 | 3.10 | 2.97 | –0.13 | 0.10 | 0.03 | 0.1462 |
| Ti i | 25 | 4.90 | 4.70 | –0.20 | 0.05 | –0.03 | 0.1170 |
| Ti ii | 7 | 4.90 | 4.71 | –0.19 | 0.23 | –0.03 | 0.2542 |
| V i | 8 | 4.00 | 3.68 | –0.32 | 0.09 | –0.16 | 0.1431 |
| Cr i | 5 | 5.64 | 5.45 | –0.19 | 0.03 | –0.02 | 0.1131 |
| Mn i | 8 | 5.37 | 5.27 | –0.10 | 0.24 | 0.07 | 0.2668 |
| Fe i | 107 | 7.52 | 7.36 | –0.16 | 0.11 | 0.00 | 0.1524 |
| Fe ii | 14 | 7.52 | 7.36 | –0.16 | 0.11 | 0.00 | 0.1508 |
| Co i | 6 | 4.92 | 4.69 | –0.23 | 0.09 | –0.06 | 0.1391 |
| Ni i | 16 | 6.23 | 6.05 | –0.18 | 0.20 | –0.01 | 0.2254 |
| Cu i | 2 | 4.21 | 3.95 | –0.26 | 0.07 | –0.10 | 0.1310 |
| Y ii | 4 | 2.21 | 2.01 | –0.20 | 0.16 | –0.04 | 0.1894 |
| Ba ii | 1 | 2.17 | 2.30 | 0.13 | 0.29 |
3.6 HIP 80124 (HD 147443)
HIP 80124 is one of the six potential solar siblings selected by Brown et al. (2010). A solar sibling is a star that has the same age and chemical composition of the Sun, because it formed at the same time and from the same cluster. It is not necessarily a solar analog. That requires the star to have the same , , mass, and luminosity as the Sun.
Brown et al. (2010) provides a radial velocity of for this star. Batista et al. (2014) conducted an abundance analysis of a large sample of solar siblings, but they excluded HIP 80124 because its was too high: roughly 26 as we derived from the SOPHIE spectrum. The radial velocity of the two spectra taken on 2nd and 3rd March 2014 are substantially different; and , respectively. The star is metal-rich and shows signs of activity (see Fig. 2). We derived an effective temperature of 6260 K from the wings of H, which is in good agreement with the effective temperature of 6194 K from Casagrande et al. (2011). We can associate an uncertainty of 100 K to . The logarithmic surface gravity of 4.2 ([cgs] units) was derived from the Hipparcos parallax, assuming 1.2 . An uncertainty of 0.2 dex was used for as a consequence of poor stellar mass and parallax determinations. Casagrande et al. (2011) report 4.21 in surface gravity. It was not possible to perform an automatic chemical analysis with MyGIsFOS for HIP 80124, as was done for the other stars, because the high rotation of the star is responsible for the excessive blending of spectral lines. We selected reasonably unblended lines and measured the equivalent widths, and for blended lines we performed a line profile fitting to derive the abundances. The results are presented in Table 10.
| Element | N | (X) | [X/H] | [X/Fe] | ||
|---|---|---|---|---|---|---|
| Li i | 1 | 1.03 | 2.92 | 0.10 | ||
| Na i | 1 | 6.30 | 6.45 | +0.15 | 0.10 | +0.09 |
| Si i | 4 | 7.52 | 7.52 | +0.00 | 0.15 | –0.06 |
| Si ii | 2 | 7.52 | 7.62 | +0.10 | 0.04 | +0.04 |
| S i | 1 | 7.16 | 7.04 | –0.08 | 0.15 | –0.14 |
| Ca i | 4 | 6.33 | 6.50 | +0.17 | 0.18 | +0.11 |
| Ti i | 1 | 4.90 | 4.91 | +0.01 | 0.20 | –0.05 |
| Fe i | 44 | 7.52 | 7.58 | +0.06 | 0.10 | 0.00 |
| Fe ii | 3 | 7.52 | 7.71 | +0.19 | 0.25 | 0.00 |
| Ni i | 5 | 6.23 | 6.32 | +0.09 | 0.06 | +0.03 |
| Ba ii | 1 | 2.17 | 2.20 | +0.03 | 0.15 | –0.03 |
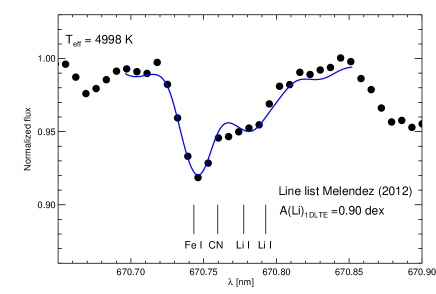
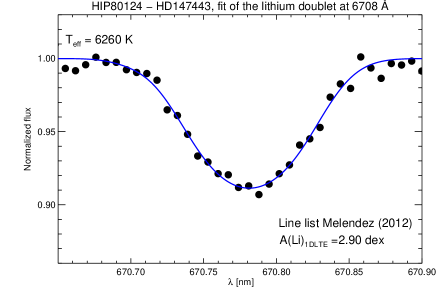
A strong Li i doublet at 670.8 nm is visible in the observed spectrum, with an equivalent width of 8.7 pm (87 mÅ). As for HIP 81284 (HD 150202), we derived by fitting the observed data with a grid of synthetic spectra computed with a 1D ATLAS9 model atmosphere, and subsequently considered 3D effects and departures from LTE conditions through the application of “3D+NLTE” abundance corrections (see Appendix A for the procedure).
We performed our spectral analysis including the list of atomic and molecular data of Meléndez et al. (2012) (see Table 6) and derive the final value of ; the outcome of the fitting procedure is shown in Fig. 4. We computed the uncertainties as done for HIP 81284 (HD 150202): a change in of K resulted in a change in by dex.
Since a 3D model is available at the right stellar parameters for this object, we can also fit the observed spectrum directly with the grid of 3D synthetic spectra. The result is basically identical to the above abundance, , demonstrating the internal consistency of our 3D correction procedure.
To understand if this star is a solar sibling, we compared its chemical composition reported in Table 10 with the reference solar abundances (Caffau et al. 2011; Lodders et al. 2009). We did not find a good agreement. We found that HIP 80124 (HD 147443) has a higher Li abundance () compared to the Sun (=1.030.03, Caffau et al. 2011). This by itself is not surprising since the star is much warmer than the Sun, thus convection should not be as effective in depleting lithium in its atmosphere. However, if we consider the lithium abundances in the open cluster M 67 (Pasquini et al. 2008), that has the same age and chemical composition as the Sun, we see that stars of roughly the same temperature as HIP 80124 (HD 147443) have (see Figure 6 of Pasquini et al. 2008). This suggests that this star is younger than the Sun (and M 67). The logarithmic lithium abundance for 12 G-dwarf stars in the 800-Myr Open Cluster IC4756 is 2.390.17 (Strassmeier et al. 2015). This suggests that HIP 80124 (HD 147443) may even be younger than that. The two measured RVs suggest that the star could be a close binary, since we do not detect the spectrum of a companion star, it is likely that it is much less luminous. Further observations of this star are encouraged to study its radial velocity variations. On the assumption that M 67 and the Sun formed with the same lithium abundance, equal to the meteoritic abundance (, Lodders et al. 2009), the lower Li abundance observed in M 67 suggests that some phenomenon (for example diffusion) has decreased the Li abundance even in the hottest stars. Since this phenomenon should be time-dependent we expect that a younger star, that started with the same Li abundance, should have a higher Li abundance. In addition a younger star would be born at a time when the interstellar medium has been further enriched in Li, thus its initial lithium abundance might have been even higher than the meteoritic value. Both effects imply that a younger star should have a higher lithium abundance. The high lithium abundance for such a rapidly rotating star is not uncommon among active stars. For an inclination angle between 30∘ and 90∘ the implies periods in the range d d. By looking at Figure 16 of Strassmeier et al. (2012), we see that there are a few such systems, even with higher rotational velocity. Again, the high rotational velocity favours a young age, and excludes the star from being a solar sibling.
To be more consistent, we compared the chemical composition of this star with the solar chemical composition derived from the SOPHIE spectrum of Ceres. The abundances derived from the spectrum of the asteroid are different from the abundances of this star (e.g. there is a difference of 0.19 dex in Na, 0.24 dex in Ca, 0.13 dex in Fe from neutral lines). These differences in the chemical composition alone would allow us to exclude this star as a solar sibling. The derived age (see Sect. 5) confirms this conclusion.
3.7 HIP 79822 ( UMi)
For this bright star which is part of a double system, no chemical analysis can be found in the literature. The secondary component is apparently an M 4 dwarf (Lépine & Bongiorno 2007, V=15.3), for which the determination of the chemical composition from its spectrum is extremely difficult. One could constrain the chemical composition of a few elements from the F-star companion, since these are available.
We would like to point out that our measured radial velocity is significantly different from most of the radial velocities reported in the literature for this star, that range from +35.7 to –20.9 (Hnatek 1920) through -11.8 (Plaskett et al. 1921), with a more recent measurement of -11.1 provided by CORAVEL (Nordström et al. 2004). Our radial velocity is compatible with the lowest value found in the literature and based on an observation taken on June 11 1915 with the Coudé spectrograph of the University Observatory of Vienna (Hnatek 1920). Since the star is a binary, it is not surprising that the radial velocity may be varying. We encourage further monitoring of the radial velocity of this star.
Casagrande et al. (2011) state that the star has an effective temperature of 6820 K, but our fit of the H wings suggest a hotter temperature, =6946 K. The two agree within the uncertainty of 100 K that we associate to the determination of the temperature from the H wings. We derived the surface gravity from the Hipparcos parallax (33.63 mas, van Leeuwen 2007), assuming 1.5 , with an uncertainty of 0.2 dex. For the two effective temperature values, 6820 K and 6946 K, we derived of 4.02 and 4.05, respectively. We fixed the micro-turbulence at 2 .
The star has a high of 85 , in good agreement with other values found in the literature (Nordström et al. 2004; Reiners 2006; Schröder et al. 2009). This high does not allow us to analyse this spectrum using the same techniques we used for the spectra of the other stars in this project. It is very difficult to find a single unblended lines in the spectrum. To derive the abundances we selected blends in which one element is the major contributor, or features where several lines of the same element contribute to the blend. The results, in the case the effective temperature is set at 6946 K, are reported in Table 11.
When taking =6820 K and =4.02 instead, we have very minor increases in the abundance. The most affected element is Ba whose abundance becomes 0.1 dex higher. The Mg abundance increases by 0.08 dex; Fe, Cr, Ni abundances result 0.06 dex higher; and the Ti abundance is 0.05 dex higher. The other elements are less affected.
| Element | N | (X) | [X/H] | [X/Fe] | ||
|---|---|---|---|---|---|---|
| Mg i | 3 | 7.54 | 7.44 | –0.10 | 0.13 | +0.00 |
| Si i | 3 | 7.52 | 7.26 | –0.26 | 0.22 | +0.16 |
| Si ii | 1 | 7.52 | 7.63 | +0.11 | +0.21 | |
| S i | 4 | 7.16 | 7.16 | +0.00 | +0.10 | |
| Ca i | 7 | 6.33 | 6.40 | +0.07 | 0.12 | +0.17 |
| Ti i | 2 | 4.90 | 4.81 | –0.09 | 0.22 | +0.01 |
| Ti ii | 1 | 4.90 | 4.79 | –0.11 | –0.01 | |
| Cr i | 1 | 5.64 | 5.45 | –0.19 | –0.09 | |
| Fe i | 53 | 7.52 | 7.42 | –0.10 | 0.14 | 0.00 |
| Fe ii | 4 | 7.52 | 7.49 | –0.03 | 0.25 | 0.00 |
| Ni i | 3 | 6.23 | 6.22 | –0.01 | 0.01 | +0.09 |
| Ba ii | 2 | 2.17 | 2.26 | +0.09 | 0.39 | 0.16 |
4 Uncertainties
For five of the stars we analysed in this project (HD 120205, HD 136137, HD 136655, HD 150202, HD 171067), we derived the stellar parameters and the abundances with MyGIsFOS. is obtained by imposing no slope in [Fe/H] vs. lower energy of the Fe transitions. is derived from agreement of [Fe/H] from Fe i and Fe ii lines. For the slope in excitation energy we can conservatively expect an uncertainty of 50 K in . The number of Fe i lines is large (65-107) and they give a line-to-line abundance scatter of about 0.1 dex. Fe ii lines are less numerous (between 14 and 16) and they provide a line-to-line scatter a bit larger than 0.1 dex (0.11-0.17 dex). We can associate the uncertainty in with a disagreement in [Fe/H] from Fe i and Fe ii lines of 0.1 dex that, for the range in stellar parameters of these five stars, can be translated into an uncertainty in of 0.2 dex. A disagreement of 0.2 dex from Fe i and Fe ii lines would give a change in of 0.3 dex.
We analysed a spectrum of Ceres to have better constraints on the uncertainties we can have on the stellar parameters of the five stars analysed by means of MyGIsFOS. Comparing the results of Ceres in Table 2 to the stellar parameters of the Sun we can assign a systematic uncertainty of 80 K for , 0.1 dex for , 0.2 for the micro-turbulence and 0.1 dex for the metallicity.
Conservatively, we can take the following values as uncertainties in the stellar parameters for these five stars: 100 K in , 0.2 dex in , 0.2 in micro-turbulence, and 0.1 dex for the metallicity.
5 Stellar activity
The emission cores of the Ca ii H&K resonance lines are routinely used as a diagnostic of the chromospheric activity. Our spectra are even of sufficient resolution to define the emission line profiles itself by, e.g., detecting the central emission-line reversal if present. The two minima outside of the emission line, the so-called violet (V) and red (R) footpoints, were measured in this paper for both Ca ii H and K lines. We follow the notions and absolute-flux calibration laid out in a previous paper by Strassmeier et al. (2000). It relates high-resolution spectra to the absolute photometric flux in a 5-nm band at 395 nm calibrated solely upon the or color of the star.
We first measure the relative flux of each emission line between the V and R points with the help of the splot routine in iraf as well as the 5-nm flux centered at 395 nm. These fluxes are then converted to absolute fluxes by applying the above photometric calibration. It is important to remove the photospheric contribution from these fluxes if the pure chromospheric emission is sought. Such radiative losses were identified to be the net cooling rate in the chromosphere due to these lines (Linsky & Ayres 1978). The expected radiative losses as a function of stellar were taken from that paper and subtracted from the measured values. The values used in the calibration were obtained from the values and are later listed in Table 13. Finally, the sum of the corrected absolute emission-line fluxes from H and K is expressed in units of the bolometric luminosity and yields a value for the total chromospheric radiative loss .
Table 12 summarizes the numerical values. We note that for the two targets UMi and HD 171067 we did not detect the V/R footpoints in the spectrum. Instead, we assumed an emission-line width at the bottom of the resonance line of 0.1 nm, which happened to be identical to the V/R width of HD 120205. The and values are the corrected absolute chromospheric emission-line fluxes. These fluxes are likely not better than 20–30% despite that the relative fluxes are determinable to within a per cent from repeated measurements. The respective radiative losses are then uncertain by approximately 0.12 dex.
| Star | ||||
|---|---|---|---|---|
| (mag) | (106 erg cm-2s-1) | … | ||
| HD 120205 | 0.715 | 0.40 | 0.30 | –4.81 |
| HD 136137 | 0.71 | 0.63 | 0.43 | –4.59 |
| HD 136655 | 0.75 | 0.41 | 0.33 | –4.74 |
| HD 150202 | 0.71 | 0.85 | 0.71 | –4.42 |
| HD 171067 | 0.595 | 0.975 | 0.975 | –4.42 |
| HD 147443 | 0.51 | 1.86 | 1.82 | –4.37 |
| UMi | 0.39 | 2.48 | 2.86 | –4.39 |
6 Ages, masses, and radii
Making use of the effective temperatures and metallicities we determined in this work, the magnitude in band V and the Hipparcos parallax, we derived the stellar parameters, age, mass, surface gravity, radius, with the tool PARAM publicly available333http://stev.oapd.inaf.it/cgi-bin/param presented by da Silva et al. (2006). This tool performs a Bayesian estimate, by comparing the input parameters to the theoretical PARSEC isochrones by Bressan et al. (2012). The results are given in Table 13. The stars, as expected, are found to be young; except for HIP 90864 (HD 171067), they are all younger than the Sun. Their respective chromospheric indices in Table 12 suggest that these stars are younger than the Sun. Individual ages between 0.5–3 Gyr are suggested when compared to the recent activity-age relation in Pace (2013).
The mass derived by PARAM for HIP 80124, , is in perfect agreement with the mass we assumed in Sect. 3.6 to derive the gravity, . For UMi we had assumed in Sect. 3.7 to determine the surface gravity, in very good agreement with the result of PARAM of Table 13.
| Star | Age | Mass | Radius | ||
|---|---|---|---|---|---|
| (Gyr) | () | (cgs) | () | (mag) | |
| HIP 67344 (HD 120205) | |||||
| HIP 74858 (HD 136137) | |||||
| HIP 75132 (HD 136655) | |||||
| HIP 81284 (HD 150202) | |||||
| HIP 90864 (HD 171067) | |||||
| HIP 80124 (HD 147443) | |||||
| HIP 79822 ( UMi) |
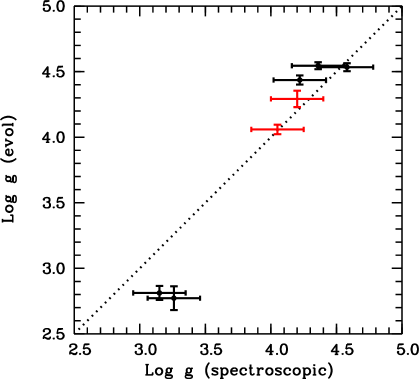
For two of the stars in our analysis (HIP 80124 and HIP 79822) the surface gravity was derived from the parallax, although the ionization equilibrium of Fe i and Fe ii we obtained was largely within the uncertainties. Although, in Fig. 5, the comparison of the spectroscopic surface gravity derived in our analysis to the evolution surface gravities is fair only for the other five stars (black symbols in the figure). For the two stars (red symbols, HIP 80124 and HIP 79822) the two values are both based on the parallax, and as expected, the agreement is very good. Also for the other three unevolved stars the agreement is within the uncertainties. The agreement is worse for the two sub-giant stars (see Fig. 5).
7 Conclusions
We analyzed a sample of seven young, solar metallicity stars for which the chemical analysis was lacking or not complete. We compared our results with the stellar parameters available in the literature, finding a general agreement. For five stars we derived the stellar parameters and the detailed chemical composition with our automatic code MyGIsFOS. For the two stars with high rotational velocities (HIP 80124 and HIP 79822) we derived the stellar parameters by other methods: from the wings of H and gravity from parallax and assumptions about the stellar mass. The chemical composition of these two stars were derived from EW measurements or line profile fitting of the available features.
Five of the stars show emission in the core of the Ca ii-H and -K lines. Their chromospheric emission-line fluxes are in agreement with ages between 0.5–3 Gyrs. For HIP 74858 and HIP 79822 no previous chemical analysis had been done. For the latter star, a chemical analysis is particularly interesting because this star has a cool companion dwarf of type M 4. Deriving the chemical composition for stars of this stellar type is very challenging and the chemical composition of the F-type companion would allow to improve our understanding of spectra of these cool stars.
In the sample of stars presented, two of them showed a strong Li i doublet from which we could derive the Li abundance. This was done using detailed 3D model atmospheres and by considering departures from LTE. The chemical pattern of HIP 80124 is not consistent with the solar composition derived from the spectrum of Ceres, which excludes it from being a solar sibling, as suggested by Brown et al. (2010). Its age is also found to be much younger than that of the Sun.
Acknowledgements.
We are grateful to F. Bouchy for redetermining off-line the radial velocity of HD 136655 from our SOPHIE spectrum. The project was funded by FONDATION MERAC.References
- Anders & Grevesse (1989) Anders, E., and Grevesse, N. 1989, Geochim. Cosmochim. Acta, 53, 197
- Batista et al. (2014) Batista, S. F. A., Adibekyan, V. Z., Sousa, S. G., et al. 2014, A&A 564, A43
- Boisse et al. (2010) Boisse, I., Eggenberger, A., Santos, N. C., et al. 2010, A&A, 523, A88
- Bouchy & Sophie Team (2006) Bouchy, F., & Sophie Team 2006, Tenth Anniversary of 51 Peg-b: Status of and prospects for hot Jupiter studies, 319
- Bressan et al. (2012) Bressan, A., Marigo, P., Girardi, L., et al. 2012, MNRAS, 427, 127
- Brown et al. (2010) Brown, A. G. A., Portegies Zwart, S. F., & Bean, J. 2010, MNRAS 407, 458
- Caffau & Ludwig (2007) Caffau, E. & Ludwig, H.-G. 2007, A&A, 467, L11
- Caffau et al. (2011) Caffau, E., Ludwig, H.-G., Steffen, M., Freytag, B., & Bonifacio, P. 2011, Sol. Phys. 268, 255
- Casagrande et al. (2011) Casagrande, L., Schönrich, R., Asplund, M., et al. 2011, A&A 530, A138
- Cayrel (1988) Cayrel, R.: 1988, The Impact of Very High S/N Spectroscopy on Stellar Physics, Proceedings of the 132nd Symposium of IAU, Edited by G. Cayrel de Strobel and Monique Spite, 132, 345
- da Silva et al. (2006) da Silva, L., Girardi, L., Pasquini, L., et al. 2006, A&A, 458, 609
- Delgado Mena et al. (2015) Delgado Mena, E., Bertrán de Lis, S., Adibekyan, V. Z., et al. 2015, A&A, 576, A69
- Delgado Mena et al. (2014) Delgado Mena, E., Israelian, G., González Hernández, J. I., et al. 2014, A&A, 562, A92
- Eker et al. (2008) Eker, Z., Ak, N. F., Bilir, S., et al. 2008, MNRAS 389, 1722
- Freytag et al. (2012) Freytag, B., Steffen, M., Ludwig H.-G., Wedemeyer-Böhm , Schaffenberger, W. & Steiner, O. 2012, Journal of Computational Physics, 231, 919
- Griffin et al. (2009) Griffin, R. F. 2009, The Observatory 129, 317
- Griffin et al. (2010) Griffin, R. F. 2010, The Observatory, 130, 60
- Hnatek (1920) Hnatek, A. 1920, ApJ, 52, 198
- Israelian et al. (2009) Israelian, G., Delgado Mena, E., Santos, N. C., et al. 2009, Nature, 462, 189
- Karak et al. (2014) Karak, B. B., Kitchatinov, L. L., & Choudhuri, A. R. 2014, ApJ 791, 59
- Kazarovets et al. (1999) Kazarovets, E. V., Samus, N. N., Durlevich, O. V., et al. 1999, Information Bulletin on Variable Stars, 4659, 1
- Kurucz (1993a) Kurucz, R. 1993a, ATLAS9 Stellar Atmosphere Programs and 2 km/s grid. Kurucz CD-ROM No. 13. Cambridge, Mass.: Smithsonian Astrophysical Observatory, 1993., 13
- Kurucz (1993b) Kurucz, R. 1993b, SYNTHE Spectrum Synthesis Programs and Line Data. Kurucz CD-ROM No. 18. Cambridge, Mass.: Smithsonian Astrophysical Observatory, 1993., 18
- Kurucz (2005) Kurucz, R. L.: 2005, Mem. Soc. Astron. It. Suppl., 8, 14
- Lemoine, Ferlet, & Vidal-Madjar (1995) Lemoine, M., Ferlet, R. and Vidal-Madjar, A., 1995, A&A 298, 879
- Lépine & Bongiorno (2007) Lépine, S., & Bongiorno, B. 2007, AJ, 133, 889
- Lodders et al. (2009) Lodders, K., Palme, H., & Gail, H.-P. 2009, Landolt Börnstein, 44
- Linsky & Ayres (1978) Linsky, J. L. & Ayres, T. R. 1978, ApJ, 220, 619
- López-Santiago et al. (2010) López-Santiago, J., Montes, D., Gálvez-Ortiz, M. C., et al. 2010, A&A 514, A97
- Ludwig et al. (2009) Ludwig H.-G., Caffau, E., Steffen, M., Freytag, B., Bonifacio, P. & Kučinskas, A. 2009, Mem. Soc. Astron. Italiana Vol. 80, 711
- Mamajek & Hillenbrand (2008) Mamajek, E. E., & Hillenbrand, L. A. 2008, ApJ, 687, 1264
- Masana et al. (2006) Masana, E., Jordi, C., & Ribas, I. 2006, A&A 450, 735
- McDonald et al. (2012) McDonald, I., Zijlstra, A. A., & Boyer, M. L. 2012, MNRAS 427, 343
- Meléndez et al. (2012) Meléndez, J., Bergemann, M., Cohen, J. G., et al. 2012, A&A 543, A29
- Montes et al. (2001) Montes, D., López-Santiago, J., Fernández-Figueroa, M. J., & Gálvez, M. C. 2001, A&A, 379, 976
- Montesinos et al. (1987) Montesinos, B., Fernandez-Figueroa, M. J., & de Castro, E. 1987, MNRAS 229, 627
- Mortier et al. (2013) Mortier, A., Santos, N. C., Sousa, S., et al. 2013, A&A, 551, A112
- Nordström et al. (2004) Nordström, B., Mayor, M., Andersen, J., et al. 2004, A&A, 418, 989
- Pace (2013) Pace, G. 2013, A&A, 551, L8
- Pasquini et al. (2008) Pasquini, L., Biazzo, K., Bonifacio, P., Randich, S., & Bedin, L. R. 2008, A&A, 489, 677
- Pasquini et al. (2012) Pasquini, L., Brucalassi, A., Ruiz, M. T., et al. 2012, A&A, 545, A139
- Pavlenko & Magazzú (1996) Pavlenko, Ya. V., Magazzú, A. 1996, A&A 311, 961
- Perruchot et al. (2008) Perruchot, S., Kohler, D., Bouchy, F., et al. 2008, Proc. SPIE, 7014, 70140J
- Perruchot et al. (2011) Perruchot, S., Bouchy, F., Chazelas, B., et al. 2011, Proc. SPIE, 8151, 815115
- Pizzolato et al. (2003) Pizzolato, N., Maggio, A., Micela, G., Sciortino, S., & Ventura, P. 2003, A&A, 397, 147
- Plaskett et al. (1921) Plaskett, J. S., Harper, W. E., Young, R. K., & Plaskett, H. H. 1921, Publications of the Dominion Astrophysical Observatory Victoria, 2, 1
- Pompéia et al. (2011) Pompéia, L., Masseron, T., Famaey, B., et al. 2011, MNRAS 415, 1138
- Reiners (2006) Reiners, A. 2006, A&A, 446, 267
- Samus et al. (2008) Samus, N. N., Durlevich, O. V., & et al. 2008, General Catalogue of Variable Stars, VizieR Online Data Catalog, 1, 2025
- Samus et al. (2010) Samus, N. N., Kazarovets, E. V., Pastukhova, E. N., Tsvetkova, T. M., & Durlevich, O. V. 2010, General Catalogue of Variable Stars, VizieR Online Data Catalog, 612, 11378
- Schröder et al. (2009) Schröder, C., Reiners, A., & Schmitt, J. H. M. M. 2009, A&A, 493, 1099
- Sbordone et al. (2014) Sbordone, L., Caffau, E., Bonifacio, P., & Duffau, S. 2014, A&A 564, A109
- Sbordone et al. (2004) Sbordone, L., Bonifacio, P., Castelli, F., & Kurucz, R. L. 2004, Memorie della Società Astronomica Italiana Supplementi, 5, 93
- Sbordone (2005) Sbordone, L. 2005, Mem. Soc. Astron. It. Suppl., 8, 61
- Shaya & Olling (2011) Shaya, E. J., & Olling, R. P. 2011, ApJS, 192, 2
- Soubiran et al. (2010) Soubiran, C., Le Campion, J.-F., Cayrel de Strobel, G., & Caillo, A. 2010, A&A 515, A111
- Strassmeier (2009) Strassmeier, K. G. 2009, A&A Rev., 17, 251
- Strassmeier et al. (2000) Strassmeier, K., Washuettl, A., Granzer, T., Scheck, M., & Weber, M. 2000, A&AS 142, 275
- Strassmeier et al. (2012) Strassmeier, K. G., Weber, M., Granzer, T., Järvinen, S. 2012, AN 333, 663
- Strassmeier et al. (2015) Strassmeier, K. G., Weingrill, J., Granzer, T., Bihain, G., Weber, M., & Barnes, S. A. 2015, A&A 580, A66
- Suárez Mascareño et al. (2015) Suárez Mascareño, A., Rebolo, R., González Hernández, J. I., & Esposito, M. 2015, MNRAS, 452, 2745
- Takeda et al. (2010) Takeda, Y., Honda, S., Kawanomoto, S., Ando, H., & Sakurai, T. 2010, A&A 515, A93
- Valenti & Fischer (2005) Valenti, J. A., & Fischer, D. A. 2005, ApJS, 159, 141
- van Leeuwen (2007) van Leeuwen, F. 2007, A&A 474, 653
Appendix A The 3D+NLTE abundance correction
We derive the “3D+NLTE abundance correction” (hereafter ) from an independent fitting procedure involving only synthetic spectra: for a given 3D hydrodynamical stellar atmosphere (taken from the CIFIST grid), and a given lithium abundance, A∗(Li), we compute a synthetic spectrum of the wavelength region around the Li i line at 670.8 nm, taking into account the 3D non-LTE effects for lithium, while treating the blending lines in LTE. This 3D non-LTE synthetic spectrum is then fitted by a grid of 1D LTE LHD reference spectra in exactly the same way as the observed spectrum is fitted with a grid of 1D LTE ATLAS9 synthetic spectra. The 1D LTE lithium abundance obtained from the best fit, A(Li)1DLHD-LTE, is then used to define the 3D+NLTE abundance correction as
| (1) |
The 1D reference model used for this procedure is a hydrostatic plane-parallel model atmosphere computed with the LHD code (see Caffau & Ludwig 2007) for exactly the same stellar parameters as the corresponding 3D model. It employs the same micro-physics and numerics (opacities, equation-of-state, radiative transfer scheme) as the CO5BOLD models. The main advantage of using this kind of 1D reference models is that they are differentially comparable to the associated 3D model, the only difference being the treatment of the convective energy transport: mixing-length theory in the LHD models (here assuming a mixing-length parameter equal to 1.00) versus 3D hydrodynamics in CO5BOLD.
The 3D+NLTE correction defined in this way takes into account the combined effect of 3D convection (stellar granulation) and departures from LTE (in the lithium line formation) on the spectroscopic abundance determination. In principle, this 3D+NLTE correction depends on the stellar parameters and on the lithium abundance A∗(Li). However, we point out that is a smooth and slowly varying function of these parameters. It is therefore sufficient to know this function at a few points covering the region of interest in the Hertzsprung-Russell diagram and the relevant range of Li abundances. The correction can then be obtained by interpolation for any particular point in the parameter space.
For a particular object, the 3D+NLTE correction is evaluated for the same stellar parameters as the ATLAS9 model used for fitting the observed spectrum, and for an input lithium abundance A∗(Li) defined by the implicit relation
| (2) |
Once the 3D+NLTE correction is known, the final lithium abundance is obtained from:
| (3) | |||||