Constrained Evolution of a Radially Magnetized Protoplanetary Disk:
Implications for Planetary Migration
Abstract
We consider the inner AU of a protoplanetary disk (PPD), at a stage where angular momentum transport is driven by the mixing of a radial magnetic field into the disk from a T-Tauri wind. Because the radial profile of the imposed magnetic field is well constrained, a deterministic calculation of the disk mass flow becomes possible. The vertical disk profiles obtained in Paper I imply a stronger magnetization in the inner disk, faster accretion, and a secular depletion of the disk material. Inward transport of solids allows the disk to maintain a broad optical absorption layer even when the grain abundance becomes too small to suppress its ionization. Thus a PPD may show a strong middle-to-near infrared spectral excess even while its mass profile departs radically from the minimum-mass solar nebula. The disk surface density is buffered at g cm-2: below this, X-rays trigger strong enough magnetorotational turbulence at the midplane to loft mm-cm sized particles high in the disk, followed by catastrophic fragmentation. A sharp density gradient bounds the inner depleted disk, and propagates outward to –2 AU over a few Myr. Earth-mass planets migrate through the inner disk over a similar timescale, whereas the migration of Jupiters is limited by the supply of gas. Gas-mediated migration must stall outside 0.04 AU, where silicates are sublimated and the disk shifts to a much lower column. A transition disk emerges when the dust/gas ratio in the MRI-active layer falls below , where is the grain size.
Subject headings:
accretion, accretion disks — magnetic fields — planets and satellites: formation — protoplanetary disks — turbulence1. Introduction
Our goal here is to develop a deterministic model for the redistribution of mass in the inner part of a protoplanetary disk (PPD). When considering accretion through a thin disk, a central problem is the dependence of the specific torque (or the ‘viscosity’) on distance from the accreting star. This question remains unresolved in most contexts, but it is essential to understanding the presence of exoplanets in small orbits around sun-like stars.
The planets discovered by Kepler probe the development of the natal disk over a broad range of radius and time (Lissauer et al., 2014). Our focus here is on angular momentum transport driven by magnetic stresses internal to the disk, including both the laminar Maxwell stress , and the turbulent stress that is driven by the magnetorotational instability (MRI; Blaes & Balbus 1994; Gammie 1996).
When the active column is determined only by external ionization, these internal magnetic stresses do not support a steady mass flow through the disk. The sign of the change in the surface mass density depends on the distribution of the seed magnetic field. Most MRI-based models assume a vertical seed field, whose radial distribution cannot yet be reliably calculated. This prevents a deterministic calculation of the disk evolution – a shortcoming which extends to torque models invoking magnetized winds (Pudritz & Norman, 1986; Suzuki et al., 2010; Bai & Stone, 2013).
It has long been realized that radial magnetic fields could have a strong influence on angular momentum transport in centrifugally supported flows, driven by the persistent winding of the magnetic field. A magnetocentrifugal wind from the central star, interacting with the upper layers of the disk, is a natural source for such a seed radial field. Indeed, the kinetic pressure of a T-Tauri wind can dominate the pressure of any wind that might flow from the disk surface during the later stages of PPD evolution.
This seed magnetic field is relatively strong in the inner disk, as is the induced torque. As we demonstrate in this paper, this has the interesting consequence that MRI-driven mass transfer removes material from the inner disk. A detailed description of the vertical structure of such a radially magnetized disk, including non-ideal MHD effects, can be found in Russo & Thompson (2015; hereafter Paper I).
A PPD modeled with a uniform viscosity coefficient has a gas surface density profile slightly flatter than the one obtained by radial smoothing in the solar system, (e.g. D’Alessio et al. 1998; Menou & Goodman 2004). A similar profile is obtained by averaging over the Kepler planetary systems, but with a normalization an order of magnitude higher (Chiang & Laughlin, 2013). Formation of these exoplanets in situ then poses a significant conundrum: either their assembly must be delayed long after the condensation of solids in the inner disk, or rapid migration must be suppressed (e.g. Ogihara et al. 2015).
A much different surface density profile is obtained following an accretion outburst driven by runaway MRI activation of a heavy disk (e.g. Zhu et al. 2009): one finds growing with radius up to a peak at –3 AU, as limited by the onset of gravitational instability. (This is a plausible mechanism for FU Orionis-type outbursts, which may occur several times during the early formation of a PPD.) Evolving this profile forward with the torque mechanism developed in Paper I, we find that that the PPD does not regenerate an inner surface density cusp following its final accretion outburst.
The similarity between the mass profile deduced from the Kepler systems and a uniform- disk may therefore be illusory. An alternative explanation can be found in terms of the stability of planetary architectures, with the mean separation between planets limited to a multiple of the planetary Hill radius (Chambers et al., 1996; Smith & Lissauer, 2009; Funk et al., 2010).
Another longstanding puzzle involves the relatively brief interval over which PPDs appear as ‘transition disks’ with extended internal cavities in reprocessed stellar light (Strom et al., 1989; Williams & Cieza, 2011). Here we show that the evolution toward a low- profile can occur very rapidly, while the flux of dust into the inner disk remains high enough to maintain an optical absorption layer. The dust loading of material flowing inside AU can be determined from a competition between inward advection and adhesion and settling. Evolution to a transition disk does not then require a sudden or major structural change, merely a reduction in the dust loading of the accreting gas.
Although a secular depletion of gas in a PPD can clearly inhibit planetary migration, the presence of close-in exoplanets is also suggestive of a regulatory mechanism that maintains high enough to permit some migration over a –10 Myr timescale. As a first estimate, consider migration driven by linear Lindblad and corotation torques (‘linear Type I’: Goldreich & Tremaine 1980; Ward 1991). A planet of mass and semi-major axis moves radially on a timescale
| (1) | |||||
where is the mass of the central star, is the Keplerian angular frequency, and is the isothermal sound speed in gas of mean molecular weight . Expression (1) points to a surface density g cm-2 over AU. Although this torque model is greatly oversimplified, a migration timescale comparable to the above estimate is supported by more detailed considerations of planet migration in our model disk, as presented in the concluding section.
We identify the following feedback mechanism. A column g cm-2 is comparable to the column that can be ionized by stellar X-rays. Maintaining a moderate ionization level, which is essential to the MRI, also depends on a strong depletion in m-sized dust grains. In a disk with initially exceeding , most of the solid material settles close to the midplane, where the vertical component of gravity nearly vanishes.
As is reduced by mass transfer through the outer MRI-active layers of the disk, the ionization level rises near the midplane, permitting the lofting of solid particles from the settled layer. This creates an abundance of small grains through catastrophic fragmentation, because collisions typically first occur high in the disk, where the particle drift speed greatly exceeds the fragmentation speed. Thus the penetration of X-rays to the midplane, accompanied by the excitation of MRI turbulence, leads to a strong feedback on the amplitude of the turbulence.
This mechanism for regulating depends on the persistence of a midplane particle layer over a period of Myrs. Small particles could well be depleted by planetesimal formation but, in the absence of large planets, are easily resupplied by inward drift from the outer disk, mediated by azimuthal gas drag.
1.1. Plan of the Paper
The model of a radially magnetized PPD developed in Paper I is reviewed in Section 2, and its radial structure is described in Section 3. The inflow of dust through the turbulent upper layer of a PPD, and the reprocessing of stellar light by this layer, is addressed in Section 7. The feedback of midplane particles on the disk viscosity results in a buffered sequence of MRI-active disk solutions, which are described in Section 5; a much lower gas column is obtained in the absence of dust.
The evolution of a global disk model is tackled in Section 6: a similar end result is obtained for different initial disk profiles. Characteristic timescales for planet migration are outlined in Section 8, along with broader implications of this disk model. The Appendix presents our calibration of a post-FU Ori outburst disk, at the stage where dust condenses out of the gas phase and MRI turbulence is truncated near the midplane.
Throughout this paper we will sometimes use a shorthand , with quantity in c.g.s. units.
2. Review of Radially Magnetized Disk Model
Vertical disk profiles are obtained (Paper I) by starting with a weakly magnetized PPD and a stellar wind, which forms a turbulent boundary layer with the upper disk. The radial magnetic field that is implanted into the boundary layer is gradually raised in strength to a maximum value G at AU, corresponding to a split-monopole profile reaching G at the stellar radius . The stellar wind sweeps back any poloidal magnetic field whose pressure is less than a fraction of the disk thermal pressure; here is the Shakura-Sunyaev viscosity coefficient.
The implanted radial field is quickly sheared in the toroidal direction, at a rate , thereby triggering MRI activity. The growth of the toroidal field is eventually limited by transport into the deeper, weakly conducting layers of the disk. The magnetic pressure generated in the disk-wind boundary layer pushes the radial field downward, thereby exciting a toroidal field and MRI activity at progressively greater depths. This process terminates in a hydromagnetically ‘dead’ zone that extends to the midplane. Vertical transport of and is mediated by (i) Ohmic drift; (ii) ambipolar drift; (iii) MHD turbulence that is generated by MRI; and (iv) turbulence driven by the wind shear in the boundary layer.
| Stellar Model Parameters | |
|---|---|
| erg s-1 | |
| 1 keV | |
| Wind Model Parameters | |
| yr-1 | |
| 400 km s-1 | |
| G | |
| Turbulence Model Parameters | |
The T-Tauri wind is launched from the stellar magnetosphere and flows radially at km s-1. It transfers mass at a rate yr-1, which is consistent with of the accretion rate through our model disk. Such a ratio of outflow to inflow is motivated by observation (Calvet, 1997) and by the spin rates of T-Tauri stars (Matt & Pudritz, 2005).
The nominal upper boundary of the flared disk is defined by a balance between thermal pressure and the normal component of the wind ram pressure. The thickness of the disk material that is overturned by the wind, and into which the radial magnetic field is mixed, is limited by radiative cooling. We find g cm-2 in an upper layer of atomic H that is regulated to K by electronic transitions. The deeper layers of the disk are mainly composed of molecular H2, and cool to a temperature K that is determined largely by the absorption of stellar optical light on dust grains (Chiang & Goldreich, 1997). The accretion rate and disk optical depth are low enough that the midplane temperature and scaleheight are similar to those of a passively irradiated disk, AU. Both the atomic and molecular layers are therefore taken to be isothermal, with a smooth but rapid transition in temperature at the cooling column.
Ionization of the disk is dominated by thermal X-rays from the stellar corona. Particular care must be taken with respect to the dependence of ionization rate on radius. It is determined by an approximate solution to the radiative transfer equation that is consistent with the Monte Carlo results of Igea & Glassgold (1999), but drops off with radius more rapidly than the analytic fit used by Bai & Goodman (2009) (and employed in several recent numerical simulations). We take as fiducial values an X-ray luminosity erg s-1 and an optically thin, thermal bremsstrahlung spectrum with temperature keV. Refractory solids are assumed to be depleted from the gas, and the mass fraction of volatiles (C, N, O, Ne, and S) is reduced by a factor compared with solar abundance. The abundance of free metal atoms with low ionization potential (e.g. Mg) is taken to be of the solar abundance.
MRI activity is maintained at ranging up to –30 g cm-2, below which the instability is quenched by Ohmic and ambipolar drift. Here the radial transport of angular momentum may still be maintained by a laminar Maxwell stress (Turner & Sano, 2008; Okuzumi & Hirose, 2011; Mohanty et al., 2013; Lesur et al., 2014). Depending on the magnetization, this ‘undead’ zone may extend to columns as high as g cm-2.
Our baseline disk profile is constructed by ignoring the adsorption of charged particles on the surfaces of m-sized dust grains. This is consistent with a mass fraction of grains of radius smaller than m-1 near the base of the MRI-active layer, and implies a net depletion below of the solar abundance.111Throughout this paper, and are used to denote mass and number fraction, respectively. In this paper, we investigate the effect of an enhanced dust abundance on the ionization and torque profiles.
The following two sections review further details of our calculation of the magnetic field profile in the disk, the rate of radial mass transfer, and the limitations imposed by non-ideal MHD effects on internal disk torques.
2.1. Non-ideal MHD Effects and Turbulence
We calculate the vertical profile of the background magnetic field and mass density by combining the steady form of the induction equation
| (2) |
with the equation of magnetostatic equilibrium,
| (3) |
Here is the current density. In layers where the undular Newcomb-Parker mode is excited (Newcomb, 1961), the density gradient is set to give marginal stability of this mode, , with adiabatic index . Then the scale height .
The Ohmic diffusivity (as derived from the diagonal component of the resistivity tensor) is rescaled to include the combined effects of MRI-driven turbulence and Kelvin-Helmholtz mixing near the boundary layer,
| (4) |
Hall drift and ambipolar drift are parameterized by (Wardle & Salmeron, 2012):
| (5) |
Ohmic diffusion dominates in dense and weakly magnetized regions, while ambipolar drift is dominant in the opposite limit.
Hall drift turns out to play a significant role in sustaining a non-axisymmetric MRI in a strong toroidal magnetic field (Paper I), but is of secondary importance for vertical transport of the mean magnetic field. That is because the vertical component of the Hall-drift speed is proportional to the radial gradient of . Even though throughout the MRI-active layer, vertical Hall drift is suppressed by an additional factor . This is true as long as the vertical field .
The Ohmic and ambipolar Elsasser numbers
| (6) |
provide the most accurate local measure of the ability diffusion to limit the growth of MRI turbulence. Here is the Alfvén speed. When either Elsasser number falls below a critical value, fields can diffuse across a perturbation before it can develop into turbulence.
We assume that the MRI is cut off at critical Elsasser numbers
| (7) |
Our choice of comes from three-dimensional shearing box studies, which typically invoke weaker starting fields (Sano & Stone, 2002; Simon & Hawley, 2009; Bai & Stone, 2011; Flock et al., 2012). Different values of and change the magnitude of the radial mass flux through the disk by varying the active column, but have a weak effect on the radial dependence of the mass flux.
The choice of is motivated in part by a linear, non-axisymmetric stability analysis of a toroidally magnetized disk that includes both Hall and ambipolar drift (Paper I). This stability analysis shows that the MRI is more easily sustained at high magnetization in the presence of a toroidal, as opposed to vertical seed field. The Poynting flux associated with a growing MRI mode is predominantly horizontal, in contrast with the case of a vertical seed field, where the Poynting flux is directed vertically. On this basis, vigorous MRI-driven turbulence is not suppressed in a background toroidal field by propagation out of the growth layer, as numerical experiments find it to be when the seed field is strong and vertical, (Bai & Stone, 2013).
A high toroidal magnetization is sustained in the upper disk, –10, and so we treat the MRI-generated stress as a perturbation to the background field pressure. The ambipolar diffusivity is taken to depend only on the background field . A first estimate of the equilibrium magnetization is obtained by balancing winding of the mean radial seed field against vertical transport across a scale height with a diffusivity
| (8) |
where is the mean toroidal seed field generated by winding and is constant. One finds (Paper I)
| (9) |
The main challenge here is to make an appropriate choice for the amplitude and index . We find that –300 up to a column – g cm-2 below the surface, beyond which the free electron fraction drops precipitously. (See Figure 1 in Paper I.) This is higher by a factor –30 than in the simulations of Lesur et al. (2014), Bai (2014), and Gressel et al. (2015) which impose a vertical seed field, and in which MRI turbulence is only marginally excited. On the other hand, the magnetization is high enough that the scaling which is found for weak seed fields in direct numerical simulations (Hawley et al., 1995) cannot be trusted. We choose to scale directly with the seed toroidal magnetic pressure, corresponding to :
| (10) |
Here . The last two factors on the right-hand side of Equation (10) implement the cutoff of the MRI-generated stress at low values of and .
The main results of this paper are not sensitive to this calibration of . The rate of mass transfer scales as , and one obtains inside-out mass depletion for in the full range , as can be seen from Figure 2 of Paper I. We view our normalization as conservative, given that simulations of the MRI with a weak seed field demonstrate enormous growth of the Maxwell stress.
The active layer is defined by the column , measured below the top of the disk, where is reduced by a factor 2 by Ohmic and ambipolar diffusion. Typically reaches its threshold value higher in the disk than does , so that the quenching of the MRI is mainly driven by Ohmic losses.
The disk-wind boundary layer is strongly magnetized given the chosen wind parameters, but our enforcement of marginal Newcomb-Parker stability causes the scale height to saturate at . The turbulent diffusivity in the mixing layer is therefore taken to be
| (11) |
We take (with a sharp cutoff below the base of the boundary layer as given by Equation (48) of Paper I) representing the fact that the depth of the mixing layer is set by a balance between Kelvin-Helmholtz-driven overturns and radiative cooling. Given rapid mixing in the boundary layer, we adopt the upper boundary condition . The deeper profile of the disk, in particular its magnetization and turbulent amplitude, turn out to be insensitive to the value of and to the boundary condition on .
2.2. Angular Momentum Redistribution
Turbulence in a thin PPD redistributes the background magnetic field primarily in the vertical direction, but also transfers angular momentum in the radial direction. These two effects are respectively encapsulated in a renormalized magnetic diffusivity and viscosity. Here we simply equate these diffusivities, corresponding to unit magnetic Prandtl number:
| (12) |
This choice is supported by some numerical simulations of the MRI with an imposed vertical field (Fromang & Stone, 2009; Guan & Gammie, 2009; Lesur & Longaretti, 2009).
The radial flow of disk material is driven by a combination of turbulent stresses and the laminar Maxwell stress. The time evolution of the disk can be calculated, following Lynden-Bell & Pringle (1974), from the equation of conservation of angular momentum for a ring of radial thickness and mass ,
| (13) |
The total turbulent laminar magnetic couple acting at radius is
| (14) | |||||
where
| (15) |
and , are the viscosity coefficients defined in Equations (8), (11). The parameter
| (16) |
exceeds below the active region, and may also exceed in the disk-wind boundary layer where .
The local mass transfer rate
| (17) |
can be written in terms of local disk quantities when and ,
| (18) |
The gas surface density evolves with time unless , :
| (19) |
Linear winding of the radial magnetic field is sustained at lower values of than is MRI turbulence. An upper limit on the Lorentz force is obtained by requiring the Ohmic contribution to the vertical electric field to be smaller than the contribution from the disk rotation,
| (20) |
The torque density is given by
| (21) |
so the laminar stress can be no larger than
| (22) |
Here as both Ohmic and ambipolar diffusion may be responsible for the reduced coupling of the magnetic field to the neutral particles. Here Ohmic diffusion dominates near the torque cutoff, corresponding to
| (23) |
or, equivalently,
| (24) |
We find that is generated by linear winding in and below the active layer. The cutoff in laminar torque then sits at g cm-2 below the disk surface, and .

3. Radial Profiles
We now present radial profiles of the disk magnetization, turbulence, and rate of mass transfer. The radial magnetic field that is imposed at the surface of the disk is take to be
| (25) |
Vertical disk profiles are obtained at cylindrical radii –1 AU (Paper I), and are now used to construct radial profiles of various disk properties. Section 6 treats the evolution of the disk.
We start with a total gas column g cm-2, not much larger than the MRI-active column. Part of the motivation here is to check whether the disk evolves self-consistently to a low column. Given that the solids initially present in the inner disk have mainly settled to the midplane, the structure of the active layer would not be strongly modified by the presence of a thicker, quiescent layer below it. In addition, grows with radius inside –3 AU in the aftermath of an ionization-driven instability (Zhu et al. 2009; Appendix A). This means that the final evolution of the inner, layered disk may start with relatively little gas compared with uniform- accretion models.
3.1. Equilibrium Magnetization
The upper disk becomes magnetically dominated in response to the embedding of a radial field of strength –1. The magnetization shows a pronounced peak at a relatively shallow depth within the active layer (Figure 1), which disappears inside AU. Below this peak, the magnetization drops monotonically toward the midplane, and in particular is lower at the base of the active layer where most of the radial mass transfer is concentrated.
3.2. Vertical Structure
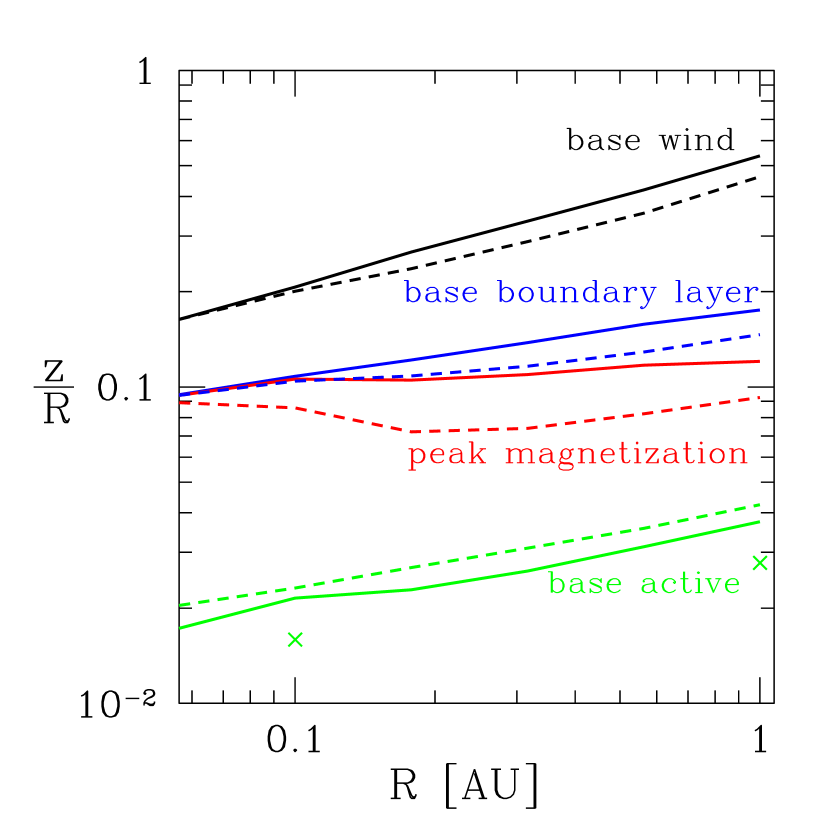
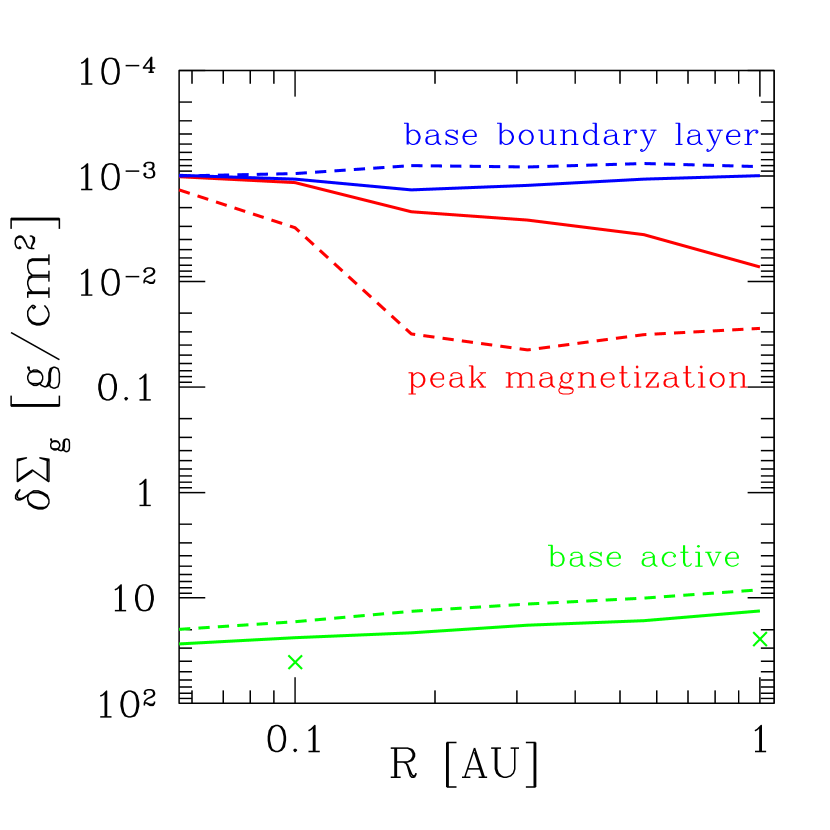
The disk is comprised of several layers, the transitions between which are shown in Figure 2. From the top: (i) the nominal boundary between hydrostatic disk and T-Tauri wind, where thermal pressure balances the normal component of the wind ram pressure; (ii) the base of the disk-wind boundary layer, where radiative cooling balances the input of turbulent kinetic energy from the damping of velocity shear; (iii) the surface of peak magnetization; and (iv) the base of the active layer, where . Our treatment of each of these transitions is discussed in more detail in Paper I.
The heights of these transitions all flare with radius. In spite of the high magnetization that is reached in the uppermost parts of the inner disk, this flaring is similar to that obtained in a thermally supported, Keplerian disk. This result is partly the result of our imposition of marginal stability to undular Newcomb-Parker modes: the zone of marginal stability expands to fill the active layer when the imposed magnetic field approaches the full strength considered, G ().
The column density through the active layer is shown in the right panel of Figure 2. The analytic fit g cm-2 applies at . The negative radial slope arises from the increased ionization rate in the inner disk, combined with the decrease of the toroidal field with radius, near the midplane. By comparison, the base of the disk-wind boundary layer sits at a relatively uniform depth g cm-2.
An optical absorption layer is present in the disk as long as the mass fraction of m sized solid grains exceeds , as we show in Section 4. Its height varies from – within the lower part of the active layer – up to as is raised to solar abundance.
3.3. Mass Transfer Rate
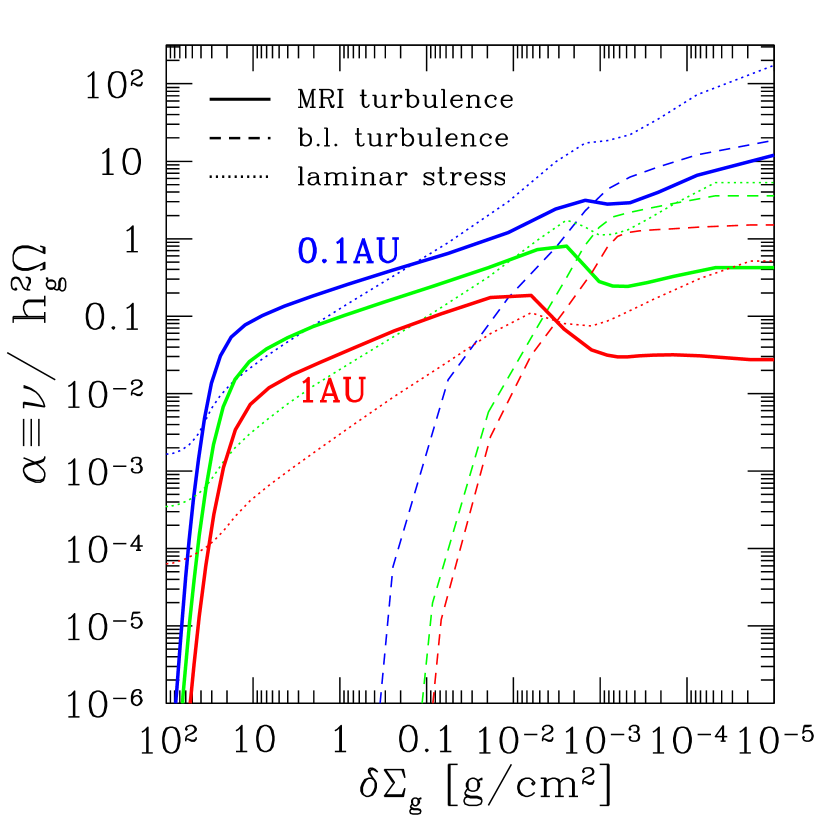
Mass transfer in the disk is driven by a combination of MRI turbulence, the laminar stress , and turbulence in the disk-wind boundary layer. Figure 3 shows the vertical profile of the turbulent amplitudes and . Turbulence driven by disk-wind mixing is cut off sharply below the boundary layer. The drop in above –30 g cm-2 reflects the onset of rapid Ohmic diffusion. The effective parameter (16) representing the laminar torque is also shown.
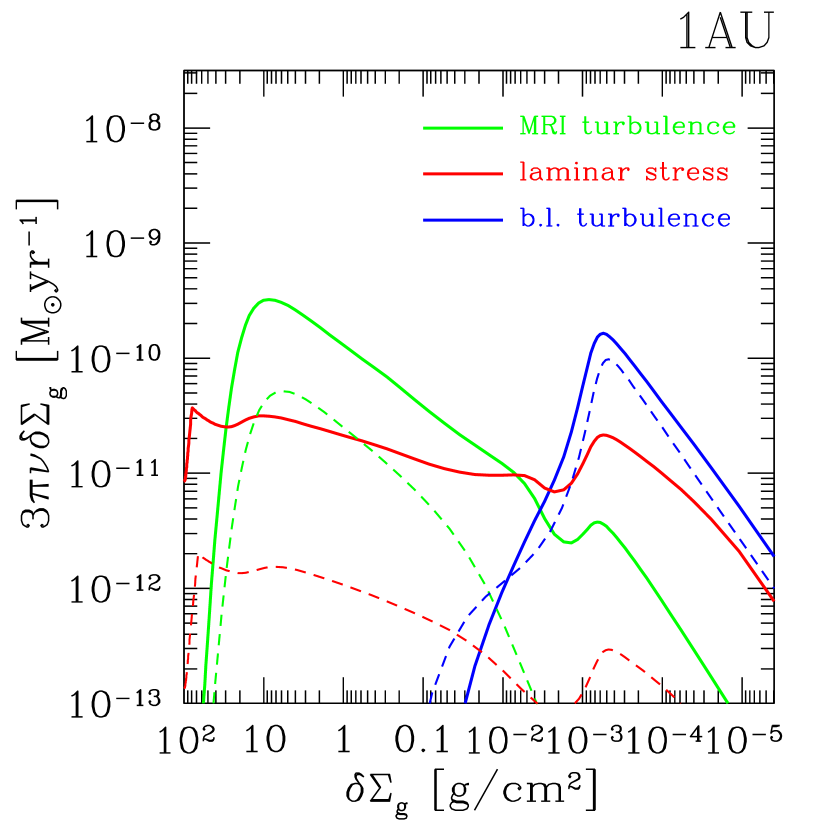
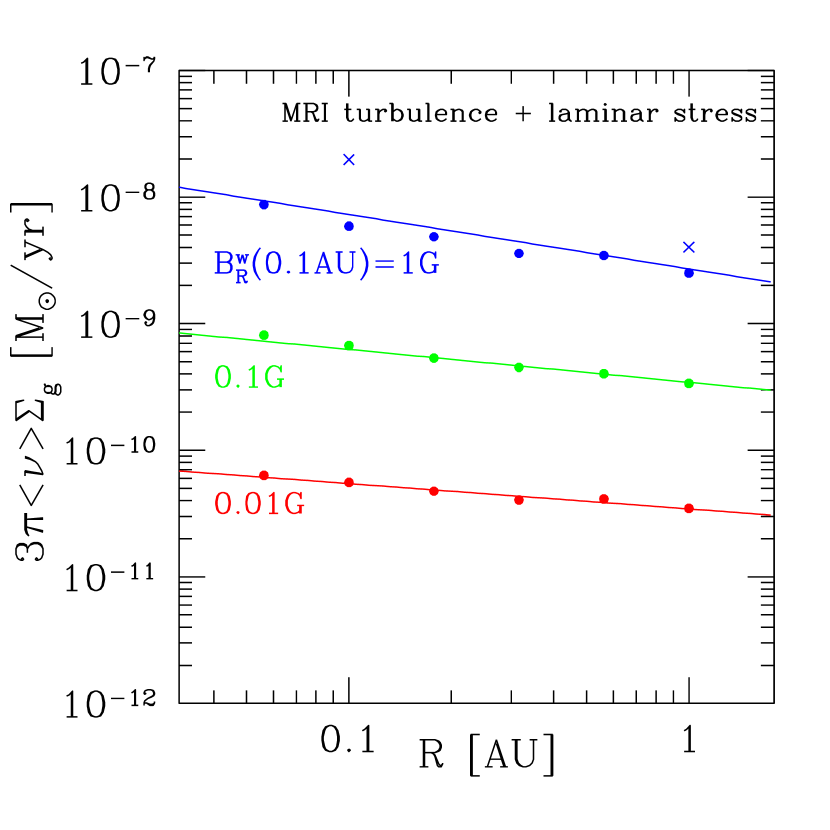
The mass transfer rate that is contributed by these stresses is shown versus column depth in Figure 4. Although only exceeds in the diffuse upper disk and in the dead zone (where it is ), the laminar stress still contributes significantly to closer than AU to the star.
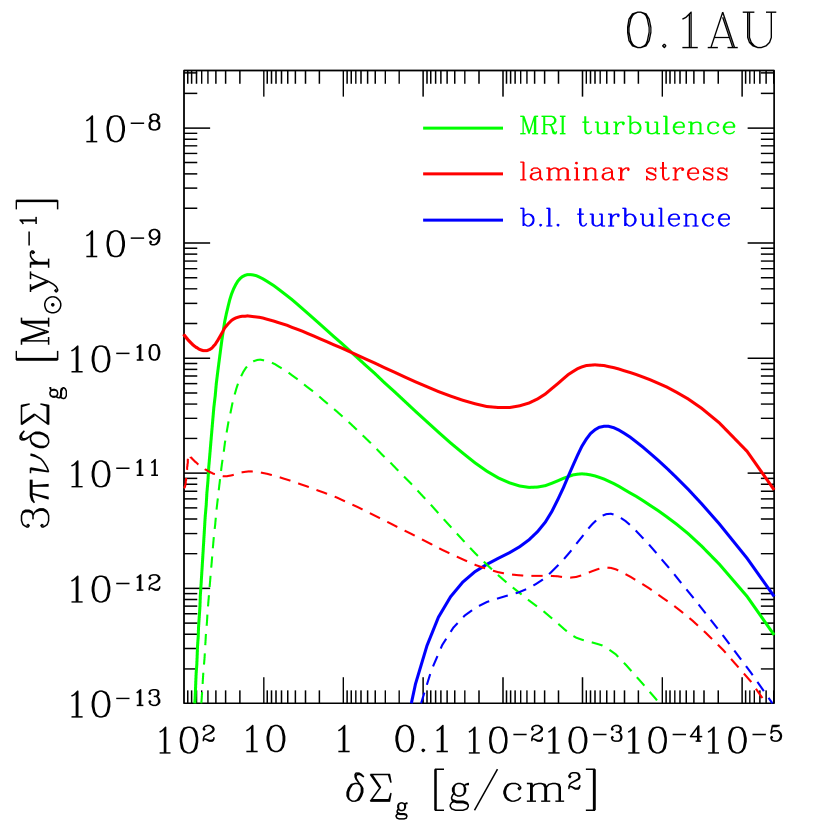
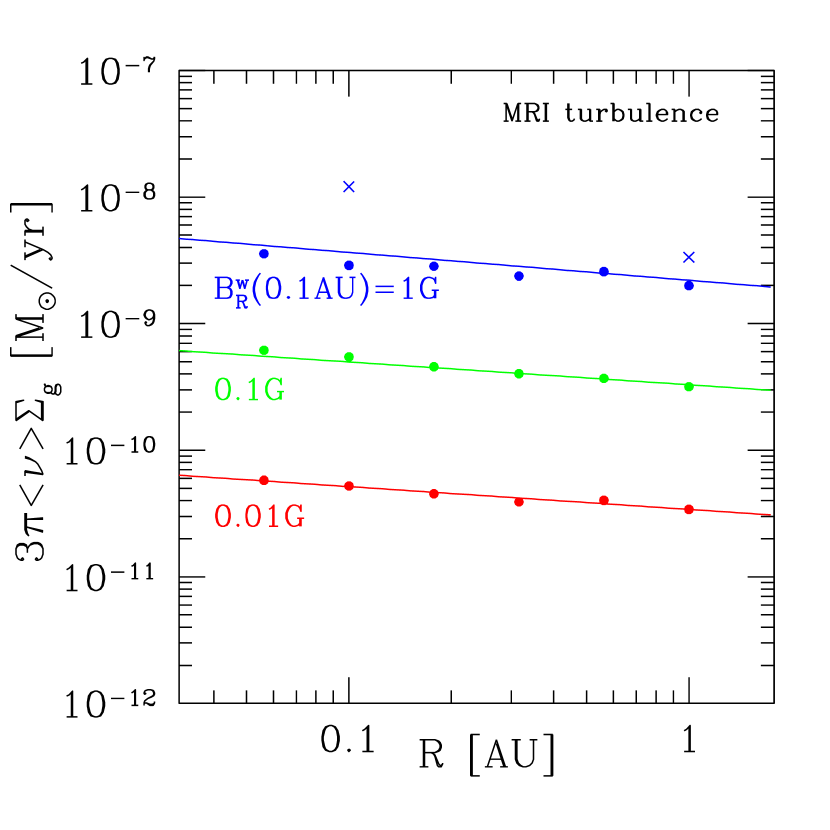
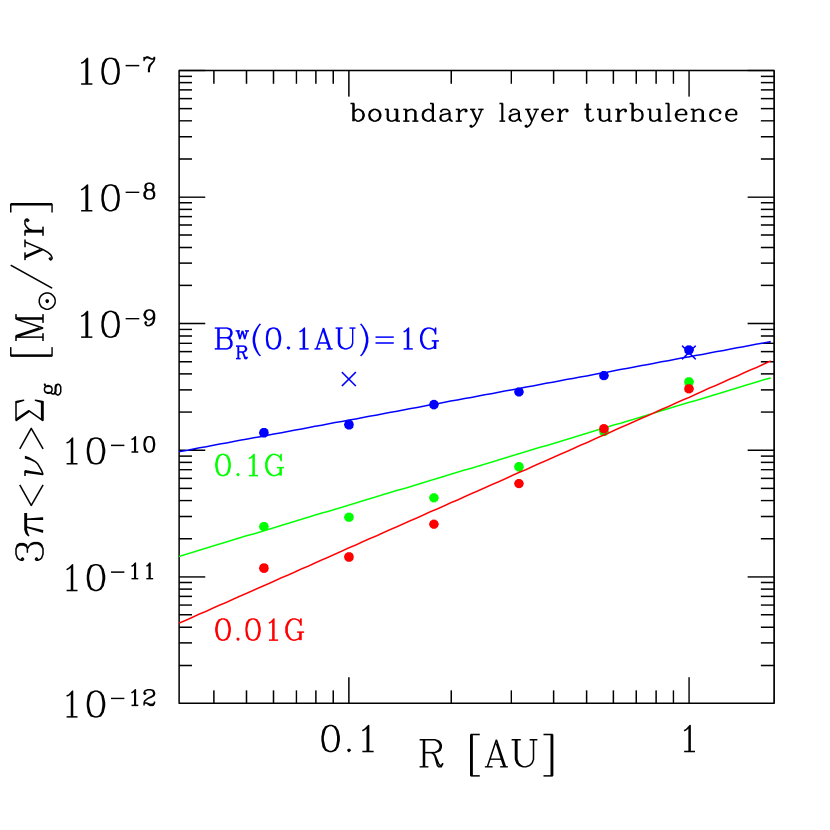
Figure 5 shows the vertically summed contribution of each type of stress to the mass transfer rate. Each varies with distance from the protostar in a different way. Importantly, the two dominant contributions (driven by the MRI and by the laminar stress) both decrease with radius.
The MRI-generated flow depends on the strength of the linearly amplified (seed) toroidal field and the depth of the X-ray ionized layer. Combining Equations (8), (12), (2.2) and (26) gives
One finds using the power-law fit to . This is to be compared with the slightly negative gradient that is derived from the full vertical profiles (Figure 5). The difference arises from a somewhat larger near the base of the active layer in the inner disk.
We find that the laminar stress is competitive with the MRI stress at small radii, causing a non-negligible mass flux below the active layer. It also provides a strong contribution near the base of the boundary layer. One finds (Equation (8) of Paper I)
Note that this expression does not include the additional contribution to from the laminar zone below the MRI-active layer. In agreement with the numerical results, it shows a stronger decrease with radius than , and comes close to reproducing the amplitude plotted in Figure 4.
The sum decreases with radius in both the numerical results and this analytic approximation (Figure 6). The analytic scalings and are confirmed from the vertical profiles.
The mass flux driven by boundary layer turbulence increases with radius (recall that for an atomic layer of uniform temperature K). It is negligible compared with , when . Because the structure of the boundary layer is not yet calibrated by hydrodynamical simulation, we neglect its contribution to the disk evolution in Section 6.
The active column is only logarithmically dependent on the inclination angle between disk surface and the stellar X-ray source. The height of the ionized column is pushed to a larger number of thermal scale heights . The pressure also increases. On the other hand, the scale height in the active layer decreases, . The net effect is to decrease the turbulent viscosity as deduced from Equations (8), (9), and (12):
| (29) |
This effect is only partly compensated by a mild increase in the equilibrium gas temperature resulting from the increased irradiation. We conclude that a negative scaling of with radius is actually enhanced if the inner disk starts with a higher column than we are using to construct our vertical profiles (as it almost certainly does).
3.4. Inner Disk without Settled Particles
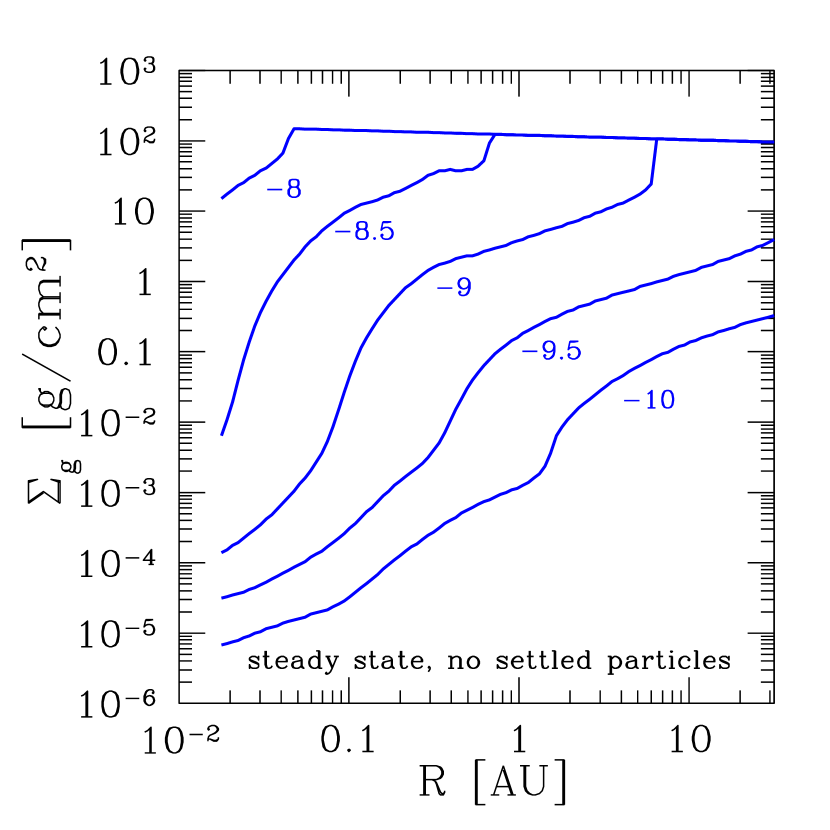
We now construct the surface density profile corresponding to steady accretion, , through an inner disk without a significant mass of settled particles or embedded dust grains. Strong depletions of gas, to a surface density below below , are then obtained at accretion rates below yr-1. If the disk is able to reach this state, then macroscopic (mm-cm sized) particles are self-consistently removed on a short timescale by inward drift. The case where the decrease of is halted by a continuous supply of particles from the outer disk is explored in detail in Section 5.
The total gas column is obtained for a given by inverting using the profiles of and plotted in Figure 4. The result is shown in Figure 7.
One finds that the laminar torque dominates at small , resulting in very small total disk columns . An accretion rate yr-1 can be supported by a total column of atomic gas as small as g cm-2 in the inner disk. This is primarily due the highly efficient laminar stress in the boundary layer, where the mass transfer rate is
| (30) |
This disk solution applies inside the sublimation radius of silicates (Equation (40)), even if settled particles are present further from the protostar. The resulting outward gradient in has interesting implications for planetary migration (Section 8).
4. Optical Absorption Layer in a Dust-Depleted Disk
The disk profiles examined here assume that embedded dust has a minor impact on the ionization level sustained by stellar X-rays. This implies a mass fraction of m-sized grains smaller than . Such a level of dust depletion still allows the formation of an optical absorption layer. In other words, the disk can remain optically thick to stellar light even while the dust abundance is too small to reduce appreciably the equilibrium ambipolar Elsasser number . Here we show how the height of the optical absorption layer depends on the level of dust depletion.
The inner part of a PPD will not appear as a transition disk if its column is reduced to and then sustained there by the fragmentation of settled particles. The brightness of the disk in the near-IR is more ambiguous if the column falls further to the low level shown in Figure 7.
Because the number density of dust grains is much smaller than that of free electrons, electron adsorption on grains is suppressed by the build-up of electric charge (see Ilgner & Nelson 2006; Bai & Goodman 2009, and Sections 3.3 and 3.4 of Paper I). Depletion of free electrons is then mediated by the adsorption of positively charged molecular ions and metal atoms, followed by recombination on grain surfaces. An estimate of the critical value of is obtained by balancing the adsorption rate
| (31) |
where and are the grain radius and number density, against the recombination rate with a free electron in the gas phase. Our choice of recombination coefficient is given by Equation (23) in Paper I, corresponding to an abundance by number of free metal atoms. The geometric optical depth of spherical grains of mass density through a disk of scale height at a column below its surface is
| (32) |
Combining the above two equations with the relation between and gives
| (33) |
The vertical models constructed in Paper I reach in the active layer, and so allow a substantial optical depth.
At millimeter wavelengths, where the outer parts of PPDs are spatially resolved, depletion factors range from to compared with the interstellar dust/gas ratio , and about of PPDs in the Taurus region are depleted by more than a factor in large grains (Furlan et al., 2006; D’Alessio et al., 2006). This depletion is frequently interpreted as evidence of grain growth and settling.
Previous modelling of the IR spectral energy distributions of T-Tauri and Herbig Ae stars is consistent with an optical absorption layer sitting scale heights above the disk midplane (D’Alessio et al., 1999; Chiang et al., 2001). There is some evidence that the height of this layer decreases with age, reaching at a few Myr and before the formation of a transitional disk. The radial dependence of inside AU is only weakly constrained by mid-IR spectra, except in cases where a dust cavity is present (Williams & Cieza, 2011).
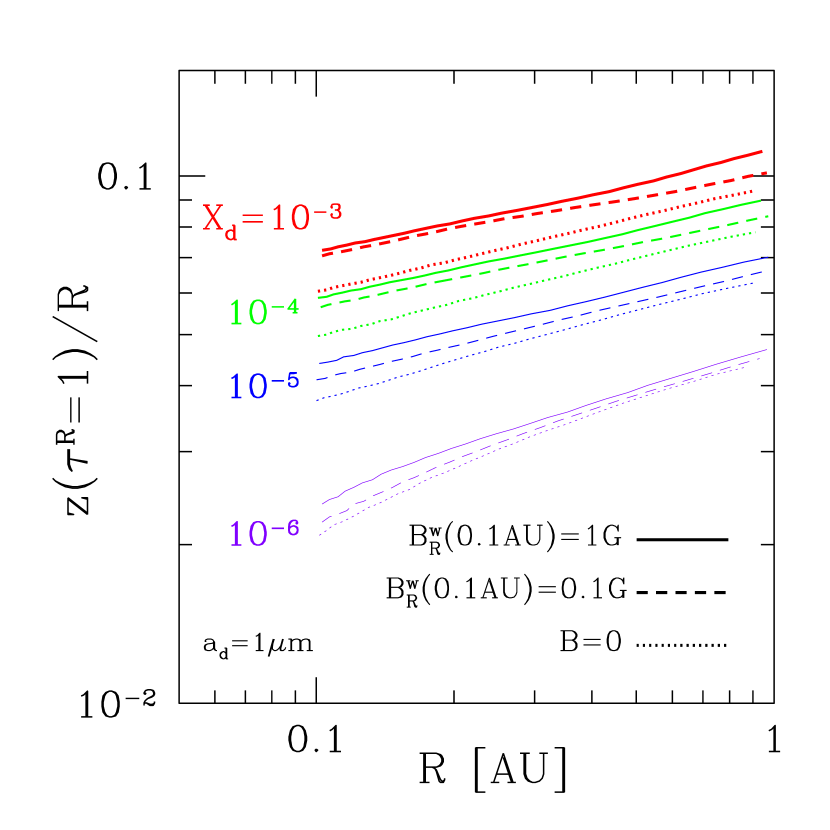
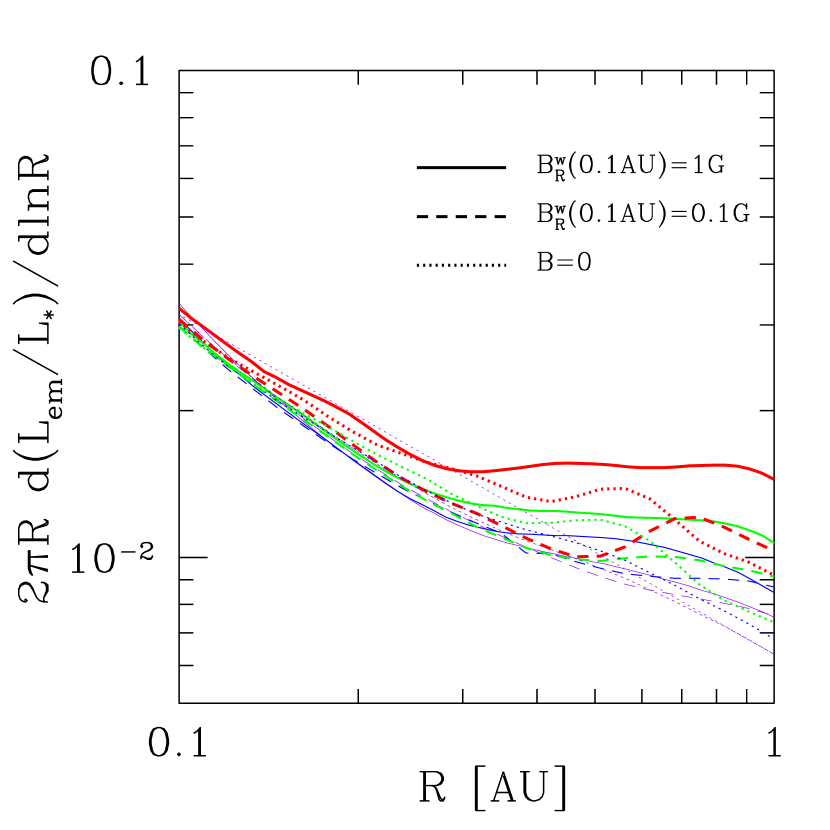
We perform the exercise of varying while fixing the disk mass profile. Here is, for simplicity, assumed to be independent of radius. We focus on the radial distribution of the reprocessed IR emission from the flared disk surface. We only consider the reradiated fraction of the stellar luminosity . The spectrum of the re-emitted IR also depends on the size distribution of grains, which is a complicated matter, and for that reason we do not attempt to model it here.
Our procedure is to calculate the optical depth along stellar rays over a range of polar angles, using a two-dimensional spline (in , ) of the density profiles obtained in Paper I. The optical absorption layer is defined by the position on each ray where in the visual band assuming m sized grains. Rays are taken to originate from a point on the star’s photosphere (determined by its average height), with .
The height of the resulting absorption layer is shown in Figure 8 for , , . It increases from to as is raised from to 10. It should be kept in mind that fragmentation of grains in the upper disk will cause to decrease inward, so that need not be constant even for a uniform mass fraction of grains advected by accreting gas. The absorption layer begins to disappear from the inner disk when drops below cm-1.
Figure 8 also shows that the fraction of that is intercepted by each radial annulus of the disk varies weakly with the dust loading when , as is considered in this work. That is because the absorption layer flares more strongly outward for lower values of , thereby compensating the smaller total angle that is subtended by the layer. In the upper range of considered, the absorption layer maintains a simple profile, .
The stronger flaring of the absorption layer that is seen for smaller is partly explained by the larger angle of incidence of the stellar photons reaching the inner disk: emission from a finite height above the disk tends to reduce the path length through the gas and push the absorption layer to a higher vertical gas column.
The absorption layer also expands vertically with increasing strength of the imposed radial magnetic field. In our disk model, this effect is strongly curtailed by imposition of (marginal) Newcomb-Parker stability. A mild flattening of the photosphere in the inner disk is caused by the slightly stronger magnetic support there. This also has the effect of introducing some mild shadowing of the disk at intermediate radii ( AU). The net effect is that the IR emission from our model disk is only weakly sensitive to the large radial variation in its internal magnetization.
5. Radial Gas Flow Limited by
the Stirring of Solids
Our focus in this paper is on the flow of gas in a PPD after its self-gravity stops playing a significant role in angular momentum transport. Then solids condensed from the vapor phase will settle to the disk midplane over a broad range of radius (Chiang & Youdin, 2010). Small grains rapidly stick to form larger particles at gas columns , where MRI turbulence is strongly suppressed. Particles may grow to mm-cm sizes during settling (Goldreich & Ward, 1973).
Here we consider the constraints on radial spreading that are imposed by the continuing interaction of the gas with a settled particle layer. We are interested here in the behavior of the disk at a stage where has dropped to the ionization threshold . We have been considering disks whose upper layers are depleted in dust. But even a relatively small surface density in settled particles can suppress the MRI at g cm-2 if the particles are lofted high in the disk, followed by catastrophic fragmentation. This corresponds to , where is the size of the ‘dust’ fragments.
The settled particles orbit more slowly than the gas where the gas pressure decreases outward, and therefore drift inward toward the star. A surface density of settled particles at least comparable to the interstellar abundance can be sustained by inflow from the heaviest parts of the disk outside AU. We focus here on values of below the critical value where vertical shear in the orbital velocity induces a strong Kelvin-Helmholtz instability in the particle layer Sekiya (1998). Here at the midplane. Then the mean density of particles in the layer remains well below , and the inward drift speed of particles (of stopping time and Stokes parameter ) is (Goldreich & Ward, 1973; Weidenschilling, 1977).
The mass flow in particles that will sustain a given is
| (34) | |||||
The disk column is low enough that even macroscopic particles are in the Epstein drag regime; here . The radial drift speed of the particles is high when . It nonetheless remains below the fragmentation speed unless the particles grow beyond cm radius.
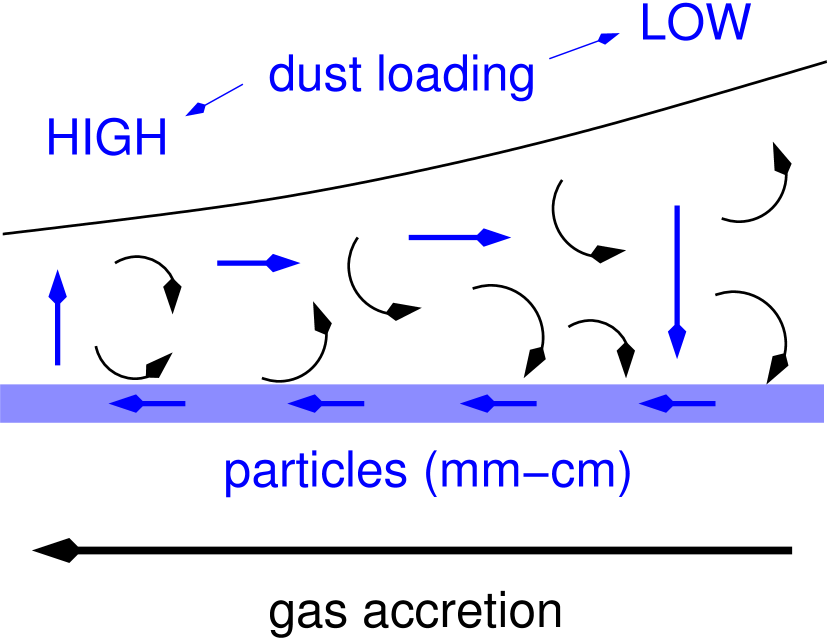
We find that is a strong decreasing function of radius in the MRI-active layer, when the dust abundance adjusts so as to sustain a steady inflow of gas through the inner disk. Then the inward drift of macroscopic particles is compensated by an outward diffusive flow of lofted dust grains, as depicted in Figure 9. The cycle can close within the disk when settled particles in the inner disk are lofted by turbulent gas eddies, and excess dust in the outer disk re-adheres into larger particles. We describe these processes in Section 5.2.
5.1. Equilibrium Surface Density Resulting from Particle Lofting and Midplane X-ray Ionization
The gas column that is maintained in the inner AU of an actively accreting PPD is the result of a competition between two effects: increased X-ray penetration to the midplane (which accelerates MRI-driven turbulence), and the lofting of solids from the midplane (which suppresses the turbulence). We note that the feedback of settled dust on the MRI has been considered by Jacquet & Balbus (2012), but without taking into account long-term secular changes in the gas column, or the effects of particle fragmentation.
At any depth in the disk, there is a critical dust loading above which the ionization level begins to be suppressed. Two effects are important here. First, an increase in the mass density of metals increases the X-ray opacity. This can reduce the ionization rate by an order of magnitude at g cm-2 when the dust abundance is restored to the solar value.
Second, as is reviewed in Section 4, the abundance of free electrons is suppressed by the charging up of grains, followed by the adsorption of positive metallic or molecular ions on grain surfaces (Equation (31)). In equilibrium we have , which gives
| (35) |
This expression holds when is much smaller than ; otherwise we revert to the expression corresponding to negligible adsorption.
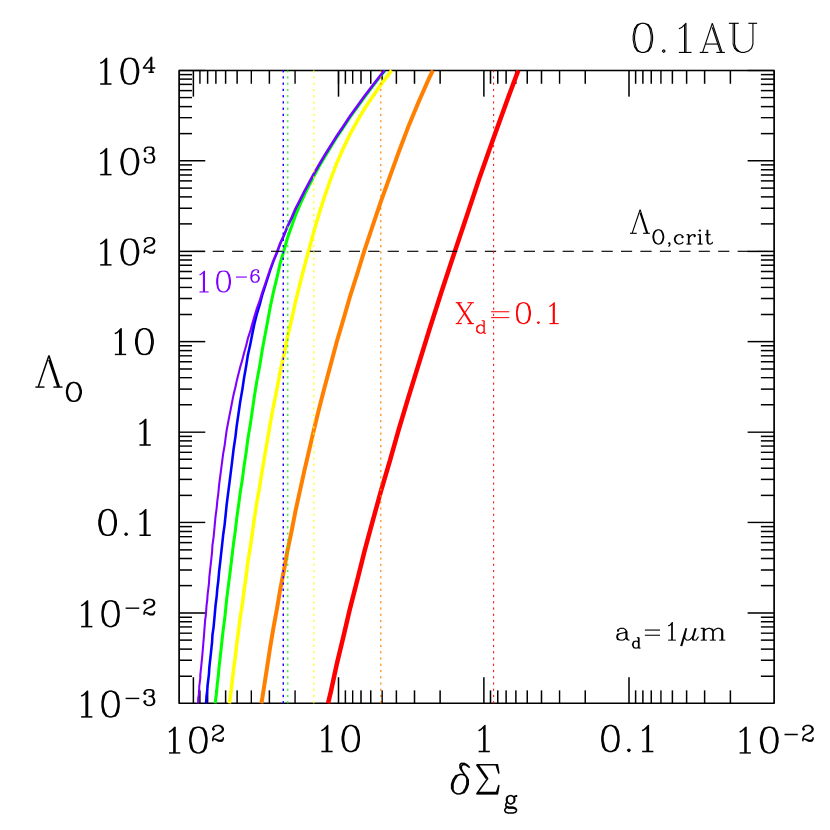
Thus an enhancement in the dust abundance forces a reduction in the active column , which is defined by setting the cutoff factors in Equation (10) to . The result is shown in Figure 10. The reduction in is driven mainly by enhanced Ohmic diffusion at low , and by ambipolar drift at high .
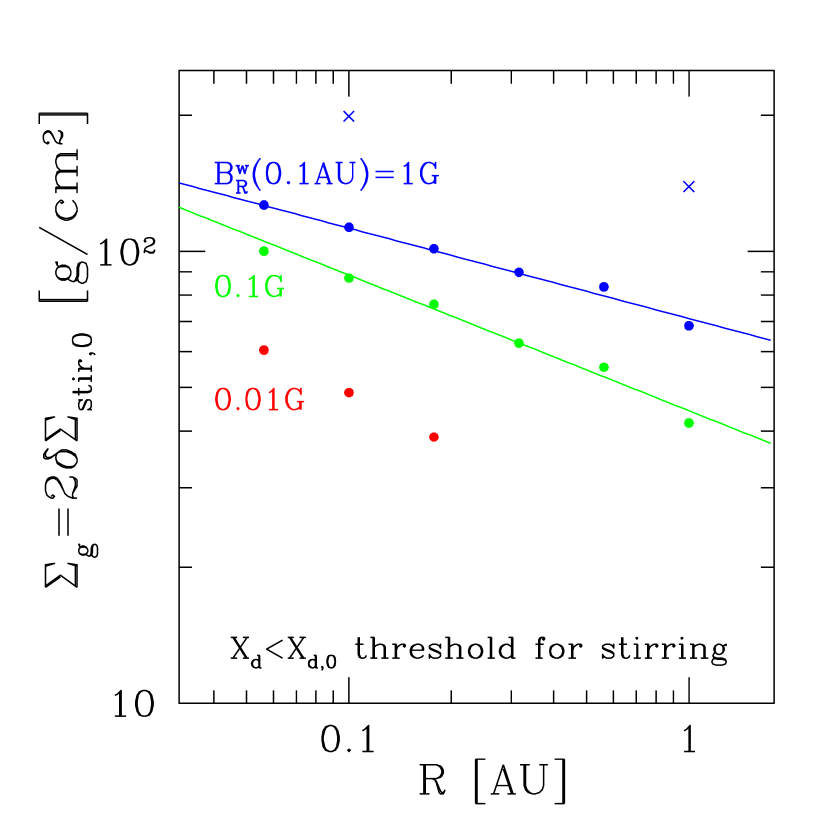
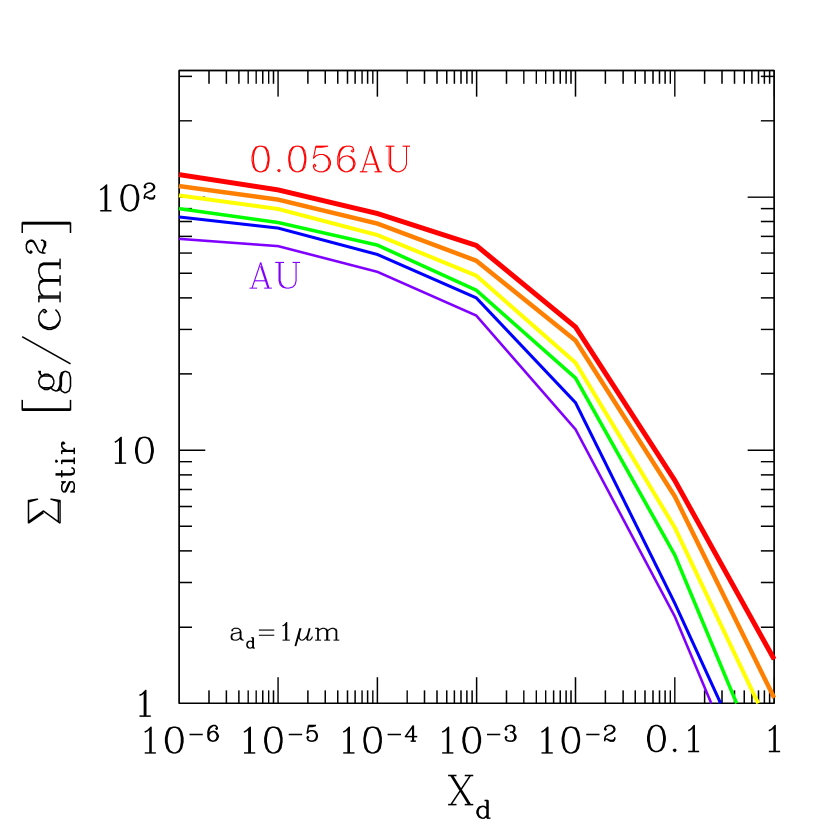
Below the layer of strong MRI activity lies a deeper and more weakly ionized zone, within which the turbulent motions are still fast enough to loft macroscopic particles from the midplane. We take for illustration a critical turbulent amplitude for particle lofting. The corresponding stirring column is plotted in the left panel of Figure 11 for a few values of the applied . This column is obtained from our dust-free vertical disk profiles. For the maximum field strength considered (), we find g cm-2. By way of comparison, the critical column for stirring is roughly three times larger than the total active column across the disk (Figure 2).
Adding a uniformly mixed population of small grains (we choose m) to the gas reduces the ionization level and both the active column and the stirring column . For each value of the grain mass fraction , one can work out the adjusted ionization profile and ionization level from Equation (35) and calculate the resulting ambipolar number . (Note that the form of the ambipolar number given by Equations (2.1) and (6) is modified when grains are the main charge carriers, but this occurs at columns greater than and so has very little effect for our purposes.) The adjustment in is greater at larger , and disappears below the column where . Here we take a short cut by maintaining the magnetic field profile ) of our zero-dust disk solutions, and then adjusting through Equation (6). This in turn gives the re-scaled ambipolar number and MRI diffusivity using Equation (10).
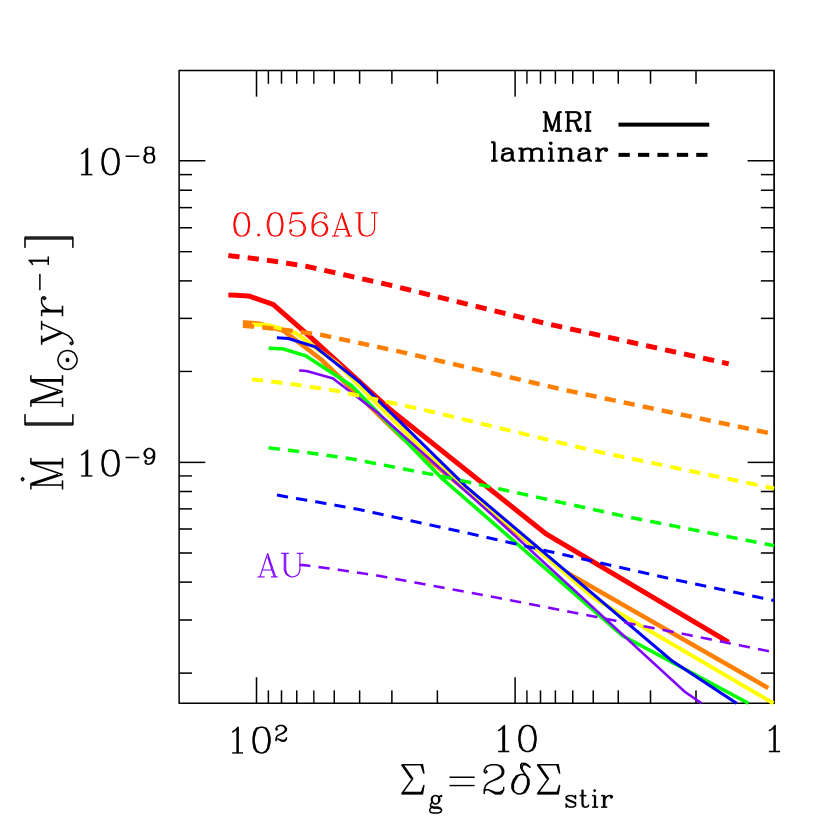
The last step is to calculate a vertically summed accretion rate from the truncated profile of MRI activity at finite ,
| (36) |
and
| (37) |
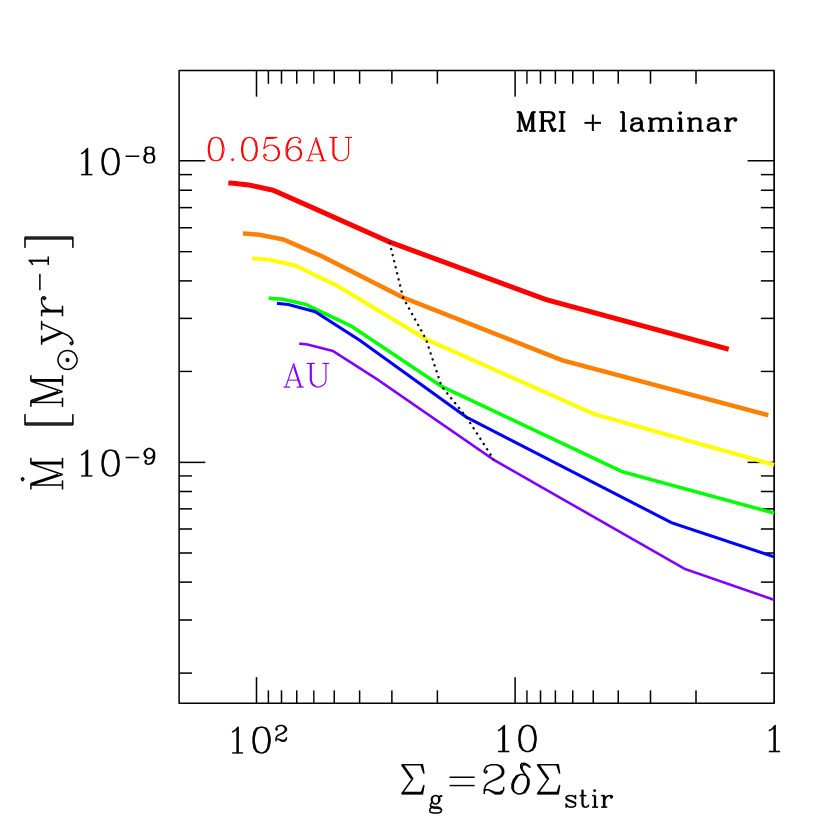
Figure 12 shows these quantities, together with the summed . We also obtain a vertically averaged viscosity coefficient , which is used in Section 8 to calculate the migration rates of planets within the disk.
In summary, we have obtained the mass transfer rate in a low-column disk where the ionization level is determined by a balance between (i) activation of the MRI near the midplane by X-ray ionization; and (ii) dust formation driven by the fragmentation of lofted particles. Analytic expressions for the separate contributions from turbulent and laminar Maxwell torques are
| (38) |
and
| (39) |
The surface density profile corresponding to steady accretion through the inner part of a PPD can be obtained by inverting . The radial dependence of is mainly determined by the radial variation of .
Maintaining a steady mass flow in the inner disk requires the dust loading to increase to sharply towards the star, reaching – inside AU. Although small grains are tightly bound to the gas, the strong negative implies outward transport of grains within the MRI-active layer. Therefore a partly closed cycle of solids is possible in the inner disk, as sketched in Figure 9.
The residency time of the solids depends on their rate of leakage through the inner boundary of the dust-loaded disk. This boundary cannot push inside the dust sublimation radius,
| (40) |
Closer to the star, where the ionization level returns to the dust-free case, the surface density must drop sharply, to the level plotted in Figure 7. The inward transport of lofted grains could be suppressed outside by the strong outward force imparted by the absorption of stellar optical light. The transport of settled particles depends on how how laminar the flow is near the inner boundary of the dust-loaded disk, an issue which is addressed in Section 7.
A higher loading of dust in the inner disk will raise the height of the optical absorption surface, thereby opening the possibility of disk self-shadowing. The absorption surfaces shown in Figure 8 are calculated for a uniform dust loading , and when cm-1 they coincide with nearly fixed multiples of the scale height. The finite size of the star reduces the shadowing effect of higher in the inner disk. We find that the value of that is implied by uniform accretion would produce enough absorption to block light from the stellar equator, but not from the poles. This partial self-shadowing would be further compensated by a modest reduction in gas scale height in response to the reduced irradiation of the inner disk. A self-consistent model of shadowing effects in a radially inhomogeneous and dust-loaded disk is beyond the scope of this paper.
5.2. Particle Lofting and Fragmentation, and Dust Settling
The accretion solutions obtained in Section 5.1 do not depend on the details of how macroscopic particles are lofted and fragment. Here we examine how an equilibrium concentration of small grains can be maintained by a competition between fragmentation and mutual grain sticking.
Even massive particles with can be advected upward from the upper edge of the particle layer by individual eddies of speed . When , this process only allows particles to reach a height above the midplane. But increases rapidly upward to a value , meaning that some particles will continue to diffuse away from the midplane, into a thin column222The stopping time when the particle size is smaller than the mean free path of H2 molecules. Hence .
| (41) |
below the disk surface. Here the vertical diffusion speed of a particle of radius drops below the vertical drift that is imposed by the disk gravity, .
A key point is that collisions between diffusing particles are delayed until their relative speed rises well above the fragmentation speed ( m s-1 for conglomerates of m-sized silicate grains). That is because the vertical diffusion time is shorter than the mean time between collisions. The relative velocity of particles of somewhat different sizes is comparable to their drift speed through the gas,333Here the velocity field is assumed to have a Kolmogorov spectrum on a scale .
The net abundance of small grains results from a balance between destructive collisions involving a large particle with a high drift speed, and low-velocity collisions between grains which lead to coagulation. The production of small grains is dominated by a ‘sandblasting’ effect: a high speed collision between a large particle and a grain will eject a multiple of the grain mass (Jacquet & Thompson, 2014). Then the mass density in grains is determined by
| (43) |
giving
| (44) |
Experiments suggest with (Housen et al., 1983; Holsapple, 1993).
This channel for dust production by stirred particles also allows for the removal of dust by the re-growth of particles, as we find is necessary to sustain a steady cycle of solids in the inner disk (Figure 9).
The upward flux of particles of mass can be written as
| (45) |
Given that collisions are slow compared with vertical diffusion, the gradient of the particle concentration is small. Then . The dust mass density varies with depth in the disk since it also depends on the particle drift speed through the yield (Equation (44)).
6. Evolution of the Inner Disk
We now consider the clearing of mass from a PPD. This process is largely completed over the first –10 Myr (Hernández et al., 2007), it appears by internal torques inside 1–2 AU, combined with a wind that is driven from the outer disk by the intense UV and X-ray flux from the protostar. A direct magnetorotational outflow from the disk surface is assumed to be suppressed by the pressure of the stellar wind, for the reasons outlined in Paper I. We also neglect turbulence that is driven by a purely hydrodynamical instability, e.g. vortices (Marcus et al., 2014).
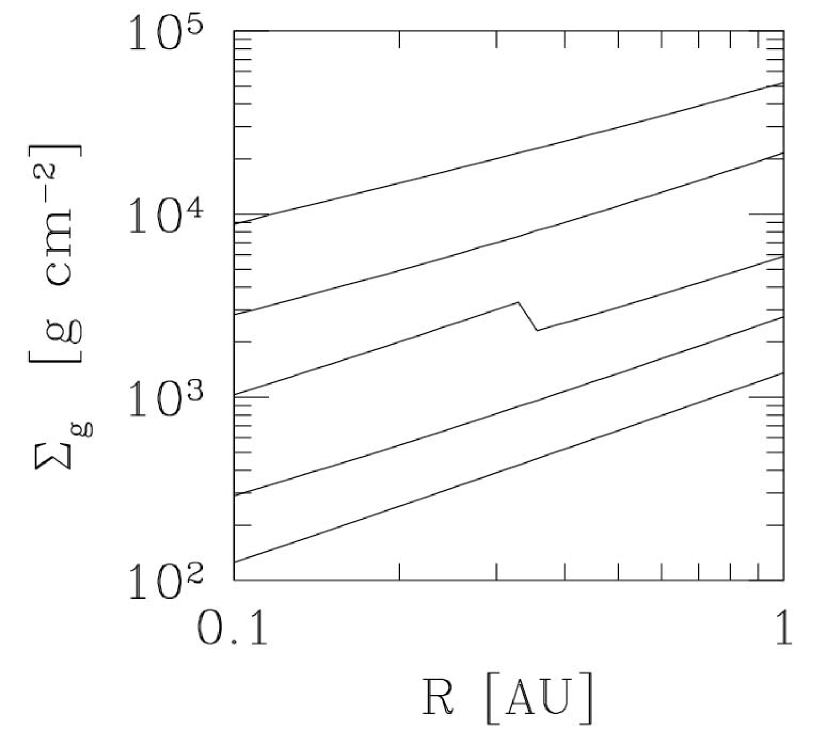
We first prescribe the initial surface density profile. Three initial conditions are considered: the immediate aftermath of a FU Ori-like outburst following the recondensation of silicates; the ‘minimum-mass solar nebula’ (MMSN, e.g. Hayashi 1981); and a flatter density profile with the same normalization at 2 AU as the MMSN. The first profile is derived in Appendix A:
| (46) |
Here is the Toomre (1964) parameter for (axisymmetric) gravitational stability of a thin Keplerian disk. The inner zone is stable by this criterion (), and the outer zone is marginally stable. In the second case,
| (47) |


The gas surface density is evolved according to
| (48) |
where includes contributions from MRI and the laminar Maxwell stress. The last term on the right is the ionization-driven wind from Owen et al. (2012), specifically for a PPD with yr-1. In the parts of the disk with , we use the power-law fit
| (49) |
from Figure 6. Here measures the gradient in the combined accretion rate . This fit is used beyond the maximum radius of 1 AU for which vertical disk profiles were constructed in Paper I, but close to this radius the ionization-driven wind begins to dominate.
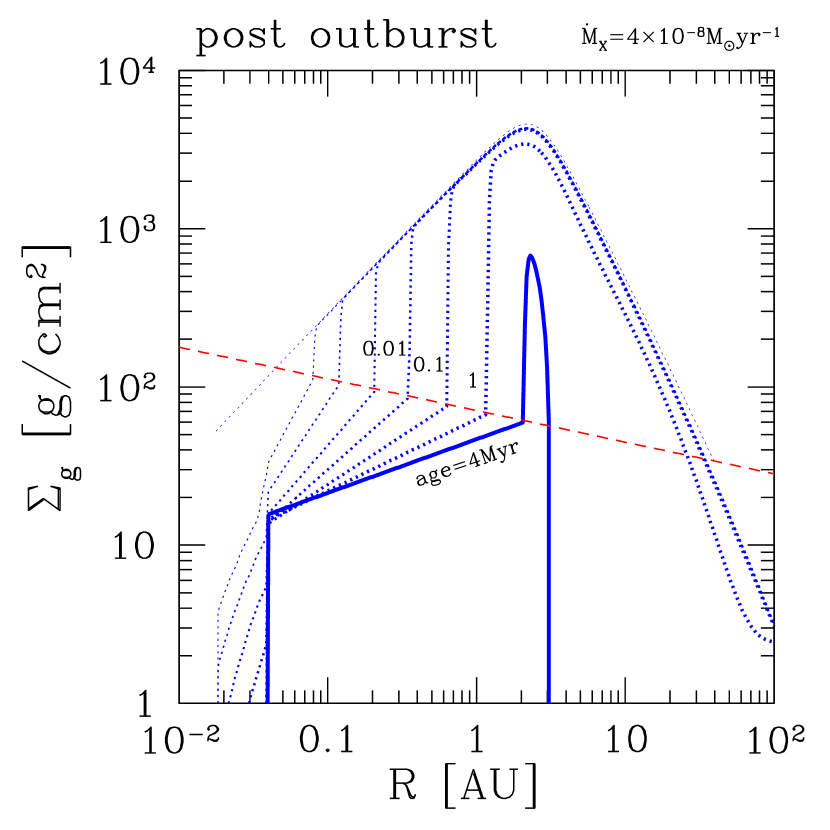
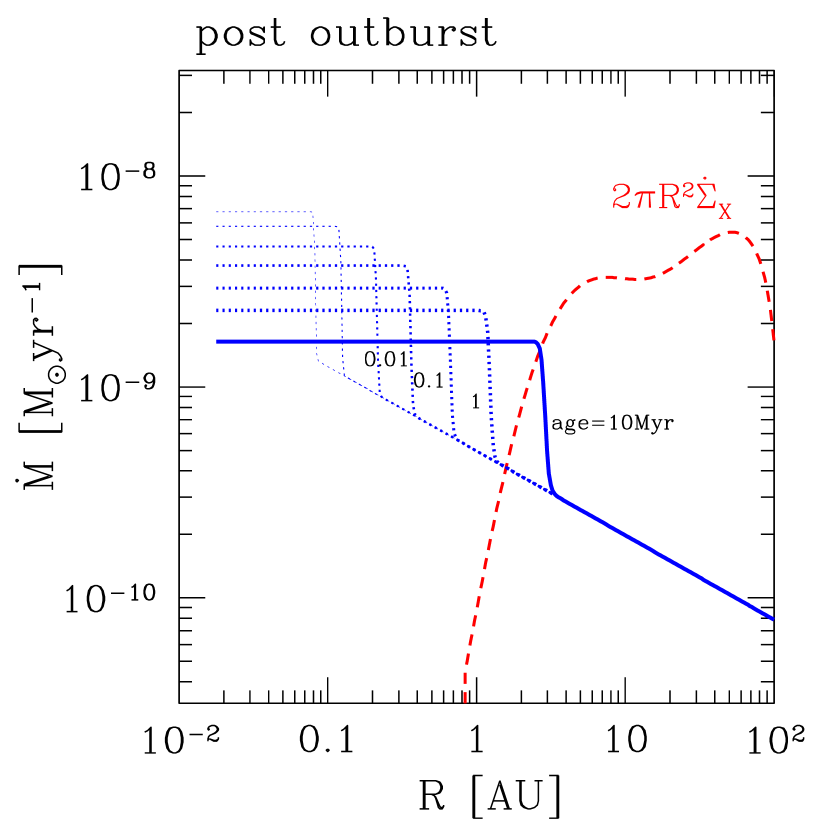
Key outputs of the calculation include: 1. The surface density inside AU, where Kepler has discovered many planets. This decreases with time given the radial profile (49) of . This behavior is in sharp contrast with a uniform- disk model, where increases with radius due to the disk flaring and increases with time from the initial state (6); see Zhu et al. (2009). 2. The outer radius of the ‘stirring’ region where the column has been reduced to (Figure 11) and the depletion of gas slows. This zone expands with time as gas is removed from the inner PPD. We recall from Section 4 that this depleted inner disk can maintain optical absorption surface, and at first will not appear as a transition disk. 3. The relative timing of the removal of the outer and inner disks, due to an ionization-driven wind and internal viscous stresses, respectively. We find that the outer disk is only modestly depleted after the inner disk reaches a surface density . Because the accretion time is very short inside radius (compared with the time to excavate the intermediate parts of the disk), we take to be uniform in the inner, depleted disk. Then a significant drop in accretion rate is sustained at , and a sharp outward radial gradient in forms there, associated with a local pressure maximum (Figure 13). We set the gradient scale of to near the pressure maximum. No significant changes in the disk evolution are noticeable for order unity adjustments of this value.
The outward progression of the radius can be accurately estimated from
| (50) |
Here is the accretion rate everywhere inside radius , and is given by Equation (49) at with . The accretion rate just outside is smaller by a factor .
The surface density profile interior to (and outside the sublimation radius (40)) is obtained as follows. The dust-loaded disk developed in Section 5 gives as a function of the accretion rate through the inner disk. Expressing in terms of , we find the steady-state column to be
| (51) |
at . The mild drop in with time seen in the inner disk in Figure 13 is thus a result of the decreasing mass flux sourced by material near .
The dust loading that is implied by Equation (51) varies strongly with radius. Figure 12 shows that the disk will sustain a given accretion rate at smaller with a lower , as a consequence of a higher dust loading. The accretion rate at is determined by the disk profile with vanishing dust loading. Moving inward toward the star, rapidly increases.
The changing value of the index in Equation (51) also deserves comment. At early times, only a small inner part of the disk has a column reduced to . We find that the mass flux close to the star is mainly driven by the laminar torque (see Figure 12). Since the laminar Maxwell stress decreases strongly with radius, a variation in is required to maintain a constant mass flux. As approaches 1 AU, MRI stresses begin to dominate. Since is nearly independent of radius at fixed , the surface density profile flattens out. Additional flattening of is caused by a weakening of the imposed radial field ( in Equation (25)), because the laminar stress scales more strongly with the applied field.
6.1. Details of Disk Evolution
Consider first the evolution of the disk from a post-FU Ori outburst configuration. Figure 13 shows that within Myr the inner disk is reduced to the stirring column out to AU. Over the same interval, the wind model of Owen et al. (2012) produces little clearing; this becomes significant only after Myr. Shortly after 9 Myr, a gap opens up outside 4 AU. The density bump inside it disappears in the next Myr, causing the inner disk to drain rapidly onto the star in My. The disk lifetime scales nearly inversely with the rate of mass loss due to photoevaporation, as is shown in the top right panel of Figure 13.
There is a slow decrease in the accretion rate onto the protostar as the dust-loaded inner disk expands (Figure 14): from yr-1 when sits at 0.06 AU, down to yr-1 as expands to AU.
The dust-free solution with very low is obtained inside AU, explaining the sharp upward rise in at that radius in Figure 13. This inner pressure bump may expand outward, depending on the particle flux through the midplane region into the inner disk.
A lower total mass must be dispersed when starting the evolution with the MMSN model, because the Toomre parameter is about 10 times larger than we choose in the ‘post-outburst’ disk model. (How the disk would reach such a state is not clear in the present context: angular momentum transport by spiral density waves would freeze out at lower , and so an additional source of torque would need to be invoked before the photoionized wind considered here would start.)
Clearing of the inner disk is initially a bit slower in this case, due to the inward-peaked surface density profile, but then picks up speed. Dispersal of the disk is completed within 2 Myr; this time is less sensitive to photoevaporative losses than in the post-outburst case since the density peaks at a smaller radius, where viscous evolution dominates photoevaporation.
The evolution of the flattest () initial profile is distinguished from the other two by the persistence of gas at 10–100 AU after gas at AU is largely removed. This is the same profile assumed in the models of Owen et al. (2012); not surprisingly, we also find that a distinct cavity develops around 2-3 AU. This case shows the greatest resemblance to transition disks, and the behavior of the ‘UV switch’ advanced by Clarke et al. (2001) to explain their relatively brief appearance.
7. Global Transport of Solid Material
Grains are supplied to the MRI-active layer of the inner disk through two channels: inward advection from a gas reservoir sitting outside AU; and a second, more indirect, channel involving the inward drift of macroscopic particles through the disk midplane, followed by lofting and catastrophic fragmentation.
We first consider the residual dust mass fraction when the turbulent motions at the disk midplane are too weak to loft particles. Then we consider the effect of a hydrodynamic instability, such as a baroclinic instability (Klahr & Bodenheimer, 2003), which may be excited near the outward-propagating density peak. Here a narrow annulus of the disk will be directly exposed to a higher stellar radiation energy flux, and will develop a strong radial temperature gradient.
We must first develop a working criterion for the lofting of particles. This depends on establishing a connection between the turbulent amplitude and particle size. Here we employ a simple model of a ‘bouncing barrier’ (Zsom et al., 2010), representing the maximum size of compact solid particles that have been compressed to a low porosity by repeated mutual collisions. Surface van der Waals forces facilitate the sticking of m-sized silicate monomers at relatively high collision speeds, up to m s-1. The critical speed for the sticking of larger, compact conglomerates (radius ) scales roughly as (Chokshi et al., 1993).
Particles with Stokes parameter move through the gas, and with respect to each other, with a small velocity m s-1. Balancing this with at a column , one obtains
| (52) |
(Here stopping is self-consistently in the Epstein regime.)
At the threshold for setting, , and one finds
| (53) | |||||
The parameter below which the particles settle corresponds to
| (54) | |||||
7.1. Residual Grain Abundance in a Layered Disk
First consider a layered disk in which attains a large value at the top of the disk, and drops rapidly at columns g cm-2. Then for silicate particles from Equation (54). Embedded particles diffuse vertically over a timescale . Even in the relatively quiescent settling layer (), this is faster than radial spreading through the turbulent upper disk, which occurs over the timescale . Solid particles are therefore nearly uniformly mixed down to the depth at which mutual sticking allows them to settle out.
We are interested here in the residual density of small grains, which are easily suspended by MRI turbulence. The preceding considerations show that their depletion from the gas is limited not by mixing, but by the rate of mutual collisions, which is highest for the smallest particles. It is easy to see that the largest contribution to the net collision rate (per unit area of disk) comes from the base of the layer where begins to drop sharply (Figure 3). The collision rate between grains of mass and space density is
| (55) |
Averaging vertically over the disk gives a characteristic collision time between small grains.
The formation of larger particles is suppressed if is longer than the time for radial inflow,
| (56) |
corresponding to a dust loading
Larger particles easily form when this condition is violated.
The main conclusion here is that the dust population in the MRI-active parts of the inner disk is regulated by settling in the outer disk that feeds it. After the lapse of Myr, a small fraction of the solids deposited initially at –2 AU will have swept through the inner disk, sustaining a population of m or sub-m sized grains.
7.2. Turbulent Transport Across Density Peak
Macroscopic particles near the outer edge of the depleted inner disk (radius ) experience a combination of turbulent diffusion and secular drift toward the pressure maximum. In the absence of turbulence, the particles settle toward the midplane and the pressure maximum presents a barrier to their inward radial migration (e.g. Kretke & Lin 2007). A narrow density peak may, however, be susceptible to a hydrodynamic (e.g. baroclinic) instability. Without understanding details of such an instability, we can still formulate the following question: if the turbulence excited is strong enough to smear the density peak to a radial lengthscale , will it also transport particles across the peak?
Here it is essential to remember that the peak moves outward at a speed . Hence turbulence of amplitude will smear the peak over a scale given by . The value of corresponding to a given value of is
| (58) |
Equation (54) indicates that his level of turbulence will suspend macroscopic particles at a gas column g cm-2, which is comparable to the column that is attained by our post-FU Ori disk model at AU.
We conclude that a hydrodynamic instability that smears the density peak will also facilitate the inward flow of settled particles into the inner disk. Indeed, the dust loading of the inner disk may easily exceed the level (7.1) that is left behind in a layered disk with a quiescent midplane layer.
8. Discussion
We have demonstrated that the inner –2 AU of a PPD will quickly evolve to a mass profile very different from the one that is obtained by assuming a uniform viscosity coefficient (or, indeed, as manifested in the popular MMSN disk model and its variant obtained from the Kepler planetary systems: Chiang & Laughlin 2013). Mass is removed from the inner disk as soon as a stellar wind flowing across its surface deposits a radial magnetic field into the upper layers of the disk. This radial field is wound up by the disk shear and then transported downward by a combination of turbulence and non-ideal MHD effects.
The vertical disk model so constructed in Paper I forms the basis for a constrained calculation of PPD evolution. The radial profile of the seed magnetic field is obtained directly from the profile of the imposed T-Tauri wind. We find that a depletion of mass from the inner disk is not sensitive to the details of how the MRI-generated stress depends on the seed (linearly wound) toroidal magnetic field. The rate of mass transfer through the disk depends only weakly on the normalization of this relation.
More standard MRI-based models (e.g. Gammie 1996; Zhu et al. 2009), which assume a vertical seed field, have the drawback that the flux distribution across the disk surface cannot yet be constrained in a useful way. The same limitation applies to models based on magnetorotational outflows from a vertically magnetized disk (Pudritz & Norman, 1986; Suzuki et al., 2010; Bai & Stone, 2013; Lesur et al., 2014; Gressel et al., 2015): these models also depend on an uncertain parameterization of the flux-to-mass ratio of the disk, and cannot yet be used to predict the sign of the change in mass in the inner part of a PPD.
Solid material in the inner disk is maintained by two sources: (i) small (m sized) grains which are transported by MRI turbulence faster than they can stick together to form macroscopic particles; and (ii) macroscopic (mm-cm sized) particles which settle to the quiescent midplane and drift inward by the usual headwind effect (Goldreich & Ward, 1973; Weidenschilling, 1977).
We showed that suspended grains can have a small influence on the ionization level even while forming an optical absorption layer above a height . The radial distribution of reprocessed stellar light is found to depend weakly on the mass fraction of dust grains in the MRI-active layer.
We also showed that the depletion of gas from the inner PPD is buffered by X-ray ionization of the midplane layer. Although this tends to activate the MRI, the lofting of macroscopic (mm-cm sized) particles from the disk midplane leads to catastrophic fragmentation higher in the disk, which loads the MRI-active layer with small grains. We found that steady accretion through the inner PPD can be sustained with a dust loading that varies with radius, but only over a finite range of . In this situation there is a strong inward gradient in , meaning that suspended dust diffuses outward from the protostar. In this way, it may be possible to sustain a closed cycle of solids inside AU even while gas continues to accrete through the inner disk.
A conspicuous feature of our disk solution is a strong maximum in surface density which moves outward as the inner disk clears. This may create a visible excess of infrared radiation at a particular radius, although not as strong a spectral feature as would a rim bounding a transparent inner zone.
This maximum in is also associated with a maximum in pressure, at which solid particles may collect. In contrast with the pressure bump associated with an ice sublimation surface (e.g. Kretke & Lin 2007), this feature scans through a wide range of radius. As such it is a possible site for the formation of planetesimals – although it should be kept in mind that settled particles will lag inside the pressure maximum as it moves outward. The gas near the bump is also susceptible to a hydrodynamic instability, especially a baroclinic instability, as a result of the strong radial temperature gradient that is generated by the raised disk profile (Klahr & Bodenheimer, 2003). As a result, the particles still experience differential orbital motion with respect to the gas, along with vertical stirring.
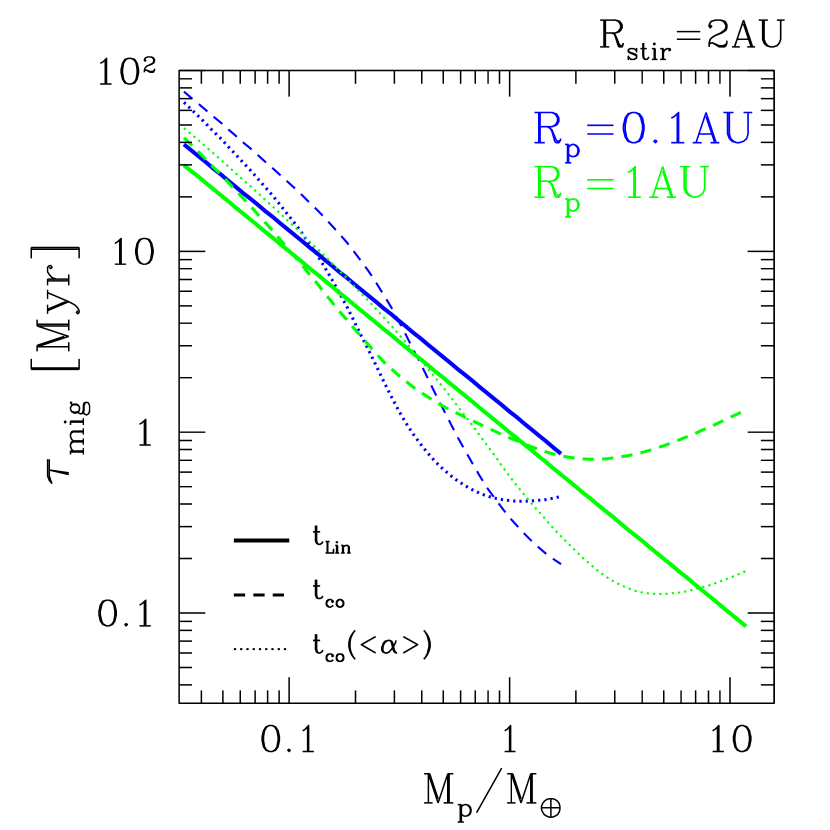
8.1. Planets below the Gap Opening Mass
The equilibrium gas column of the dust-loaded inner disk is in a range that allows the inward migration of both Earth-mass and Jupiter-mass planets on a Myr timescale. Figure 15 shows the migration time for planets smaller than the ‘Hill mass’, corresponding to , based on the formulae of (Paardekooper et al., 2011) and the surface density profile shown in Figure 13. The solid lines in this figure are obtained from the sum of the inner and outer Lindblad torques, and represent inward migration (Goldreich & Tremaine, 1980; Tanaka et al., 2002). The dashed and dotted lines show the summed effect of the linear and non-linear corotation torques, the latter imparted by gas executing horseshoe orbits in the corotation zone (Ward, 1991). The corotation torque is positive, meaning that the net torque is negative (inward migration) where the dashed (or dotted) line lies above the solid line. Migration is outward where the opposite inequality holds. For example, a planet would experience very slow migration at AU since positive and negative torques nearly cancel (with normalized to the disk half column) but would migrate outwards at AU due to a strong positive corotation torque.
The calculation includes the feedback of viscous and thermal diffusion on corotation torque saturation, again using formulae from Paardekooper et al. (2011). The disk viscosity has a strong vertical gradient (Figure 3), meaning that the upper disk can maintain an unsaturated corotation torque much more easily than the lower, quiescent disk. We evaluate the effect of the viscosity in two ways: first by adopting the value of the viscosity coefficient at the half-column point in the disk (dashed lines); alternatively by using the vertically (mass) averaged (dotted lines). With the first prescription, planets of mass – migrate inward at 1 AU, but migration stalls before the planet reaches 0.1 AU.
It should be emphasized that the magnitude of the corotation torque experienced by a planet below the gap-opening mass is sensitive to the dust loading of the gas in the co-orbital region. Repulsion of settled particles from the planet’s orbit (which requires a lower planet mass than does the repulsion of gas) would lead to a reduction in dust loading. Our flow solution with low has a much lower gas column (Figure 7) than does the solution in which is regulated by the lofting of dust (Figure 11). Therefore the formulae of Paardekooper et al. (2011) may overestimate the horseshoe torque in a PPD with settled particles. Figure 15 provides a reasonable estimate of the magnitude of the orbital torque, but not necessarily of its sign.
8.2. Jupiter-mass Planets
The inward migration of Jupiter-mass planets through our model disk is buffered by the cumulative transport of mass, because the planet mass . This migration regime was first studied by Syer & Clarke (1995); we adopt a migration rate as reported by Duffell et al. (2014) in a numerical for a Jupiter-mass planet in a PPD. The planet is started at the outer boundary of the dust-loaded inner disk and allowed to migrate inward without accreting. Figure 16 shows that over the final few Myr of disk dispersal, planets of mass – will migrate partly toward the protostar.
This result depends mainly on the accretion rate through the inner disk. Realistically, the planet will accrete part of the mass incident on its orbit (Lubow et al., 1999), but it is straightforward to show that this does not substantially change the result.
As the accretion rate drops, as it inevitably must as the outer parts of the PPD are removed, must transition to the much lower steady-state value shown in Section 3.4, corresponding to a radially magnetized disk in which the dust abundance is everywhere too small to perturb the ionization fraction. This represents a second stage of inside-out partial clearing, during which the inner disk may become transparent to optical photons. Once this happens, gas-mediated planetary migration must freeze out.
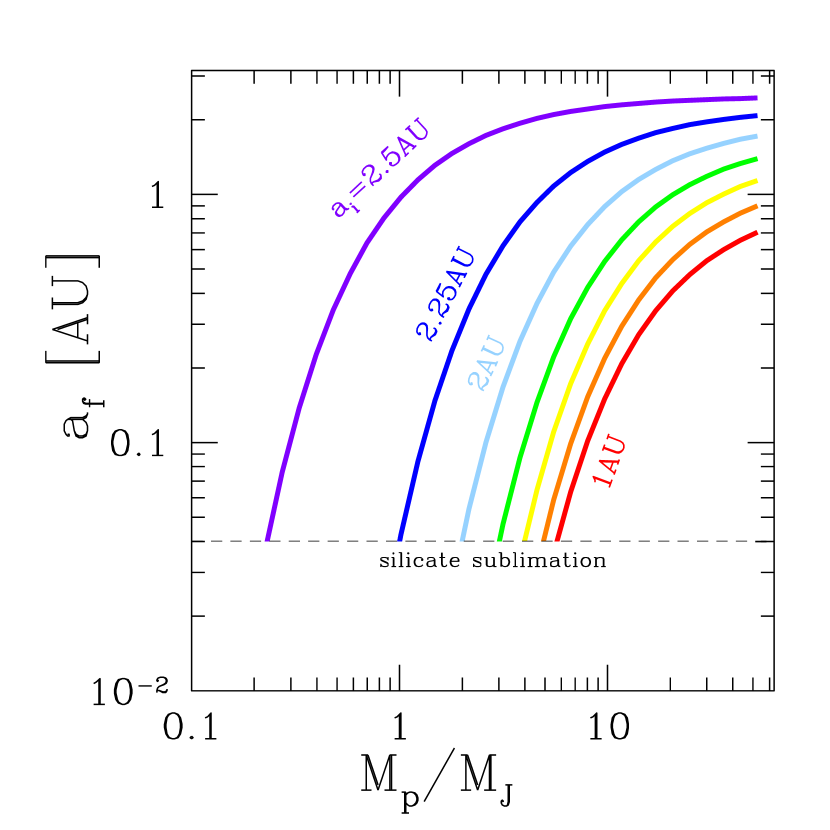
A transition to a much lower gas column will also occur at the radius AU where solid silicate material that is directly irradiated by the disk will be sublimated. As a result, our disk model predicts the formation of a planet trap at this radius, where even the migration of a Jupiter-mass planet will be stalled. The existence of a ‘pile-up’ of hot Jupiters at this radius is presently controversial, depending on an evaluation of how the orbits are sampled observationally (Winn & Fabrycky, 2015).
8.3. Transition Disks as a Probe of the Disk Mass Profile During Planet Formation
We have combined our mass transfer model for the disk inside AU with the photoionization-driven wind formulated by Owen et al. (2012). Considering a range of initial mass profiles (including a post-FU Ori outburst configuration, the MMSN profile, and a flatter initial profile), we find that the clearing of gas from inside 1–2 AU is insensitive to the initial profile. In most cases, gas generally persists at 1–2 AU after the dispersal of gas at 10–100 AU. The one exception to this is the flattest () profile, which contains relatively more mass at a large radius. By comparison, some PPDs show large cavities extending out to –30 AU (Williams & Cieza, 2011), suggesting that – at least in this subset of systems – the raw material for planet formation is concentrated in the outer part of a PPD.
Appendix A Post-FU Ori Disk Model
Most PPDs may undergo one or many outbursts of accretion in the early stages of their evolution, while the disk is still massive and self-gravity influences its dynamics. These have been named ‘FU Orionis outbursts’ after the first transient of this type to be discovered. An interesting feature of theoretical models of such outbursts (e.g. Zhu et al. 2009) is that the surface density profile inside AU departs significantly from the MMSN model. In fact, the surface density at AU can drop well below the corresponding value in the MMSN.
In time-dependent calculations which assume a layered disk with uniform , grows inside AU following an outburst. We show in Section 6 that the opposite behavior is encountered if the seed magnetic field in the inner disk is dominated by the stellar wind immediately following the outburst.
Two significant feedbacks contribute to the growth of the MRI during a FU Ori type outburst. First, the ionization level shoots up deep in the disk (at ) when the temperature is high enough (K) for silicate dust to sublimate. Then free electrons are no longer absorbed on the surfaces of grains, which are rapidly dispersed throughout the disk column following the catastrophic fragmentation of macroscopic particles high in the disk (Section 5). The second feedback occurs above several K as electronic transitions of H and scattering off H- contribute significantly to the opacity.
Our focus here is on the aftermath of a FU Ori outburst, and so we consider the profile of the disk when it transitions back to a dust-loaded state with strong MRI growth restricted to ionized surface layers (Gammie, 1996). To this end, we have constructed uniform- vertical disk models using the analytic fit to dust, molecular, atomic, free-free and bound-free opacity (collectively denoted by ) provided by Zhu et al. (2009).
Radiation transfer near the photosphere is handled using the Eddington approximation. The entire disk is assumed to be radiative, and convection is neglected. Hence the equations solved are
| (A1) |
The lower boundary condition at is , and the upper boundary conditions at large are ; . We do not explore here the origin of the seed field during the outburst, in particular the possibility that it is also derived from the stellar wind. Hence is simply taken to be independent of height.
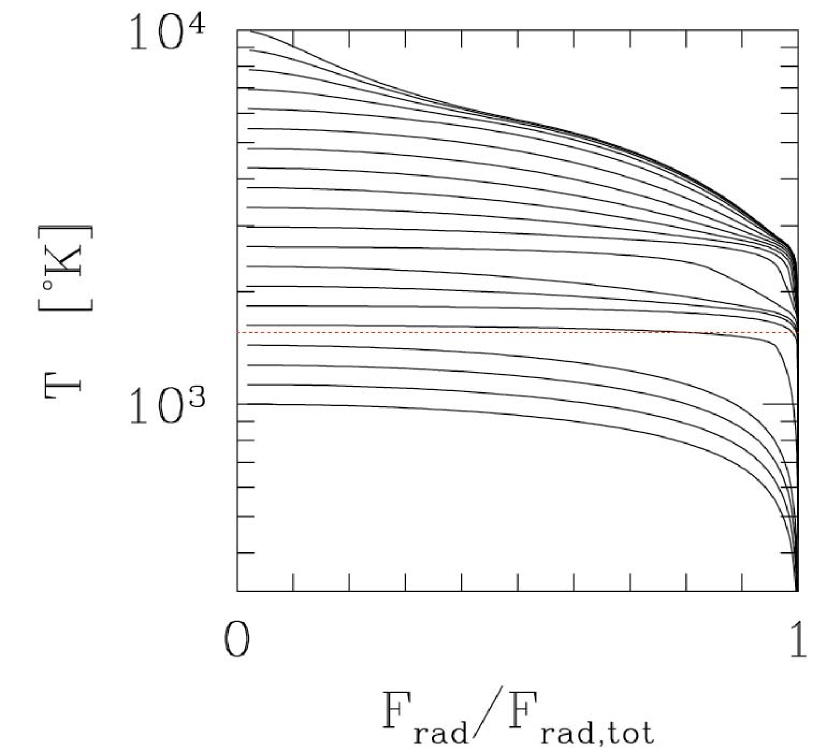
The solution to Equations (A) has the property that the upward radiative flux is generated in zones that are entirely above or below the sublimation temperature. Figure 17 shows a sequence of models of increasing midplane temperature ; the horizontal red dotted line denotes the sublimation temperature used in the opacity fit. Only for a narrow range of is there a significant contribution to the outgoing radiative flux from layers with and .
We identify the critical for which one-half of the outgoing radiative flux is generated at (or ), a plot it in Figure 18 as a function of for various values of . To initialize our post-FU Ori outburst calculation, we choose the curve corresponding to (Equation (6)). This disk solution implies gravitational instability beyond AU. To avoid that, we smoothly interpolate to a marginally gravitationally unstable disk with beyond AU.
The further evolution of in the inner disk is insensitive to the details of this initial profile. The chosen value of in the outer disk does influence whether this material can be entirely removed using the prescription of Owen et al. (2012) for a X-ray/FUV-driven wind: that happens for but not for .
References
- Bai (2014) Bai, X.-N. 2014, ApJ, 791, 137
- Bai & Goodman (2009) Bai, X.-N., & Goodman, J. 2009, ApJ, 701, 737
- Bai & Stone (2011) Bai, X.-N., & Stone, J. M. 2011, ApJ, 736, 144
- Bai & Stone (2013) Bai, X.-N., & Stone, J. M. 2013, ApJ, 769, 76
- Blaes & Balbus (1994) Blaes, O. M., & Balbus, S. A. 1994, ApJ, 421, 163
- Calvet (1997) Calvet, N. 1997, Herbig-Haro Flows and the Birth of Stars, 182, 417
- Chambers et al. (1996) Chambers, J. E., Wetherill, G. W., & Boss, A. P. 1996, Icarus, 119, 261
- Chiang & Goldreich (1997) Chiang, E. I., & Goldreich, P. 1997, ApJ, 490, 368
- Chiang et al. (2001) Chiang, E. I., Joung, M. K., Creech-Eakman, M. J., et al. 2001, ApJ, 547, 1077
- Chiang & Youdin (2010) Chiang, E., & Youdin, A. N. 2010, Annual Review of Earth and Planetary Sciences, 38, 493
- Chiang & Laughlin (2013) Chiang, E., & Laughlin, G. 2013, MNRAS, 431, 3444
- Chokshi et al. (1993) Chokshi, A., Tielens, A. G. G. M., & Hollenbach, D. 1993, ApJ, 407, 806
- Clarke et al. (2001) Clarke, C. J., Gendrin, A., & Sotomayor, M. 2001, MNRAS, 328, 485
- D’Alessio et al. (1998) D’Alessio, P., Cantö, J., Calvet, N., & Lizano, S. 1998, ApJ, 500, 411
- D’Alessio et al. (1999) D’Alessio, P., Calvet, N., Hartmann, L., Lizano, S., & Cantó, J. 1999, ApJ, 527, 893
- D’Alessio et al. (2006) D’Alessio, P., Calvet, N., Hartmann, L., Franco-Hernández, R., & Servín, H. 2006, ApJ, 638, 314
- Duffell et al. (2014) Duffell, P. C., Haiman, Z., MacFadyen, A. I., D’Orazio, D. J., & Farris, B. D. 2014, ApJ, 792, LL10
- Flock et al. (2012) Flock, M., Henning, T., & Klahr, H. 2012, ApJ, 761, 95
- Fromang & Stone (2009) Fromang, S., & Stone, J. M. 2009, A&A, 507, 19
- Funk et al. (2010) Funk, B., Wuchterl, G., Schwarz, R., Pilat-Lohinger, E., & Eggl, S. 2010, A&A, 516, A82
- Furlan et al. (2006) Furlan, E., Hartmann, L., Calvet, N., et al. 2006, ApJS, 165, 568
- Gammie (1996) Gammie, C. F. 1996, ApJ, 457, 355
- Goldreich & Ward (1973) Goldreich, P., & Ward, W. R. 1973, ApJ, 183, 1051
- Goldreich & Tremaine (1980) Goldreich, P., & Tremaine, S. 1980, ApJ, 241, 425
- Gressel et al. (2015) Gressel, O., Turner, N. J., Nelson, R. P., & McNally, C. P. 2015, ApJ, 801, 84
- Guan & Gammie (2009) Guan, X., & Gammie, C. F. 2009, ApJ, 697, 1901
- Hawley et al. (1995) Hawley, J. F., Gammie, C. F., & Balbus, S. A. 1995, ApJ, 440, 742
- Hayashi (1981) Hayashi, C. 1981, Progress of Theoretical Physics Supplement, 70, 35
- Hernández et al. (2007) Hernández, J., Hartmann, L., Megeath, T., et al. 2007, ApJ, 662,1067
- Holsapple (1993) Holsapple, K. A., Annu. Rev. Earth Planet. Sci., 21, 333
- Housen et al. (1983) Housen, K. R., Schmidt, R. M., & Holsapple, K. A. 1983, J. Geophys. Res., 88 2485
- Igea & Glassgold (1999) Igea, J., & Glassgold, A. E. 1999, ApJ, 518, 848
- Ilgner & Nelson (2006) Ilgner, M., & Nelson, R. P. 2006, A&A, 445, 205
- Jacquet & Balbus (2012) Jacquet, E., & Balbus, S. 2012, MNRAS, 423, 437
- Jacquet & Thompson (2014) Jacquet, E., & Thompson, C. 2014, ApJ, 797, 30
- Klahr & Bodenheimer (2003) Klahr, H. H., & Bodenheimer, P. 2003, ApJ, 582, 869
- Kretke & Lin (2007) Kretke, K. A., & Lin, D. N. C. 2007, ApJ, 664, L55
- Lesur & Longaretti (2009) Lesur, G., & Longaretti, P.-Y. 2009, A&A, 504, 309
- Lesur et al. (2014) Lesur, G., Kunz, M. W., & Fromang, S. 2014, A&A, 566, AA56
- Lissauer et al. (2014) Lissauer, J. J., Dawson, R. I., & Tremaine, S. 2014, Nature, 513, 336
- Lubow et al. (1999) Lubow, S. H., Seibert, M., & Artymowicz, P. 1999, ApJ, 526, 1001
- Marcus et al. (2014) Marcus, P., Pei, S., Jiang, C.-H., et al. 2014, arXiv:1410.8143
- Matt & Pudritz (2005) Matt, S., & Pudritz, R. E. 2005, ApJ, 632, L135
- Menou & Goodman (2004) Menou, K., & Goodman, J. 2004, ApJ, 606, 520
- Mohanty et al. (2013) Mohanty, S., Ercolano, B., & Turner, N. J. 2013, ApJ, 764, 65
- Newcomb (1961) Newcomb, W. A. 1961, Physics of Fluids, 4, 391
- Ogihara et al. (2015) Ogihara, M., Morbidelli, A., & Guillot, T. 2015, A&A, 578, A36
- Okuzumi & Hirose (2011) Okuzumi, S., & Hirose, S. 2011, ApJ, 742, 65
- Owen et al. (2012) Owen, J. E., Clarke, C. J., & Ercolano, B. 2012, MNRAS, 422, 1880
- Lynden-Bell & Pringle (1974) Lynden-Bell, D., & Pringle, J. E. 1974, MNRAS, 168, 603
- Paardekooper et al. (2011) Paardekooper, S.-J., Baruteau, C., & Kley, W. 2011, MNRAS, 410, 293
- Pudritz & Norman (1986) Pudritz, R. E., & Norman, C. A. 1986, ApJ, 301, 571
- Russo & Thompson (2015) Russo, M., & Thompson, C. 2015, ApJ, in press
- Sano & Stone (2002) Sano, T., & Stone, J. M. 2002, ApJ, 577, 534
- Sekiya (1998) Sekiya, M. 1998, Icarus, 133, 298
- Simon & Hawley (2009) Simon, J. B., & Hawley, J. F. 2009, ApJ, 707, 833
- Smith & Lissauer (2009) Smith, A. W., & Lissauer, J. J. 2009, Icarus, 201, 381
- Strom et al. (1989) Strom, K. M., Strom, S. E., Edwards, S., Cabrit, S., & Skrutskie, M. F. 1989, AJ, 97, 1451
- Suzuki et al. (2010) Suzuki, T. K., Muto, T., & Inutsuka, S.-i. 2010, ApJ, 718, 1289
- Syer & Clarke (1995) Syer, D., & Clarke, C. J. 1995, MNRAS, 277, 758
- Tanaka et al. (2002) Tanaka, H., Takeuchi, T., & Ward, W. R. 2002, ApJ, 565, 1257
- Toomre (1964) Toomre, A. 1964, ApJ, 139, 1217
- Turner & Sano (2008) Turner, N. J., & Sano, T. 2008, ApJ, 679, L131
- Ward (1991) Ward, W. R. 1991, Lunar and Planetary Science Conference, 22, 1463
- Wardle & Salmeron (2012) Wardle, M., & Salmeron, R. 2012, MNRAS, 422, 2737
- Weidenschilling (1977) Weidenschilling, S. J. 1977, MNRAS, 180, 57
- Williams & Cieza (2011) Williams, J. P., & Cieza, L. A. 2011, ARA&A, 49, 67
- Winn & Fabrycky (2015) Winn, J. N., & Fabrycky, D. C. 2015, Annu. Rev. Astron. Astrophys., 53, 409
- Zhu et al. (2009) Zhu, Z., Hartmann, L., & Gammie, C. 2009, ApJ, 694, 1045
- Zsom et al. (2010) Zsom, A., Ormel, C. W., Güttler, C., Blum, J., & Dullemond, C. P. 2010, A&A, 513, A57