Pathway Tools version 24.0: Integrated Software for Pathway/Genome Informatics and Systems Biology
Abstract
Pathway Tools is a bioinformatics software environment with a broad set of capabilities. The software provides genome-informatics tools such as a genome browser, sequence alignments, a genome-variant analyzer, and comparative-genomics operations. It offers metabolic-informatics tools, such as metabolic reconstruction, quantitative metabolic modeling, prediction of reaction atom mappings, and metabolic route search. Pathway Tools also provides regulatory-informatics tools, such as the ability to represent and visualize a wide range of regulatory interactions. The software creates and manages a type of organism-specific database called a Pathway/Genome Database (PGDB), which the software enables database curators to interactively edit. It supports web publishing of PGDBs and provides a large number of query, visualization, and omics-data analysis tools. Scientists around the world have created more than 35,000 PGDBs by using Pathway Tools, many of which are curated databases for important model organisms. Those PGDBs can be exchanged using a peer-to-peer database-sharing system called the PGDB Registry.
Biographical Note
Dr. Peter Karp is the Director of the Bioinformatics Research Group at SRI International. He received the PhD degree in Computer Science from Stanford University.
1 Introduction
Pathway Tools [88, 123, 87, 75] is a software environment for management, analysis, simulation, and visualization of integrated collections of genome, pathway, and regulatory data. This article provides an overview of all current capabilities of Pathway Tools; previous such overview publications were [88, 82]. A shorter version of this article describes recent enhancements to Pathway Tools [84]. New software capabilities developed since the previous (2019) version of this article are typeset in blue in this article.111This article incorporates significant text from [85, 84, 81, 88] by permission of the publisher.
Pathway Tools handles many types of information beyond pathways and offers extensive capabilities. The software has been under continuous development within the Bioinformatics Research Group (BRG) within SRI International since the early 1990s. Pathway Tools serves several different use cases in bioinformatics and systems biology:
-
•
It supports development of organism-specific databases (also called model-organism databases) that integrate many bioinformatics data types.
-
•
It supports scientific visualization, web publishing, and dissemination of those organism-specific databases.
-
•
It performs computational inferences from sequenced genomes including prediction of an organism’s metabolic network, prediction of metabolic pathway hole fillers, and prediction of operons.
-
•
It enables creation of steady-state quantitative metabolic flux models for individual organisms and for organism communities.
-
•
It provides tools for graph-based analysis of biological networks, such as for identification of metabolic choke points, dead-end metabolites, and blocked reactions.
-
•
It provides tools for analysis of gene expression, metabolomics, proteomics, and multi-omics data sets.
-
•
It provides comparative analyses of organism-specific databases.
-
•
It supports metabolic engineering.
Pathway Tools is focused around a type of model-organism database called a Pathway/Genome Database (PGDB). A PGDB integrates information about an organism’s genes, proteins, metabolic network, and regulatory network.
Pathway Tools has several components. The PathoLogic component enables users to create a new PGDB from the annotated genome of an organism, containing the genes, proteins, biochemical reactions, and predicted metabolic pathways and operons of the organism.
The Pathway/Genome Editors let PGDB developers interactively refine the contents of a PGDB, such as editing a metabolic pathway or an operon, or defining the function of a newly characterized gene.
The Pathway/Genome Navigator supports querying, visualization, and analysis of PGDBs. Whereas all other Pathway Tools components run as desktop applications only, the Navigator can run as both a desktop application and as a web server. The Navigator enables scientists to quickly find information, to display that information in familiar graphical forms, and to publish a PGDB to the scientific community via the web. The Navigator provides a platform for systems-level analysis of high-throughput data by providing tools for painting combinations of gene expression, protein expression, and metabolomics data onto a full metabolic map of the cell, onto the full genome, and onto a diagram of the regulatory network of the cell.
The MetaFlux component enables construction and execution of steady-state metabolic flux models from PGDBs. MetaFlux has modes to accelerate development of metabolic models, and to use metabolic models to simulate both gene and reaction knockouts. Pathway Tools provides a unique environment for metabolic flux modeling: by combining a tool for reconstructing metabolic networks from genome annotations with metabolic-model debugging tools such as a reaction gap-filler, the software enables rapid development of metabolic models from sequenced genomes. And by tightly coupling the metabolic model with other enriching information such as the sequenced genome, chemical structures, and regulatory information, Pathway Tools-based metabolic models are easier to understand, validate, reuse, extend, and learn from.
Pathway Tools includes a sophisticated ontology and database application programming interface (API) that enables programs to perform complex queries, symbolic computations, and data mining on the contents of a PGDB. For example, the software has been used for global studies of the E. coli metabolic network [114] and genetic network [77].
Pathway Tools is seeing widespread use across the bioinformatics community to create Pathway/Genome Databases in all domains of life. More than 11,100 groups to date have licensed the software. As well as supporting the development of the EcoCyc [90] and MetaCyc [25] databases (DBs) at SRI, and SRI’s BioCyc collection of 18,000 PGDBs [78], the software is used by genome centers, experimental biologists, and groups that are creating curated DBs for a number of different organisms (see Section 12 for a more detailed listing of available PGDBs).
This article provides a comprehensive description of Pathway Tools. Where possible, it references earlier publications that provide more algorithmic details. However, in some cases, those earlier publications are outdated by new developments in the software that are described here. This article also emphasizes new aspects of the software that have not been reported in earlier publications.
The organization of this article is as follows.
-
•
Section 2: Use cases for which Pathway Tools was designed
-
•
Section 3: PGDB creation, Pathway Tools computational inferences, interactive editing, associated author-crediting system, tools for automatic upgrading of a PGDB schema and for bulk updating of a PGDB genome annotation
-
•
Section 4: PGDB schema and ontologies
-
•
Section 5: Search and visualization facilities
-
•
Section 6: Omics data analysis
-
•
Section 7: Mechanisms for importing and exporting data from Pathway Tools, and for accessing and updating PGDB data via APIs
-
•
Section 8 Pathway Tools modules for network analyses of PGDBs, such as for identifying dead-end metabolites
-
•
Section 9: Comparative analysis tools
-
•
Section 10: Software architecture of Pathway Tools
-
•
Section 11: Metabolic modeling capabilities
-
•
Section 12 PGDBs that have been created by Pathway Tools users outside SRI International; describes a peer-to-peer data-sharing facility within Pathway Tools that enables users to easily exchange PGDBs
-
•
Section 13: Compares Pathway Tools to related efforts
Supplemental Figures are available at [155].
2 Pathway Tools Use Cases
This section articulates the objectives for which Pathway Tools was designed. Please note that when we assert that Pathway Tools supports a given type of use case, it does not mean that Pathway Tools provides every type of computational tool needed in that area. For example, omics data analysis is a huge field, and although Pathway Tools contributes novel and useful omics data analysis capabilities, it does not provide every omics data analysis method: in fact, it is intended to be used in conjunction with other omics analysis tools (such as for data normalization). Section 14 summarizes the limitations of Pathway Tools.
2.1 Development of Organism-Specific Databases
Organism-specific DBs (also known as model-organism DBs) describe the genome and other information about an organism [91, 34, 9, 64, 47]. We posit that every organism with a completely sequenced genome and an experimental community of significant size requires an organism-specific DB to fully exploit the genome sequence. Such DBs should provide a central information resource that integrates information dispersed through the scientific literature about the genome, molecular parts, and cellular networks of the organism. Such DBs both direct and accelerate further scientific investigations.
Pathway Tools facilitates rapid initial computational construction of organism-specific DBs, followed by manual refinement of the PGDB, to produce an extremely rich and accurate DB in minimal time. Our approach differentiates experimental versus computationally inferred information whenever possible. Rapid construction of PGDBs is achieved by importing an annotated genome into a PGDB in the form of a GenBank or GFF file, and by applying several computational inference tools to infer new information within the PGDB, such as metabolic pathways. Scientists can then employ the Pathway/Genome Editors to correct and supplement computational inferences when necessary, and to perform ongoing manual curation of the PGDB if desired.
The Pathway Tools DB schema (see Section 4) is significant in both its breadth and its depth: it models an unusually broad set of bioinformatics data types ranging from genomes to pathways to regulatory networks, and it provides high-fidelity representations of those data types that allow PGDBs to accurately capture complex biology.
2.2 Web Visualization and Querying of Organism-Specific Databases
To speed user comprehension of the complex information within PGDBs, the Pathway/Genome Navigator provides many scientific visualization services, including a genome browser, visualization of single metabolic pathways and entire metabolic maps, visualization of single operons and of entire regulatory networks, and visualization of chemical compounds and reactions (see Section 5 for more details).
These visualizations are generated programmatically for each PGDB and are also available on the desktop as well as the web. Hence, all developers of PGDBs get the same high-quality visualization tools available for their PGDBs. Additionally, for all but the Regulatory Overview, the graphics on the web are rendered using a protocol we call “web graphics”. A browser-based engine renders “web graphics” using HTML5 canvas technology, enabling high-resolution, zoom-able graphics on all web-browsers. These improvements are only for rendering, our core, rapid, and robust layout algorithms remain in place.
These visualization tools operate within a web server, permitting developers of PGDBs to publish their PGDBs to the scientific community through a website. This form of PGDB publishing supports interactive querying and browsing using a three-tiered series of web query interfaces (see Section 5.1), including a quick search, a set of object-specific query tools, and a tool for interactively constructing queries whose power is comparable to that of SQL.
We have developed other publishing paradigms to support computational analysis and dissemination of PGDBs. Pathway Tools APIs exist in four languages [97] and as web services. PGDBs can be exported in several formats and imported into the BioWarehouse DB integration system [103]. Finally, users can easily share and exchange PGDBs using a peer-to-peer DB-sharing system that we have developed.
2.3 Extend Genome Annotations with Additional Computational Inferences
Pathway Tools extends the paradigm of genome analysis. After traditional analyses such as gene calling and gene function prediction are performed by external software packages, Pathway Tools provides additional computational genome analyses that layer additional information above the traditional genome annotation. Pathway Tools predicts the operons of the organism. It predicts the metabolic pathways of the organism. It also predicts which genes in the organism code for missing enzymes in the predicted metabolic pathways, thus using pathway information to predict additional gene functions. See Section 3 for more details.
2.4 Analysis of Omics Data
Pathway Tools provides a variety of tools for visualization and analysis of omics data sets, including the Omics Dashboard [124] and three genome-scale viewers for animated visualization of omics data sets in the context of the full metabolic network [123], full transcriptional regulatory network, and full genome. It also provides enrichment analysis and SmartTable-based analysis of omics data, as well as several pathway-based tools. See Section 6 for more details.
2.5 Quantitative Metabolic Flux Modeling
The MetaFlux module of Pathway Tools supports development and execution of steady-state metabolic flux models for individual organisms and organism communities from PGDBs. MetaFlux supports a literate modeling approach that makes metabolic flux models highly accessible to and understandable by scientists.
2.6 Analysis of Biological Networks
Pathway Tools includes programs for symbolic analysis of biological networks (see Section 8 for more details) that rely on the detailed biological network ontology underlying Pathway Tools. The software identifies dead-end metabolites and blocked reactions, both of which usually reflect errors or incompleteness of our knowledge of a metabolic network.
Pathway Tools indirectly supports a two-phased, pathway-based paradigm for drug discovery. Phase I is the search for essential in vivo metabolic pathways: pathways whose function is essential for microbial growth in the host. Phase II is the search for targets within essential in vivo pathways. Both phases are supported by a Pathway Tools module that predicts choke-point reactions within the metabolic network as likely drug targets [171].
2.7 Comparative Analyses of Organism-Specific Databases
Pathway Tools provides a suite of comparative analysis operations that can be applied to multiple user-selected PGDBs (see Section 9 for more details). Pathway Tools emphasizes comparisons at the functional level, rather than the sequence level. Example comparisons include (1) highlighting on the Cellular Overview of one organism the reactions that it shares (or does not share) with one or more other organisms; (2) a tabular comparison of the reaction complements of several organisms, organized by substrate type (e.g., small molecules, RNAs, proteins) or by the number of isozymes per reaction; (3) a comparison of the pathway complements of several organisms, where the tabular pathway comparison is organized by a pathway ontology; (4) a table showing which genes have orthologs in which PGDBs; and (5) a comparison of the genome organization of orthologs using the genome browser.
2.8 Metabolic Engineering
Metabolic engineering is a discipline that seeks to modify the metabolic network of an organism in a desired fashion, such as to achieve overproduction of desired end products, or degradation of specified compounds [153]. Pathway Tools is designed to assist metabolic engineers in several respects. Its metabolic-reconstruction capabilities aid in rapid characterization of a host organism for metabolic engineering. Its editing tools permit refinement of that pathway database. Its omics analysis capabilities aid metabolic engineers in understanding the activity levels of different portions of the metabolic network under different growth conditions. Its RouteSearch tool supports design of novel reaction pathways from a feedstock compound to a desired product compound, and its metabolic modeling capabilities enable computational exploration of modified flux routes.
3 Creating and Curating a PGDB
The life cycle of a PGDB typically includes the following three procedures.
1. Initial creation of the PGDB starts with one or more input files describing the functionally annotated genome of an organism. The PathoLogic component of Pathway Tools transforms the genome into an Ocelot [79] DB structured according to the Pathway Tools schema. Next, the user applies one or more computational inference tools within PathoLogic to the genome to infer new information such as metabolic pathways. For several of the PathoLogic inference tools, we have created graphical user interfaces (GUIs) that enable the user to review the inferences made by these tools, and to accept, reject, or modify those inferences.
2. PGDB curation. Manual refinement and updating of a PGDB is performed using the Pathway/Genome Editors. This phase can last for years, or for decades, as in the case of EcoCyc [91]. Curation can be based on information found about the organism in the experimental literature, information from in-house experiments, or information inferred by the curator, perhaps with help from computational tools. PGDB curation is multidimensional, involving addition and/or deletion of genes or metabolic pathways to/from the PGDB; changing gene functions; altering the structure of metabolic pathways; authoring of summary comments for genes or pathways; attachment of Gene Ontology terms to genes and gene products; entry of chemical structures for small molecules; defining regulatory relationships; and entry of data into many different PGDB fields including protein molecular weights, pIs, and cellular locations.
3. Bulk updating of a PGDB. A PGDB developer might run an external program that predicts cellular locations for hundreds of genes, and want to load those predictions into the PGDB. Some groups store the authoritative genome annotation for an organism in another genome-data management system, and want to periodically import the latest genome annotation into Pathway Tools; the software provides a tool for this operation. In addition, some of the individual components within PathoLogic that were used to initially create a PGDB can be run again at a later date to take advantage of updated information.
The following subsections describe these procedures in more detail.
3.1 PathoLogic PGDB Creation
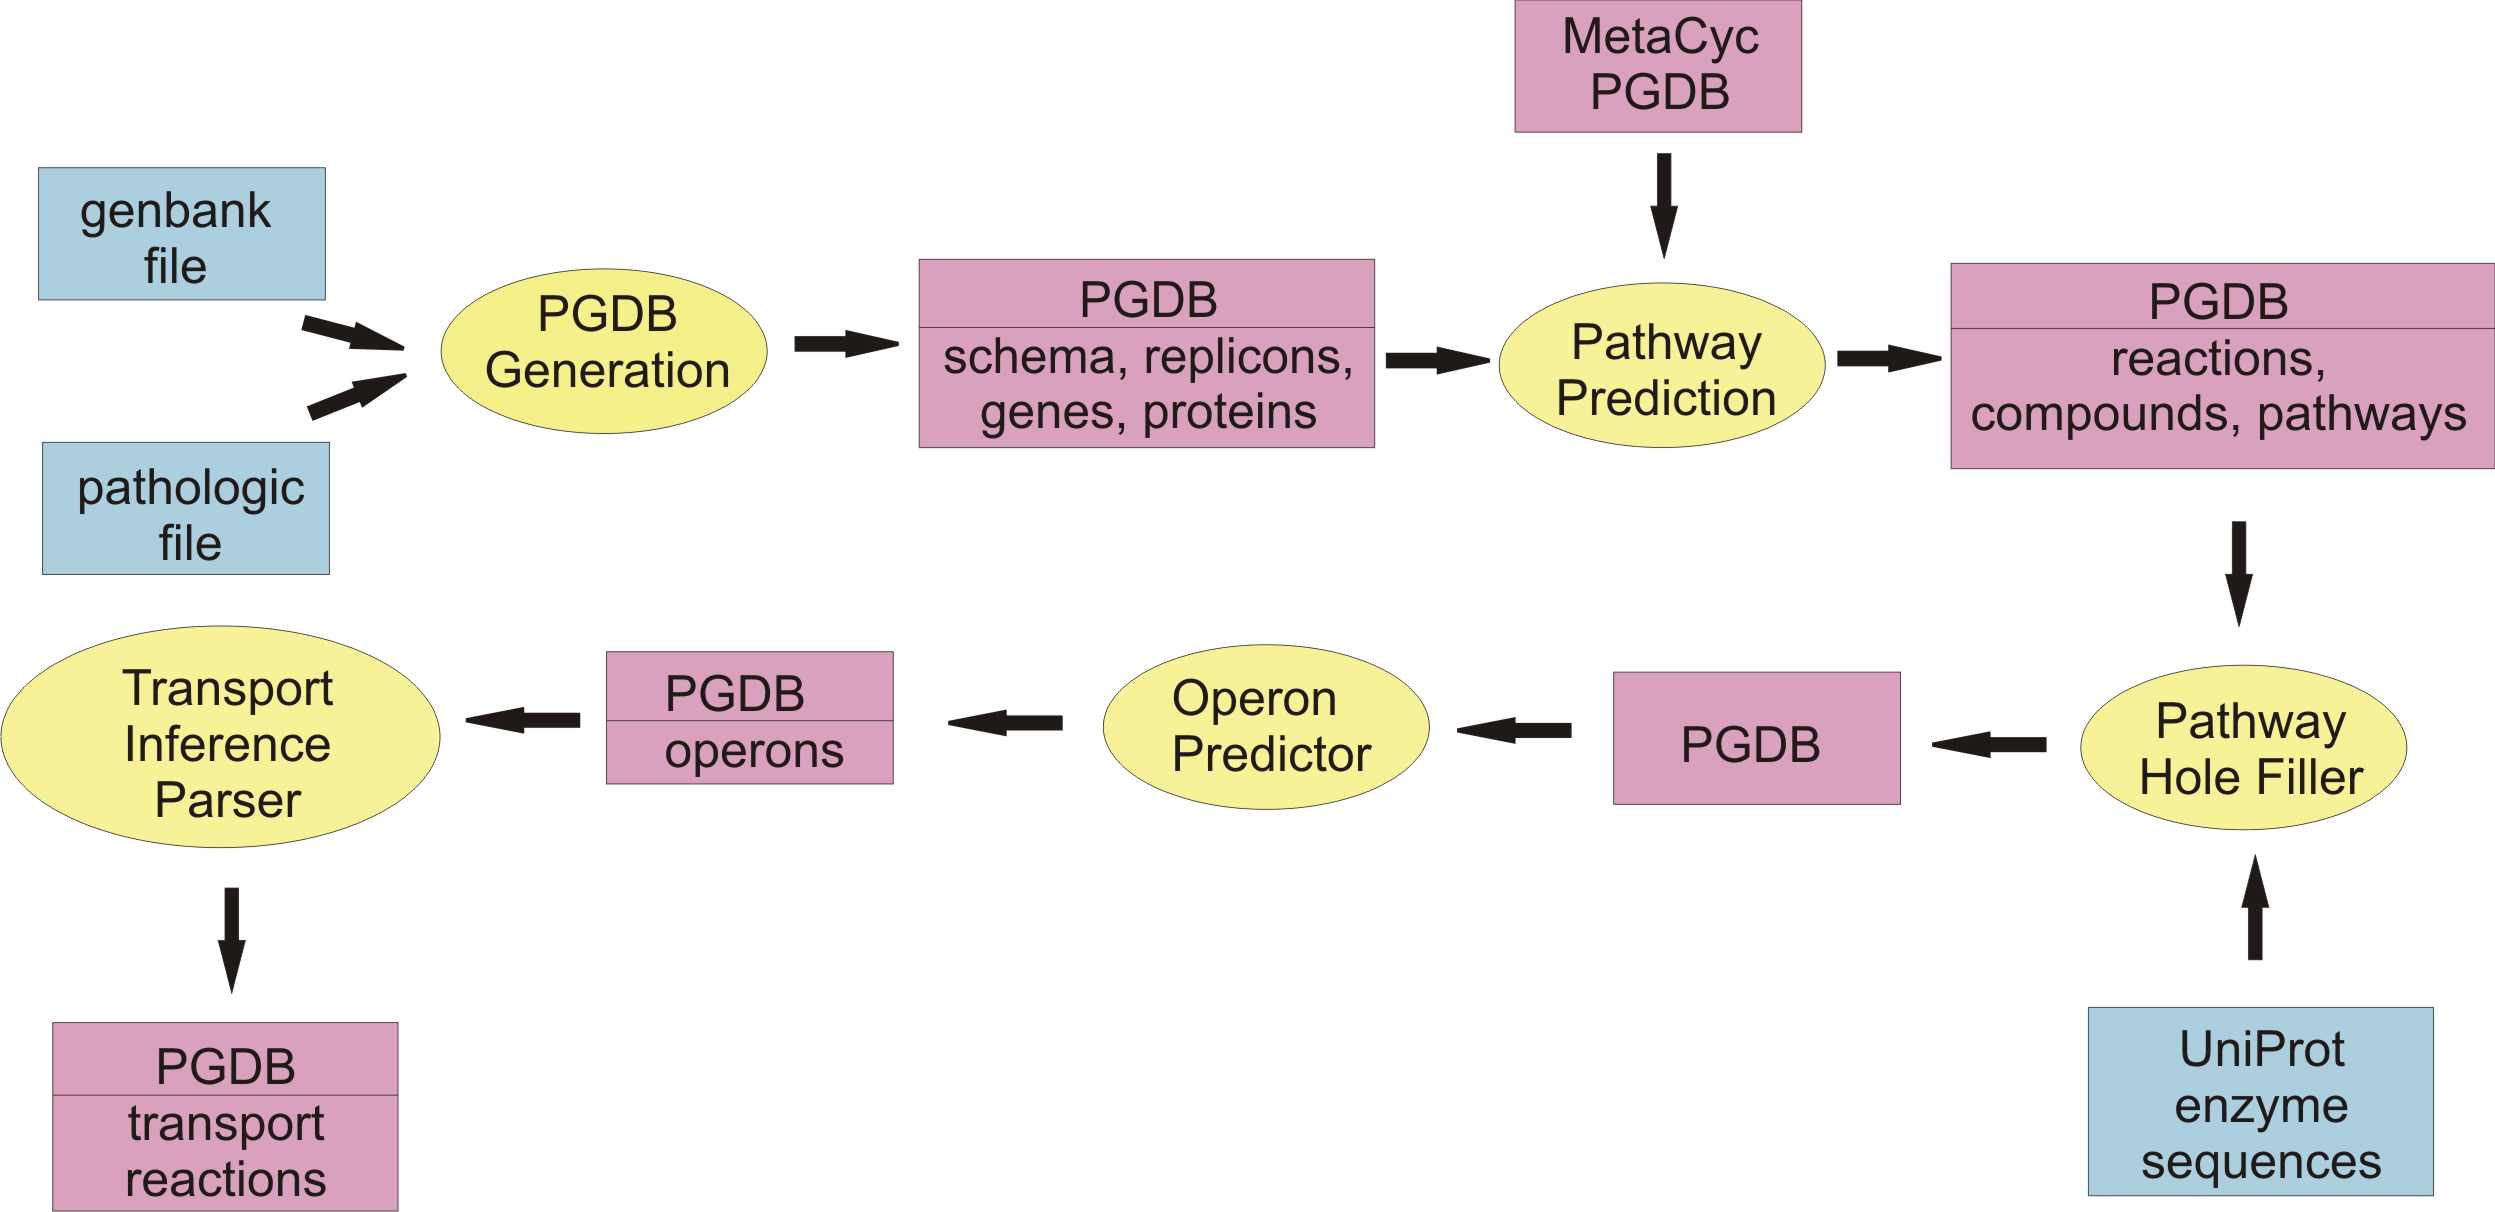
PathoLogic performs a series of computational inferences that are summarized in Figure 1. These inferences can be performed in an interactive mode, in which the user guides the system through each step, and can review and modify the inferences made by the system using interactive tools. PathoLogic can also execute in a batch mode, in which all processing is automated, to process hundreds or thousands of genomes.
The input to PathoLogic is the annotated genome of an organism. PathoLogic does not perform genome annotation; its input must supply the genome sequence, the locations of genes, and functions of gene products. The annotation is supplied as a set of files in GenBank format, GFF format, or PathoLogic format, each of which describes the annotation of one replicon (chromosome or plasmid), or of one contig for genomes that are not fully assembled. When the annotation is provided in PathoLogic format, the sequence is provided as one or more separate FASTA files.
The annotation specified in a GenBank or PathoLogic file can include the start and stop positions of the coding region for each gene, and intron positions. It can also include a description of the function of the gene product as a text string, one or more EC numbers, and one or more Gene Ontology terms. The annotation can also include a gene name, synonyms for the gene name and the product name, links to other bioinformatics databases, and comments.
PathoLogic initializes the schema of the new PGDB by copying from MetaCyc into the new PGDB the definitions of the ontology classes and the 350 slots (DB attributes) that define the schema of a PGDB.
PathoLogic next creates a PGDB object for every replicon and contig defined by the input files, and for every gene and gene product defined in the input files. It populates these new objects with data from the input files, such as gene names and their sequence coordinates, and gene product names. As a result of these operations, the new PGDB now mirrors the information in the input files.
3.2 PathoLogic Inference of Metabolic Pathways
Pathway Tools predicts the metabolic pathway complement of an organism by assessing what known pathways from the MetaCyc PGDB [26] are present in the annotated genome of that organism’s PGDB. This inference is performed in two steps that are described and evaluated in [119, 39, 80].
Step 1: The enzymes in the PGDB are assigned to their corresponding reactions in MetaCyc, thus defining the reactome of the organism. PathoLogic performs this assignment by matching to MetaCyc reactions the gene-product names (enzyme names), the EC numbers, and the Gene Ontology terms assigned to genes in the genome. The program can use whatever combination of these three information types is available in a given genome. For example, the fabD gene in Bacillus anthracis was annotated with the function “malonyl CoA-acyl carrier protein transacylase.” That product name was recognized by PathoLogic as corresponding to the MetaCyc reaction whose EC number is 2.3.1.39. PathoLogic therefore imported that reaction and its substrates into the B. anthracis PGDB, and created an enzymatic-reaction object linking that reaction to that B. anthracis protein. If the product name is not recognized or is ambiguous, and there is no EC number or GO term, then PathoLogic will look up the gene name to try to identify the reaction catalyzed, if any.
Step 2: Once the reactome of the organism has been established by Step 1, PathoLogic predicts what metabolic pathways are likely present based on the reactome. PathoLogic considers every pathway in MetaCyc, and computes a score that indicates the likelihood that the pathway is present. The pathway score is computed from the sum of the scores of the reactions in the pathway, divided by the number of reactions in the pathway (excluding spontaneous reactions). A reaction score is computed by summing these factors:
-
•
Is an enzyme catalyzing the reaction present in the organism?
-
•
How unique is the reaction to this pathway? Is it found only in this pathway, or in other pathways as well? The less unique a reaction, the lower its score.
-
•
Some reactions in a pathway are designated as key reactions, meaning the reaction distinguishes the pathway from other similar pathways; the presence of an enzyme that catalyzes a key reaction boosts the score of that reaction.
A rule-based expert system makes the final determination of whether the pathway is inferred as present by considering the following factors:
-
•
The pathway score
-
•
The presence of designated key non-reactions for the pathway –– reactions whose presence inhibits inference of the pathway
-
•
Was some other variant of this pathway assigned a superior score?
-
•
Is the pathway outside its taxonomic range as specified in MetaCyc, with at most one reaction having no enzymes present?
3.2.1 Calculation of Pathway Abundance for Metagenomics Analysis
PathoLogic computes abundances of metabolic pathways based on gene abundances, which is useful for comparing the metabolic profiles of different microbial communities. Gene abundances are specified in the annotated genome file (PathoLogic format only).
No preprocessing of the gene abundances (such as outlier removal) is done by PathoLogic. The abundance of a pathway is computed based on the gene abundances involved in the pathway. More precisely, assume that is the set of reactions in pathway for which gene abundances are specified, is the size of , and is the given abundance of gene . The abundance of a pathway is
That is, the abundance of a pathway is the sum of the abundances of the genes catalyzing the reactions of the pathway, divided by the number of reactions of the pathway for which gene abundances are given. Notice that this formula does take into account all the known isozymes catalyzing a reaction and the spontaneous reactions do not take part in the computation. The abundances are provided, among other results, in the file pathways-report.txt.
3.3 PathoLogic Inference of Operons
The Pathway Tools operon predictor identifies operon boundaries by examining pairs of adjacent genes and and using information such as intergenic distance, and whether it can identify a functional relationship between and such as membership in the same pathway [138], membership in the same multimeric protein complex, or whether is a transporter for a substrate within a metabolic pathway in which is an enzyme.
3.4 PathoLogic Inference of Pathway Holes
A pathway hole is a reaction in a metabolic pathway for which no enzyme has been identified in the genome that catalyzes that reaction. Typical microbial genomes contain 200–300 pathway holes. Although some pathway holes are probably genuine, we believe that the majority are likely to result from the failure of the genome-annotation process to identify the genes corresponding to those pathway holes. For example, genome-annotation systems systematically under-annotate genes with multiple functions, and we believe that the enzyme functions for many pathway holes are unidentified second functions for genes that have one assigned function. Erroneous pathway holes can result from the prediction of pathways that are not actually present in the organism.
The pathway hole-filling program PHFiller [60] (a component of PathoLogic) generates hypotheses as to which genes code for these missing enzymes by using the following method. Given a reaction that is a pathway hole, the program first queries the UniProt database to find all known sequences for enzymes that catalyze that same reaction in other organisms. The program then uses the BLAST tool to compare that set of sequences against the full proteome of the organism in which we are seeking hole fillers. It scores the resulting BLAST hits using a Bayesian classifier that considers information such as genome localization (that is, is a potential hole filler in the same operon as another gene in the same metabolic pathway?). At a stringent probability-score cutoff, our method finds potential hole fillers for approximately 45% of the pathway holes in a microbial genome [60].
PHFiller includes a graphical interface that optionally presents each inferred hole filler to the user along with information that helps the user evaluate the hole fillers, and enables the user to accept or reject the hole fillers that it has proposed.
3.5 PathoLogic Inference of Transport Reactions
Membrane transport proteins typically make up 5–15% of the gene content of organisms sequenced to date. Transporters import nutrients into the cell, thus determining the environments in which cell growth is possible. The development of the PathoLogic Transport Inference Parser (TIP) [102] was motivated by the need to perform symbolic inferences on cellular transport systems, and by the need to include transporters on the Cellular Overview diagram. The motivating symbolic inferences include the problems of computing answers to the following queries: What chemicals can the organism import or export? For which cellular metabolites that are consumed by metabolic reactions, but never produced by any reaction, does no known transporter exist? This would mean that the origin of such metabolites is a mystery, and would indicate missing knowledge about transporters or reactions that produce the compound.
To answer such queries, Pathway Tools uses an ontology-based representation of transporter function in which transport events are represented as reactions in which the transported compound(s) are substrates. Each substrate is labeled with the cellular compartment in which it resides, and each substrate is a controlled-vocabulary term from the extensive set of chemical compounds in MetaCyc [26]. The TIP program converts the free-text descriptions of transporter functions found in genome annotations (examples: “phosphate ABC transporter” and “sodium/proline symporter”) into computable transport reactions.
3.6 Atom Mappings
The atom mapping of a reaction specifies for each non-hydrogen atom in each reactant its corresponding atom in a product compound. Pathway Tools contains an algorithm for computing atom mappings, described in [100]. Essentially, this approach computes atom mappings that minimize the overall cost of bonds broken and made in the reaction, given assigned propensities for bond creation and breakage. This algorithm has been applied to compute atom mappings for almost all of the reactions in the MetaCyc database.
Atom mappings are used in two other parts of Pathway Tools. Atom mappings are used in the rendering of Pathway Tools reaction pages, to depict the conserved chemical moieties in a reaction. Conserved moieties are depicted by using the same color on the reactant and product sides. The bonds made or broken by a reaction are identified from the atom mapping for the reaction, and are colored black. Atom mappings are also used in the RouteSearch module of Pathway Tools described in Section 8.1.
Atom mappings are typically stored in the MetaCyc PGDB only, except for the reactions unique to other PGDBs.
3.7 Computation of Metabolite Gibbs Free Energies
The MetaCyc database provides the standard Gibbs free energy of formation for its compounds, and the change in Gibbs free energy for its reactions. These data were calculated by an algorithm within Pathway Tools. The algorithm first calculates the free energy of formation at pH 0 and ionic strength 0 () by using a technique based on the decomposition of the compounds into chemical groups with known free-energy contributions to the overall energy, based on the method of [70]. Then, the standard Gibbs free energy at pH 7.3 and ionic strength 0.25 () is computed based on a technique developed by Robert A. Alberty [3]. In his technique, Alberty proposes to use several protonation states for some compounds, but we simplified the technique by always using only one protonation state, the state stored in MetaCyc. We use pH 7.3 because this is a common cellular pH, and computation of the protonation state of all compounds in MetaCyc were performed at that pH.
The change in standard Gibbs free energy of reactions, , is computed based on the values of the compounds involved in the reaction. The could not be computed for some of the compounds in MetaCyc due to the impossibility of decomposing them into the groups provided by the technique of [70]. Consequently, the is not computed for any reaction which has a substrate for which its is not stored in MetaCyc.
3.8 Pathway/Genome Editors
The Editors support PGDB curation through interactive modification and updating of all the major data types supported by Pathway Tools. The editing tools included in Pathway Tools are as follows:
-
•
Gene Editor: Supports editing of gene name, synonyms, database links, and start and stop position within the sequence.
-
•
Isoform/Coding Segment Editor: Supports specifying multiple coding regions within a gene, including mRNA splicing and ribosomal slippage.
-
•
Protein Editor: Supports editing of protein attributes, subunit structure, and protein complexes (see Supplemental Figures 12-14). Enables users to assign terms from the Gene Ontology controlled vocabulary. Pathway Tools can store, and display features of interest on a protein; see Section 4.9 for more details. When editing a protein feature the user selects a feature type (e.g., phosphorylation site), defines the location of the feature on the sequence, a bound or attached moiety where appropriate, a textual label, an optional comment, citations, and sequence motif.
-
•
Protein Subunit Structure Editor: Supports editing of protein subunit structure and protein complexes.
-
•
Reaction Editor: Supports editing of metabolic reactions, transport reactions, binding reactions and redox reactions. This editor checks reactions for elemental balance and charge balance.
-
•
Atom Mapping Editor: Supports editing of the mapping of atoms from reactants to products for chemical reactions.
-
•
Pathway Editor: Enables users to interactively construct and edit a metabolic pathway from its component reactions. (See Supplemental Figure 11.)
-
•
Signaling Pathway Editor: Enables users to interactively construct and edit a signaling-pathway diagram by using a toolkit of icons and operations inspired by CellDesigner [52] (See Supplemental Figure 16). Updates to the visual representation are automatically translated back to changes to component reactions and proteins.
-
•
Regulation Editor: Enables definition of regulatory interactions including regulation of gene expression by control of transcription initiation, attenuation, and control of translation by proteins and small RNAs (see Supplemental Figure 15). This editor also allows creation of operons and definition of their member genes, as well as specifying the positions of promoters and transcription-factor binding sites.
-
•
Transcription Unit Editor: This editor allows creation of operons and definition of their member genes, as well as specifying the positions of transcription start sites and transcription-factor binding sites.
-
•
Compound Editor: Supports editing of compound names, citations, and database links. For specifying a compound structure, Pathway Tools has been interfaced to an external chemical structure editor, Marvin [106] (both the JAVA applet and the JavaScript versions), and it can import and export MOL files. A chemical compound duplicate checker runs whenever chemical structures are entered or modified, to inform the user if the resulting structure is identical to another compound in that user’s PGDB or in MetaCyc. Additionally, Pathway Tools can display glycan structures in an icon-based style that follows the conventions of CFG (Consortium for Functional Glycomics). To edit these structures, the software can communicate directly with a modified version of the GlycanBuilder editor [28, 40], to which we have added functionality for better integration with Pathway Tools.
-
•
Publication Editor: Supports entry of bibliographic references, allowing automatic import of data using a DOI URL.
-
•
Organism Editor: Supports editing information about an organism including species name, strain name, and synonyms, and taxonomic rank within the NCBI Taxonomy.
-
•
PGDB Info Editor: This editor allows entering data about the PGDB, including additional information about the organism it describes such as sample collection data (e.g., date, geographic location, host, body site); and phenotypic information, such as pathogenicity and relationship to oxygen.
-
•
Cellular Architecture Editor: Enables users to specify exactly which set of cellular components are present in an organism or cell type, with appropriate defaults derived from the organism’s taxonomy.
-
•
Sequence Editor: Supports interactive, visual editing of the nucleotide sequence for a replicon, allowing insertion, deletion, and replacement of arbitrary sections of sequence. Coordinates of all objects affected by the edits are updated automatically.
3.8.1 Author-Crediting System
Often, multiple curators collaborate on development of a given PGDB. It is desirable to attribute their contributions accordingly, both to identify whom to ask if questions about particular entries arise, and to provide an incentive for high-quality contributions, because contributors will be able to clearly demonstrate their accomplishments.
Most Pathway Tools editors thus create credits of several kinds. When an object such as a pathway is first created, by default, a “created” credit is attached to the object, along with a timestamp. A credit for an object can refer to curators, to organizations, or to both. Pathway Tools provides a generated web page for every curator and organization that lists all the objects for which they are credited.
Other kinds of credits are “revised”, which is used when a curator substantially edits an object that was created some time ago, and a “last curated” flag that can be set to indicate when a curator has last researched the literature available for a given object. The last-curated flag is useful for those objects about which almost nothing is known, to distinguish between the case where no curator has ever looked into that the object, versus the case where despite an extensive search no new information was found. The “reviewed” credit is used to attribute reviews of DB objects by external domain experts.
3.9 Incorporation of Genome-Annotation Revisions
Some groups choose to store the authoritative version of the organism’s genome annotation in a database external to the PGDB. Such users need the ability to incorporate revisions to the genome annotation into their PGDB without overwriting or otherwise losing any manual curation they added to the PGDB. Pathway Tools provides an interface for incorporating annotation revisions that takes as input one or more update files, either in GenBank format or as a PathoLogic Format file. The files can contain either a complete revised annotation for the organism, or they can contain just the information that has changed. The software will parse the update files and determine all differences between the new data and the old. Types of changes that are detected include new genes, as well as updated gene positions, names, synonyms, comments, links to external databases, and updated functional assignments. A graphical interface summarizes different classes of changes to the user, and gives the user the option of either accepting all updates (e.g., creating database objects for all the new genes) or of accepting/rejecting individual updates. Once this phase is complete and any changes to functional assignments have been made, the software will re-run the pathway-inference procedure described in Section 3.2, identify any new pathways that are inferred to be present and any existing pathways that no longer have sufficient evidence, and allow the curator to review those changes.
3.10 Sequence Coordinate Mapping Service (Web Only)
The authoritative or reference DNA sequence of a replicon is sometimes updated to fix sequencing errors. Because some of the errors can involve insertions or deletions, the base-pair coordinates further downstream will shift, compared to the uncorrected sequence. Such updates affect the positions of genes, promoter sites, and other regions of importance.
Pathway Tools provides a web form that will map user data files containing older coordinate information, to coordinates appropriate for the latest genome version. Note that this operation will not change the coordinates used in the PGDB itself, which always correspond to the latest version. However, it will enable updating older data files, so the revised file can be used for analyses against the latest sequence. The service can be invoked on the BioCyc website from the menu item Genome Map Sequence Coordinates
Pathway Tools provides a sequence editor that can be used to update the nucleotide sequence of a replicon. These individual edits are recorded in the replicon frame in the PGDB. The coordinate mapping service works by chaining together these edits to produce the overall mapping between two specified versions of the replicon.
3.11 Consistency Checker and Aggregate Statistics
Pathway Tools contains an extensive set of programs for performing consistency checking of a PGDB to detect structural errors and inconsistencies that sometimes arise within PGDBs. Such problems are caused by either user data-entry errors or errors in Pathway Tools itself. Also included in this component are tools for computing certain types of data and statistics for a PGDB, such as computing the molecular weights of all proteins from their amino acid sequences.
Roughly half of the programs can automatically repair the problems that they find. Such problems could be caused by either user data-entry errors or errors in Pathway Tools itself. Example checks include: ensuring that inverse relationship links are set properly (e.g., that if a gene is linked to its gene product, and that the product links back to the gene); making sure pathways do not refer to reactions they no longer contain; validating and updating GO terms with respect to the latest version of the GO Ontology; validating the format of hypertext within summaries and names; and removing redundant bonds from chemical structures. The other half of the programs can identify problems and point to their location but leave it to a curator to solve the issues.
3.12 Schema Upgrading and Propagation of MetaCyc Updates
Most new releases of Pathway Tools include additions or modifications to the Pathway Tools schema that are made to model the underlying biology more accurately (such as adding support for introns and exons), and to extend the data types within Pathway Tools (such as adding support for features on protein sequences). Because each new version of the software depends on finding data within the fields defined by the associated version of the schema, existing user PGDBs created by older versions of the software will be incompatible with these new software versions.
Therefore, every release of Pathway Tools contains a program to upgrade PGDBs whose schema corresponds to the previous version of the software, to the new schema version. For users who have not upgraded the software for several releases, several upgrade operations will be performed consecutively. Example upgrade operations include adding new classes to the PGDB from the MetaCyc PGDB; adding new slots to PGDB classes; deleting PGDB classes; moving data values from one slot to another; and moving objects from one class to another. The schema upgrade leaves the user’s curated data intact.
Every new release of Pathway Tools includes a new version of the MetaCyc database, which, in addition to providing new data content, typically contains updates and corrections to existing pathways, reactions, and compounds. Pathway Tools includes an option to propagate such updates and corrections to an existing organism PGDB. However, because we do not want to override any manual edits made to a PGDB, this tool does not run automatically. Much like the tool for incorporating a revised genome annotation, described in Section 3.9, this tool organizes the changes into logical groups (such as all compounds with newly added structures, or all reactions with changed reaction equations), and allows the user to either accept an entire group of changes, or to examine and confirm individual members of a group.
4 The Pathway Tools Schema
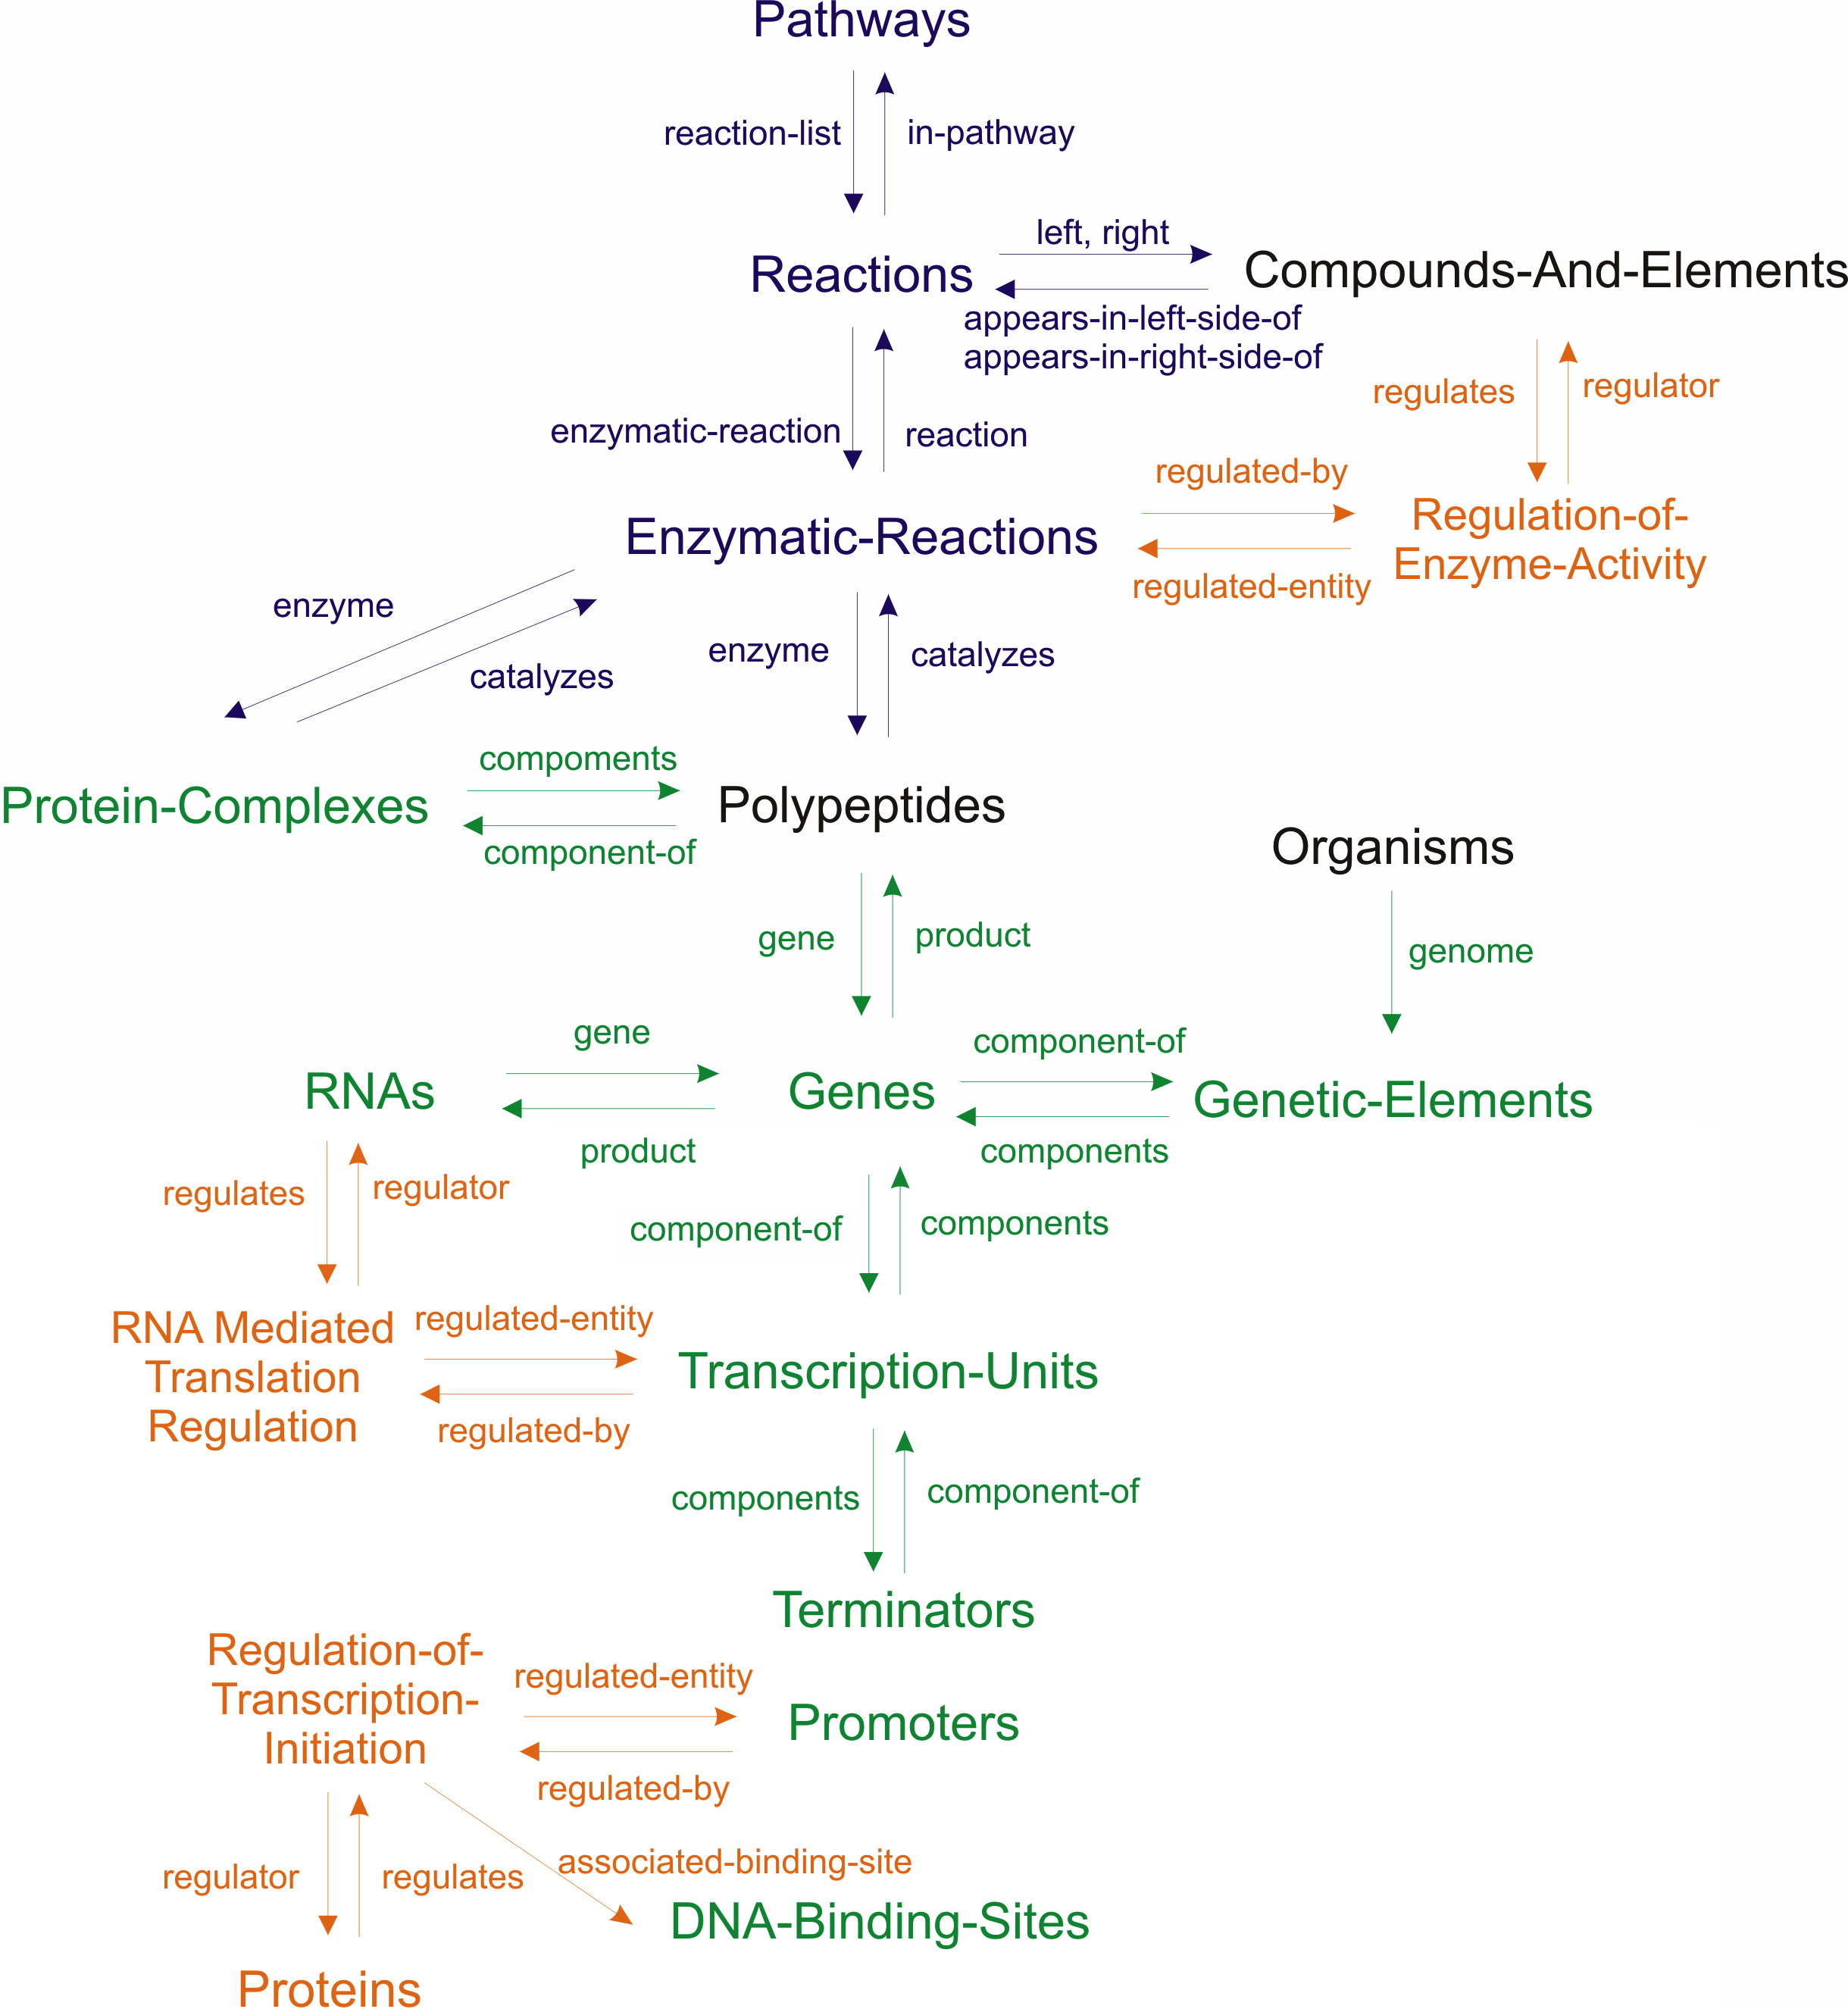
The Pathway Tools schema defines structured representations of a broad range of biological data types to enable computational analyses and integration of many types of data. The schema consists of a set of classes and a set of slots. Classes describe types of biological entities, such as genes and pathways, and are arranged in a class–subclass hierarchy. Slots define attributes of PGDB objects and relationships between PGDB objects. Figure 2 provides an overview of the relationships among PGDB classes. For example, user queries can follow the relationship from a gene to the protein that it codes for, from a protein to a reaction that it catalyzes, and from a reaction to a metabolic pathway in which it is a component, to answer questions such as “find all metabolic pathways, in which the products of a given gene play a role”.
Every PGDB object has a stable unique identifier (ID)—a symbol that uniquely identifies that object within the PGDB. Example unique IDs include TRP (an identifier for a metabolite), RXN0-2382 (an identifier for a reaction), and PWY0-1280 (an identifier for a pathway). Relationships within a PGDB are implemented by storing object IDs within slots. For example, to state that the TRP (L-tryptophan) object is a reactant in the reaction RXN0-2382, a slot of RXN0-2382 called LEFT (meaning reactants) contains the value TRP. Many PGDB relationships exist in both forward and backward directions (for example, the TRP object contains a field called APPEARS-IN-LEFT-SIDE-OF that lists all reactions in which TRP is a reactant). The slots LEFT and APPEARS-IN-LEFT-SIDE-OF are called inverses.
4.1 Metabolites, Reactions, and Pathways
There are two alternative ways in which one might choose to represent the metabolic network in a computer: as a simple listing of all metabolic reactions that occur in the cell, or by partitioning the reaction list into a carefully delineated set of metabolic pathways that describe small, functionally linked subsets of reactions. Which approach is preferred? Both approaches have value, and they are not mutually exclusive; therefore, Pathway Tools supports both views of metabolism in a PGDB.
Pathway Tools conceptualizes the metabolic network in three layers. The first layer consists of the small-molecule substrates upon which metabolism operates. The second layer consists of the reactions that interconvert the small-molecule metabolites. The third layer consists of the metabolic pathways whose components are the metabolic reactions of the second layer. Note that not all reactions in the second layer are included in pathways in the third layer, because some metabolic reactions have not been assigned to any metabolic pathway by biologists. Scientists who choose to view the metabolic network within a PGDB solely as a reaction list can operate on the second layer directly without interference from the third layer. The compounds, reactions, and pathways in levels 1–3 are each represented as distinct database objects within a PGDB. The relationships among the metabolic data types in a PGDB are depicted by the blue region of Figure 2.
The representation of reactions can capture atom-mapping information that records, for each atom in a reactant compound, its terminus atom in a product compound. The representation of metabolites can capture stereochemical structural information as well as glycan structures.
The pathways in PGDBs are modules of the metabolic network of a single organism. Pathway boundaries are defined by considering the following factors. Pathways are often regulated as a unit (based on substrate-level regulation of key enzymes, on regulation of gene expression, and on other types of regulation). Pathway boundaries are often defined at high-connectivity, stable metabolites [61]. Pathway conservation across multiple species is also considered, as are pathway definitions from the experimental literature [26].
4.2 The Proteome and the Genome
PGDBs define the proteome and the genome of an organism in the following manner, as depicted by the green region of Figure 2. The proteome of the organism is described as a set of PGDB objects, one for each gene product in the organism, and one for each complex formed from two or more (identical or nonidentical) polypeptides. Furthermore, every chemically modified form of a monomer or of a multimer is encoded by a distinct PGDB object. For example, we might create one object representing an unmodified protein and another representing the phosphorylated form. Each protein object is in turn linked, through a slot in the object, to the metabolic reactions that it catalyzes. Proteins can also be substrates of reactions. Additional PGDB objects define features on proteins, as described in Section 4.9. Each protein product resulting from alternatively spliced forms of a gene is also represented by a distinct protein object. Each protein object records the exons of the gene that encodes it.
Protein objects are linked to gene objects that define the gene encoding each protein. Each gene in the genome is defined by a distinct PGDB object, as is every replicon (chromosome or plasmid) in the genome. Genes are linked to the replicon on which they reside. In addition, other features on the genome, such as operons, promoters, and transcription-factor binding sites, are described by PGDB objects.
The associations between enzymes and the reactions they catalyze are implemented by using an intermediary object called an enzymatic reaction, as shown in Figure 2. This arrangement enables us to capture the many-to-many relationship that exists between enzymes and reactions—one reaction can be catalyzed by multiple enzymes, and multifunctional enzymes catalyze multiple reactions. The purpose of the enzymatic reaction is to encode information that is specific to the pairing of the enzyme with the reaction, such as cofactors, activators, and inhibitors. Consider a bifunctional enzyme with two active sites, where one of the active sites is inhibited by pyruvate, and the second active site is inhibited by lactate. We would represent this situation with two enzymatic reactions linking the enzyme to the two reactions it catalyzes, and each enzymatic reaction would specify a different inhibitor.
4.3 Pathway Tools Regulation Ontology
The Pathway Tools schema can represent a wide range of regulatory interaction types. A regulation object within a PGDB captures information about each type of regulatory interaction. The available regulation types are as follows: (a) Substrate-level regulation of enzyme catalytic activity, such as the allosteric activation or competitive inhibition of an enzyme by a small molecule. Slots of this class identify the regulator molecule, the regulated enzymatic reaction object, encode the polarity of regulation (activation or inhibition), and the mechanism of regulation (allosteric, competitive, or noncompetitive). (b) Regulation of a bacterial promoter by a transcription-factor protein. The slots of this regulation class describe the transcription factor, the promoter that is regulated, and the binding site to which the regulator binds. (c) Regulation via premature termination of transcription (attenuation). This class of regulation is divided into six subclasses, each describing a different attenuation mechanism (e.g., ribosome-mediated, protein-mediated, or RNA-mediated). The slots of these classes identify the regulated terminator region, the regulator (a protein, RNA or small-molecule, depending on the type of attenuation), and the regulator binding site if one exists. (d) Regulation of the translation of an mRNA transcript to the corresponding protein. This regulation class is divided into two subclasses to distinguish between regulation by a protein and regulation by a small RNA. The slots of these classes identify the regulated transcription-unit (which corresponds to a single transcript), the regulator protein or RNA, and the mRNA binding site where the regulator binds. An additional slot indicates whether regulation is by direct interference with the translation machinery, by processing of the mRNA transcript to promote or inhibit its degradation before translation, or both. (e) Regulation of protein activity by chemical modification, such as by phosphorylation, is represented by a reaction that converts the unmodified form of the protein to the modified form.
4.4 Conditions of Cellular Growth
The Pathway Tools schema supports representation of conditions of cellular growth that include the chemical composition of the growth medium, pH, temperature, and aerobicity. This representation enables us to capture low-throughput information about conditions of cellular growth, and high-throughput information such as Phenotype Microarray [20, 21] data sets.
4.5 Gene Essentiality
The Pathway Tools schema supports representation of gene-essentiality experiments. Our representation links growth phenotype (no growth, limited growth, or growth) under a given gene knockout with the conditions of cellular growth expressed as per Section 4.4. Multiple phenotypic observations can be recorded for a given gene knockout and growth condition to express conflicting experimental outcomes.
4.6 Organism Phenotype Data and Genome Metadata
The Pathway Tools schema supports representation of microbial phenotypic data to enable users to query among the many genomes stored within a Pathway Tools website to find organisms pertinent to their research. Our representation adapts the MIGS [48] standard to incorporate metadata about the sample from which the organism was derived (e.g., geographic location, depth, health-or-disease state of host, human microbiome site), phenotypic information about the organism itself (e.g., relationship to oxygen, temperature range, and pathogenicity), and genome-annotation metadata (e.g., annotation date, provider, pipeline).
4.7 Pathway Tools Evidence Ontology
Database users want to know the type(s) of evidence that support assertions within a DB, and they want to know the strength of that evidence. We have developed an evidence ontology [86] that can encode information about why we believe certain assertions in a PGDB, the sources of those assertions, and the degree of confidence scientists hold in those assertions (although in practice the latter field is rarely populated). An example assertion is the existence of a gene in a PGDB. Was the gene predicted by using computational gene finding? Is it supported by wet-lab experiments? The Pathway Tools evidence ontology builds upon and substantially extends the Gene Ontology evidence ontology, which applies only to gene products.
Evidence about object existence in PGDBs is recorded as a structured evidence tuple. An evidence tuple enables us to associate several types of information within one piece of evidence. Each evidence tuple is of the form
Evidence-code : Citation : Curator : Timestamp : Probability
where Evidence-code is a unique ID for the type of evidence, within a hierarchy of 54 evidence types described in [128, 86]. Citation is an optional citation identifier such as a PubMed ID that indicates the source of the evidence. For computational evidence, the citation refers to an article describing the algorithm used. Curator identifies the curator who created this evidence tuple. Timestamp encodes when this evidence tuple was created. Probability is an optional real number indicating the probability that the assertion supported by this evidence is correct, such as a probability provided by an algorithm.
The Pathway Tools editors enable users to manually enter evidence codes, and the PathoLogic pathway and operon predictors annotate objects that they create with appropriate computational evidence codes. The Navigator supports display and querying of evidence codes.
4.8 Pathway Tools Cell Component Ontology
The Cell Component Ontology (CCO) is a controlled vocabulary of terms describing cellular components and compartments, and relationships between these terms [125]. It was developed to provide a controlled vocabulary of terms for annotating the subcellular locations of enzymes, and the compartments involved in transport reactions, in PGDBs. CCO spans all domains of life, and includes terms such as cytoplasm, cell wall, and chloroplast. The ontology currently contains 170 terms. CCO includes many terms and their definitions from the Gene Ontology [32], but substantially extends Gene Ontology. A recent extension to CCO enables any metabolic reaction to be annotated to one or more CCO compartments, to allow metabolic models to span multiple compartments.
4.9 Pathway Tools Protein Feature Ontology
We have developed an ontology of protein features to identify and represent post-translational modifications, binding sites, active sites, conserved regions, and other regions of interest on a protein. Starting from the list of feature types described in the UniProt User Manual [10], with some suggested additions from the SRI EcoCyc and MetaCyc database curators, we created an ontology of 40 feature classes.
Features fall into two major classes. For amino acid site features, the feature location is a list of one or more amino acid residue numbers (or residue types, if the feature is associated with a generic protein whose precise sequence is unspecified). For protein segment features, the feature location is a range defined by its starting and ending residue numbers.
Feature types that are classified as binding features (either covalent or non-covalent) permit specification of an attached group. The attached group could be a compound or compound fragment, as in the case of a protein that binds a small molecule. The attached group can also be another protein feature, as in the case of a disulfide bond or other cross-link between two features on different proteins, or any other type of molecule or binding site (such as a DNA binding site).
A different protein object is created in a PGDB for each biologically relevant modified form of a protein, and a single feature may be linked to multiple forms of the same protein. Some feature types are capable of existing in multiple states. For example, an amino acid modification feature can be in either the modified or the unmodified state (as in the case of a phosphorylation feature, which will be in the modified state when associated with the phosphorylated protein and the unmodified state when associated with the unphosphorylated protein), and a binding feature can be in either the bound or unbound state (as in the case of a metal-binding feature whose state indicates whether or not the metal ion is bound to the protein). We consider the state to be not an attribute of the feature, but rather an attribute of the pairing between a particular form of a protein and the feature.
5 Visualization and Querying of PGDBs
The Pathway/Genome Navigator component of Pathway Tools provides mechanisms for interrogating PGDBs and for visualizing the results of those queries. We begin by describing the query tools. We then describe visualization tools for individual biological entities (such as genes and pathways). We next describe the SmartTables system, which enables the user to manipulate groups of PGDB objects, such as gene sets and metabolite sets. Finally, we describe system-level visualization tools that graphically display the entire metabolic network, entire regulatory network, and entire genome map of an organism.
The Navigator runs as both a desktop application and a web server, whereas the Pathway Tools components described in some other sections run as desktop applications only (e.g., PathoLogic does not run as a web server). The desktop mode has more overall functionality (see [31] for details), but the web mode has some functionality that is not present in the desktop mode.
5.1 Query Tools
Pathway Tools provides a three-level query paradigm, meaning that three different types of query tools are available, each of which represents a different trade-off between ease of use and query power.
Level 1: QuickSearch: Quick Search is designed to provide a fast and simple way for new or casual users to find general information in the site. The “Quick Search” box (top-right of most web pages; bottom-left of the Desktop window) is extremely easy to use. The user selects the organism whose PGDB the user wants to query and enters one or more search terms. Pathway Tools searches that PGDB for objects whose primary name or synonyms contain the search term as a substring, and presents the list of results, organized by object type (e.g., gene, metabolite, pathway). The user can click on an object name to navigate to the display page for that object.
Level 2: Single Object Searches: A set of intermediate-level query tools provides the ability to construct more powerful and precise searches against objects of a single class. Web mode: The Search menu contains a specialized search page for genes, proteins, and RNAs (see Supplemental Figure 1), for example, the user can search for proteins with a specified pI, molecular weight, and sequence length. Additional web-based query pages exist for pathways, reactions, chemical compounds, DNA or mRNA sites, and growth media. Desktop mode: See the Advanced Search commands under the Gene, Protein, and Compound menus, for example, the Compound Advanced Search enables a user to search for a metabolite with a specified full or partial chemical formula, chemical substructure, and/or (monoisotopic) molecular weight.
Level 3: Multi-Object Searches: The web-based Structured Advanced Query Page (SAQP) described below enables advanced users to construct extremely powerful searches (that are approximately as powerful as those provided by the SQL language). The graphical interactive nature of this web form makes these searches much easier to construct than those using the SQL language.
5.1.1 Organism Selection
PTools web-mode searches are conducted against a single PGDB, thus the first step is to select the desired organism or PGDB. The web-based organism selection dialog allows for searching organisms by name or taxonomic grouping, and includes quick links to a user’s recently accessed organisms. In addition, this dialog now offers a search option for finding PGDBs based on properties of the organism. Example searches include searching for organisms with a given growth phenotype (e.g., presence of oxygen or temperature); the geographic region where the organism was collected; the human microbiome body site at which the organism was collected; or properties of the PGDB, such as the software used to annotate the genome, or the number of regulatory interactions present in the PGDB. This type of search will become more valuable as more metagenomics projects generate data tied to specific body sites (e.g., the Human Microbiome Project) or specific geographic regions or built environments (MetaSub[33]).
In PTools desktop mode, some searches can be conducted against a single PGDB only; other searches can be conducted multiple PGDBs (see next section).
5.1.2 Cross-Organism Search
It is also possible to search across all organisms within a Pathway Tools web server, such as for the 18,000 organisms at BioCyc.org. This only implemented for the BioCyc web-site, those using our software to instantiate their own website won’t have this available. The cross-organism search tool [126] searches for user-specified combinations of words in the Common-Name/Synonyms attributes, and/or the Summary attribute. It can search all types of objects in a given PGDB, or in user-specified object types, such as genes and/or pathways. It can search all organism databases present in the Pathway Tools web server, or it can search user-specified sets of organisms, such as all organisms within a selected taxonomic group. Indexing and searching is implemented using SOLR [149].
A new capability in desktop mode (version 23.0) is the ability for many searches for entities such as pathways, compounds, and genes to be run against a collection of PGDBs, instead of against a single PGDB as previously. The user can define and save a named collection of PGDBs, which will become the subject of searches until changed. For example, this facility can be used to search multiple strains of the same species for the presence of a specified gene, or to search all organisms within a microbial community for the presence of a metabolite or a pathway. Searches return answer sets containing all objects that match the search across all the PGDBs in the collection.
5.1.3 Structured Advanced Query Page
The SAQP enables a biologist to construct precise structured searches. A query can be as simple as looking up a gene given a name, or as complex as searching several databases and several object types interconnected by several relations. The SAQP enables biologists to formulate queries whose power and expressiveness closely approach SQL, but without having to learn SQL. The SAQP translates a formulated query into BioVelo, an SQL-like language [2], before sending it to the web server.
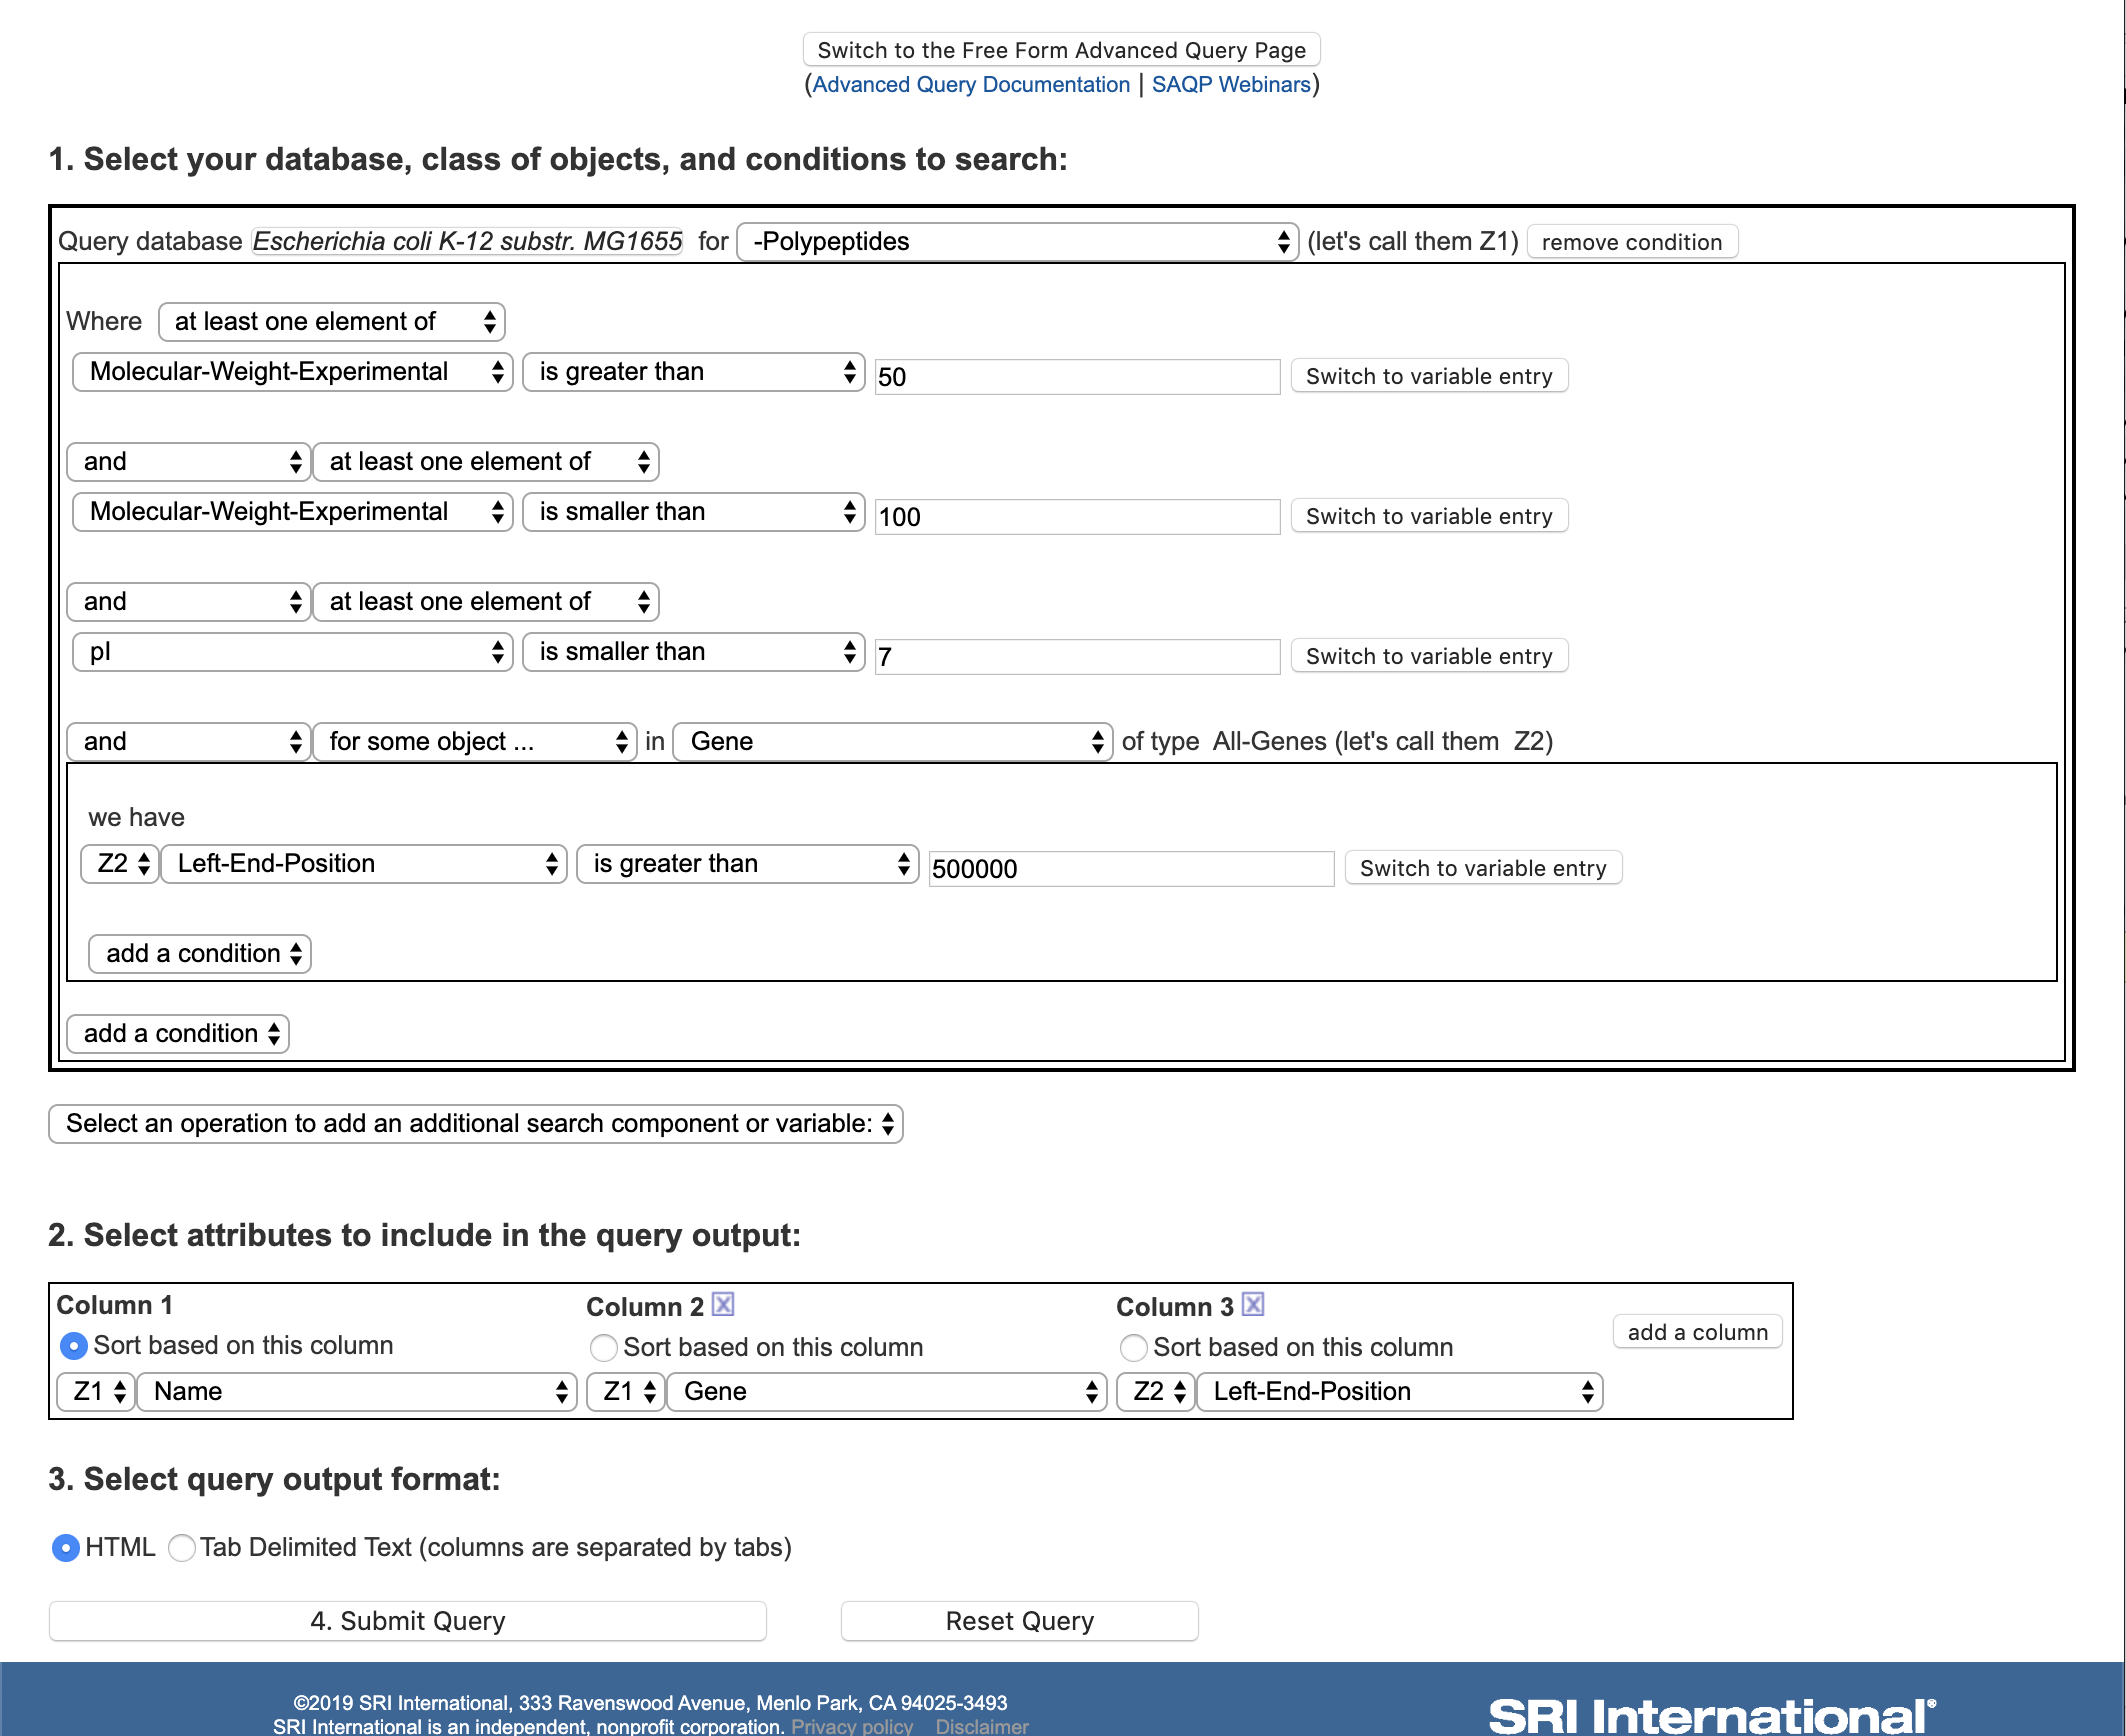
The following explanation presents the elements of this web user interface using the example shown in Figure 3, involving a query against the class of protein monomers (Polypeptides) in the EcoCyc DB.
Step 1: Select Database and Class. The first step in building a query is to specify at least one database (DB) and the class of objects to search.
Step 2: Specify Conditions.
Most queries include one or more conditions on the desired objects
within the class. By clicking the button labeled add a
condition in the initial blank SAQP, a where clause is
added—visually boxed—in the search component. This operation adds a
selector for an attribute (e.g., name) of the objects and
a selector for a relational operator (e.g., contains the
substring). It also adds a free text box to enter a number or
string. Several other relational operators are provided, such as is equal to, and is a substring of.
Regular expression matching is also available.
This new field forms an atomic condition. Additional atomic
conditions can be added to the query by using the button labeled “add
a condition”.
When selecting a relational operator, the list of relational operators provided is compatible with the type of the selected attribute. In the case of the attribute name, the selectable operators are for strings, because the type of the attribute name is string. The query in Figure 3 has three atomic conditions to filter the selected polypeptides.
Quantifiers on relations within the SAQP enable a join-like
capability. For example, imagine that we want to extend the query
with an additional restriction that depends on the gene encoding
the polypeptide, not on the polypeptide itself.
To do so, the user would add an and condition and then select
the gene attribute, which represents the gene encoding the
polypeptide. We then select
the quantifier operator for some object..., meaning that we want
to define a condition that applies to some of the genes in the
gene attribute of this polypeptide (although in the majority of
cases only one gene will be present).
At this point, the SAQP adds a new indented query clause, to enable a
condition to be defined on the gene. We have specified a constraint
that its nucleotide coordinate must lie after the first 500 kb of the
genome. Because several attributes and logical connectors can be
specified in this new clause, forming a complex condition by itself,
the web interface draws a box around this condition and introduces it
with the we have keyword. A new unique variable, named
Z2, is also introduced. This variable represents every value of
the gene attribute.
Step 3: Define Query Results. The section titled Select attributes to include in the query output enables the user to describe the contents of the query results by selecting the attributes to display for each result object. The result of a query is a table containing zero or more rows, one for each query result. Each column in the table is a user-selected attribute.
5.1.4 Notification of Database Updates
Users of the BioCyc website can register interest in sets of genes, pathways, and/or Gene Ontology (GO) terms. These interest areas are specified using Pathway Tools ontologies, such as using the pathway ontology to specify interest in cofactor biosynthesis, or using Gene Ontology to specify interest in genes involved in the cellular process Cell Adhesion. When new information relevant to their interest areas is curated in BioCyc, the user is notified by email [120]. Email notifications are concise and targeted, with brief descriptions of what in the user’s interest area has changed, and links to the updated BioCyc web pages.
5.2 Information Pages for Individual Biological Entities
Pathway Tools provides information pages for a number of different types of biological data types, such as genes, pathways, and metabolites. These pages summarize the information present in a PGDB for that datatype.
Genes/Proteins/RNA Page: The web version of the combined Gene/Protein/RNA information page uses a tab-based interface. Each tab contains a subset of the extensive information previously listed on one large gene page. The tab-based redesign reduces the amount of user scrolling required, makes the types of information available more apparent, and speeds the loading of the initial gene page (the Summary tab). These tabbed sections display data in tables for easier reading and faster loading. The set of tabs available depend on the information available for the gene and its product(s). A “Show All” tab replicates the previous all-in-one display. The full set of possible tabs are: the initial summary tab; a listing of reactions catalyzed by the gene product(s) and the pathways containing those reactions; the GO terms associated with a gene; essentiality information for the gene; protein features known for the gene; the operon(s) containing the gene; the regulon (set of operons) controlled by the gene if it is a regulator; the references for the gene.
The information available across the tabs is quite extensive, including the map position of the gene on the chromosome, a graphical depiction of the chromosomal region containing the gene, and available gene-essentiality information. The regulation-summary diagram (see Supplemental Figure 21) available on the summary tab integrates all known regulatory influences on the gene and gene product into a single figure. The diagram summarizes regulation of transcription, regulation of translation, post-translational regulation, and formation of multimeric complexes and chemically modified forms of a protein.
Some types of proteins have additional information available, as follows. Enzymes: The software displays the reaction catalyzed by the enzyme and the name of the pathway that contains that reaction, if any; the activators, inhibitors, and cofactors required by the enzyme; and comments and citations for the enzyme (See Supplemental Figures 3-4). Transporters: The software displays the transport reaction catalyzed by the transporter (see Supplemental Figure 5) as part of a single page, without the tabbed display. Transcription factors: The software displays diagrams for all operons controlled by the transcription factor (the regulon for the transcription factor) (see Supplemental Figure 6).
Reaction Page: Reaction pages apply to metabolic, transport, and protein signaling reactions (see Supplemental Figure 2). The reaction page shows the one or more enzymes that catalyze the reaction, the gene(s) that code for the enzymes, and the pathway(s) that contain the reaction. The display shows the EC number for the reaction and the reaction equation. Conserved chemical moieties in the reaction substrates are drawn in different colors based on atom-mapping information. Additionally, if atom-mapping data is available, the user can display atom-mappings for each of the atoms in a reaction, using either or both color-coding and numbering. In addition, there may be more than one possible atom-mapping for a given reaction, and the user can also control whether to see them all or not.
Pathway Pages: All metabolic pathway diagrams are computed automatically using pathway-layout algorithms. Pathway Tools can draw metabolic pathways at multiple levels of detail, ranging from a skeletal view of a pathway that depicts the compounds only at the periphery of the pathway and at internal branch points, to a detailed view that shows full structures for every compound, and EC numbers, enzyme names, and gene names associated each reaction. Depending on the graph structure of the pathway, it can be drawn using a linear layout (see Supplemental Figure 22 — this pathway diagram is drawn at the detail level that includes chemical structures), tree layout (see Supplemental Figure 23), or circular layout (see Supplemental Figure 24 — this diagram shows only the backbone metabolites of the pathway, and includes links to other related pathways). Pathway diagrams can also include cellular compartments (see Supplemental Figure 25 — this diagram shows only the backbone metabolites of the pathway, and includes links to other related pathways).
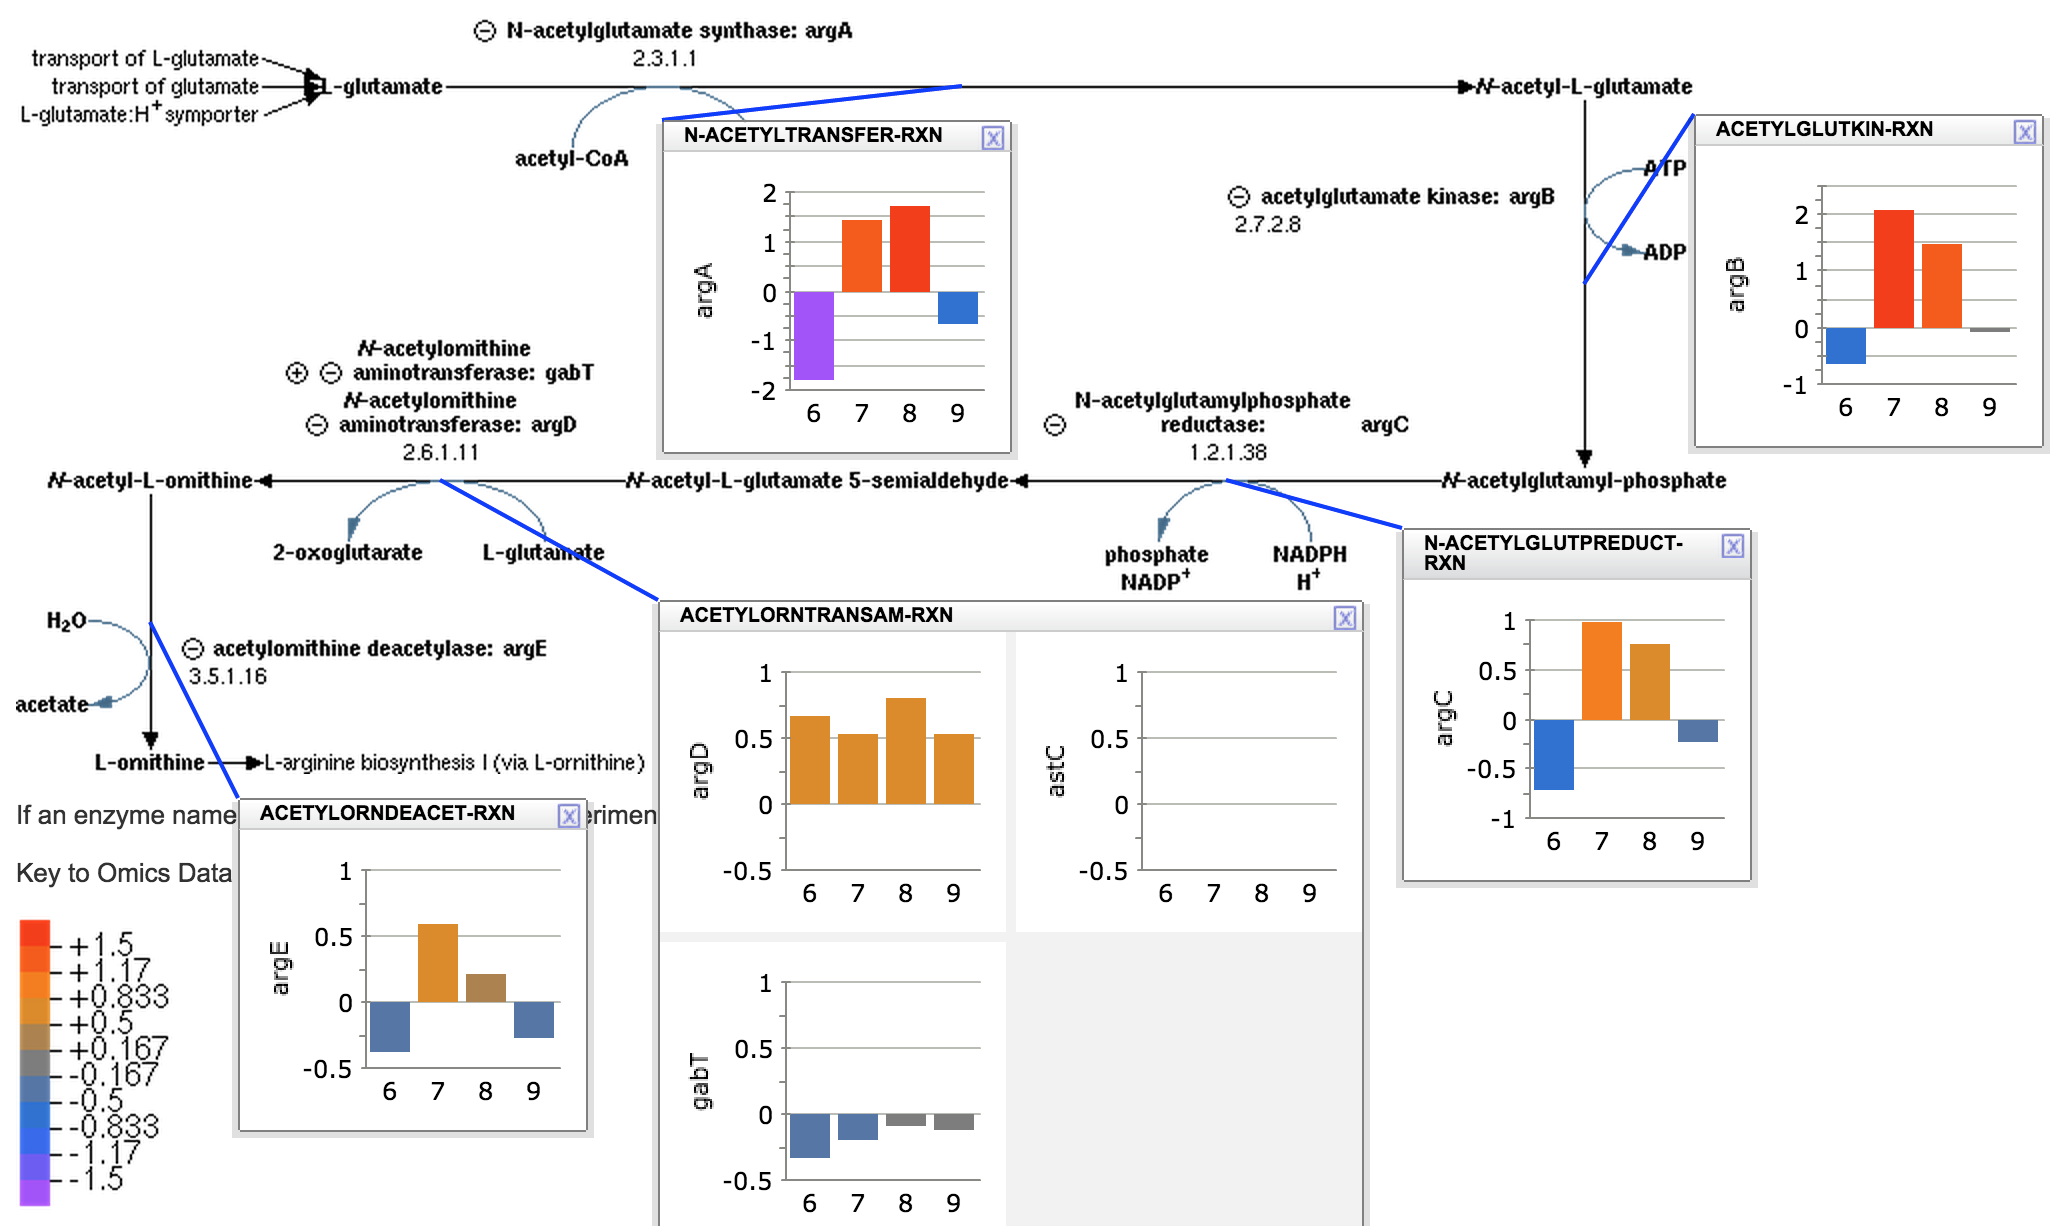
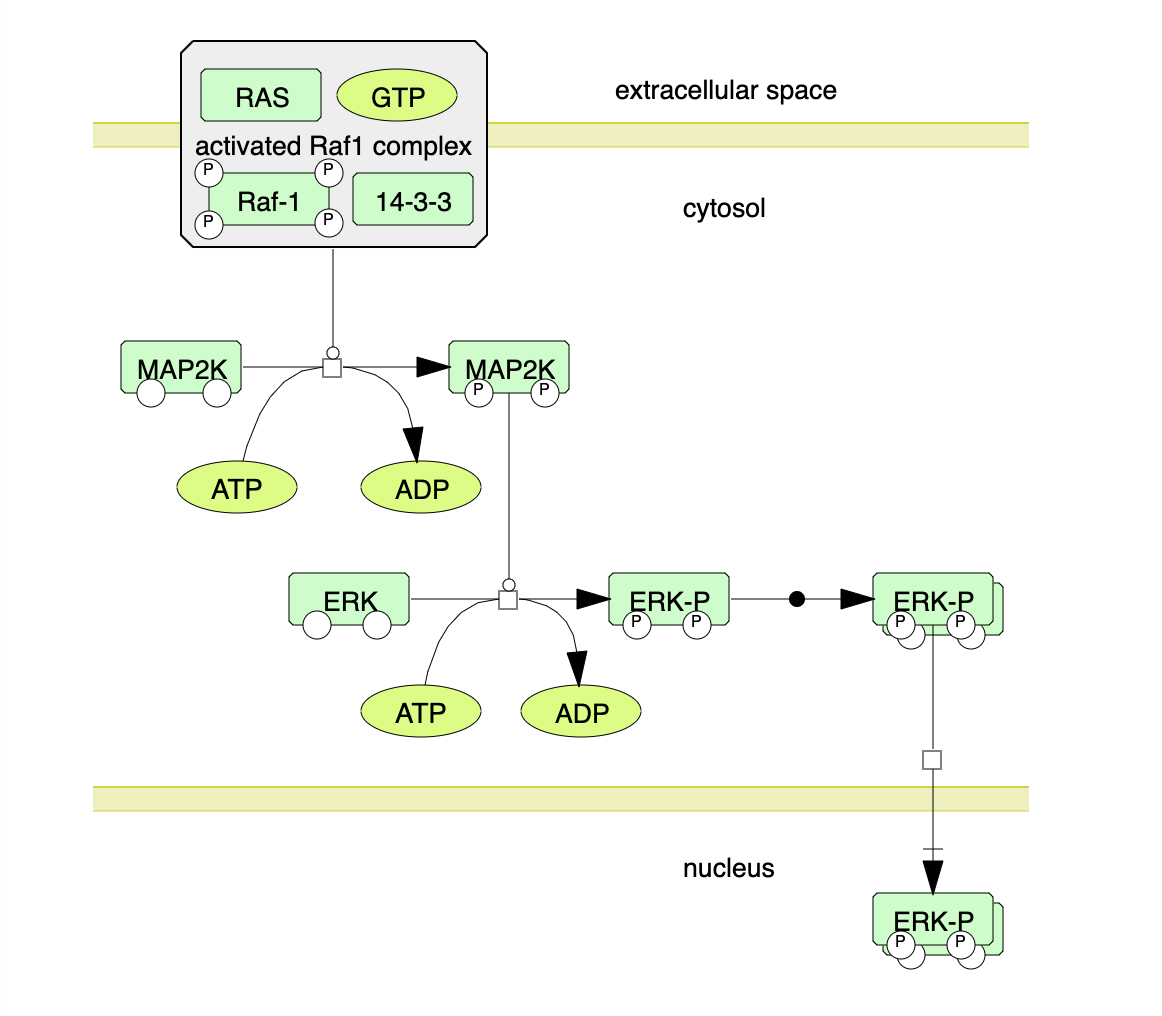
Pathway diagrams can also be shown at a detail level that includes the transcriptional, translational and substrate-level regulators for each step. The user can customize a pathway drawing to include desired elements only, and to include superimposed omics data using “omics pop-ups” (see Figure 4). Display of signaling pathways (see Figure 5) is also supported; signaling pathway layout is performed by the pathway curator.
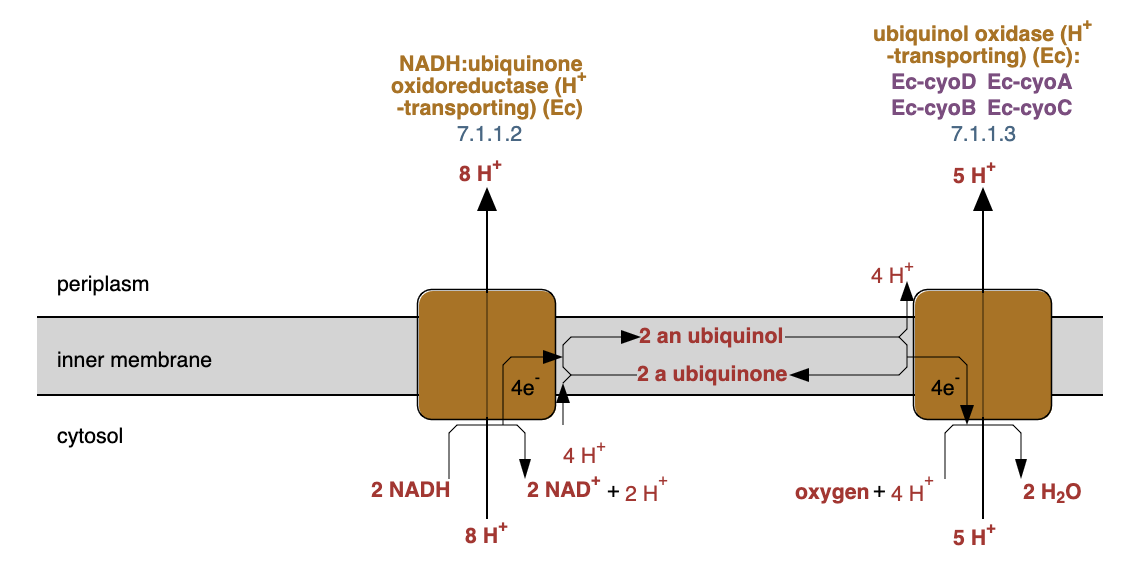
Electron Transfer Reactions and Pathways: A crucial role in cellular metabolism is played by electron transfer reactions (ETRs), which are of key importance in the energy household of a cell. In a series of redox steps, the high-energy electrons from some compounds drive the pumping of protons across a cell membrane, to maintain the proton motive force needed for ATP synthesis. Because electrons do not freely exist on their own, these redox reactions seem less intuitive than other small molecule reactions. We designed and implemented drawing code for a special ETR diagram, which shows the enzyme complex embedded in a membrane, and which schematically depicts the flow of electrons from one redox half reaction to another. Inside the membrane, the quinone/quinol cofactor is shown together with an indication of the cell compartments that are sources or sinks of the protons. An additional directional proton transport reaction can be added to the diagram. This results in displaying the flow of all substrates and products relative to the cellular compartments, in a similar way to what is customary in the biomedical literature. Pathways consisting of several ETRs joined together can also be depicted (see Figure 6).
Metabolite Pages: A metabolite page shows the chemical structure for the compound (see Supplemental Figure 8). It lists all reactions in which the compound appears, and it lists enzymes whose activity is regulated by the compound. These pages now provide a tab-based interface similar to that of gene/protein pages.
Transcription Unit Pages: The display window for transcription units diagrams the transcription unit and its regulatory sites including promoters, transcription-factor binding sites, attenuators, and binding sites for proteins and RNAs that regulate its translation. The display contains sections describing each site within the transcription unit. The promoter section describes which sigma factor recognizes it. Sections for a transcription factor binding site describe its sequence, which transcription factor it binds, ligands that influence the activity of the transcription factor, and whether the effect of binding is to activate or inhibit transcription initiation. Sections for attenuators describe the signal that the attenuator senses, and show the sequence regions that form the attenuator.
5.3 SmartTables: Large-Scale Manipulation of PGDB Object Groups
SmartTables enable users to construct and manipulate groups of PGDB objects through a spreadsheet-like user interface [159] (SmartTables were previously called Web Groups). SmartTables provide many powerful operations to biologist end users that previously would have required assistance from a programmer, and our user surveys indicated that SmartTables are reasonably easy for biologists to use [159]. To date, more than 10,000 users of BioCyc.org have created more than 80,000 SmartTables.
A typical SmartTables use case is for a user to define a SmartTable by importing a list of PGDB objects from a file. For example, a user could define a metabolite SmartTable by importing a list of metabolites from a metabolomics experiment, where the metabolites are specified by metabolite name, BioCyc identifier, PubChem identifier, or KEGG identifier. (The set of objects in a SmartTable can also be defined from a query result, from any column of an existing SmartTable, or from the set of, say, all genes in a PGDB.)
The user can browse the set of objects in a SmartTable by paging through the table, and can modify the information displayed about each object by specifying which table columns to include (see Figure 7). SmartTable columns are derived from the PGDB attributes available for each object, and can include information such as chemical structures, molecular weights, links to other databases, and nucleotide and protein sequence. A variety of filters and set manipulations are provided for SmartTables, such as removing or retaining all rows that match a user query; and computing the union, intersection, and set difference of two SmartTables. SmartTables are stored in the user’s online web account, and a desktop version of SmartTables is also provided. SmartTables are private by default, but the user can make them public, share SmartTables with selected other users, or archive them in a frozen form in conjunction with a publication.
The underlying representation of SmartTables enables them to be dynamic, so that if information represented in the SmartTable changes (as it might with a new release of a PGDB reflecting newly acquired information), those changes will be reflected in the SmartTable when it is next examined. For example, if a SmartTable is created which includes a column of genes and a column of pathways associated with those genes, a newer PGDB might introduce new pathways, and the SmartTable would reflect any additional, new pathways associated with each gene when next examined. Another example, a SmartTable may have a column of compounds and an associated column showing their structure. If a newer version of the PGDB introduces a different structure for a given compound, that would be reflected the next time the SmartTable is viewed.
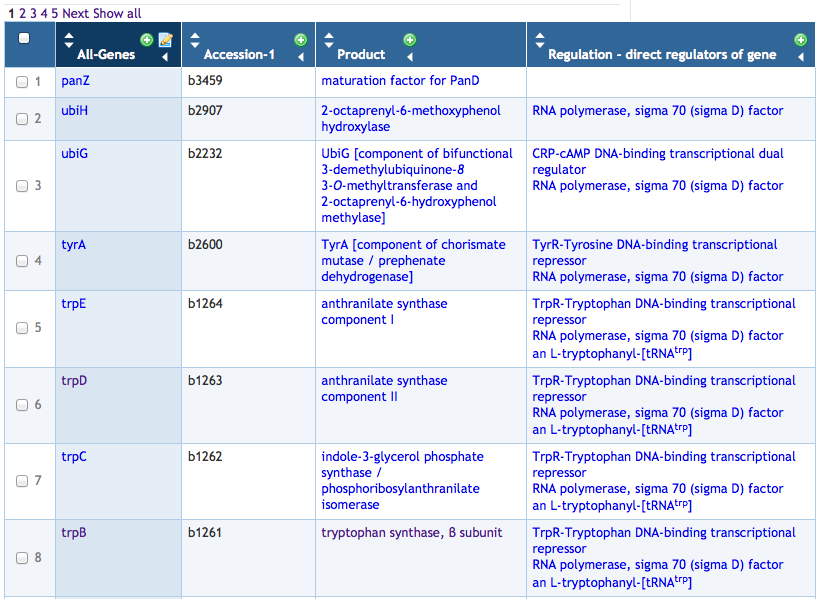
Several more advanced SmartTable operations are provided. Transformations compute new columns from relationships in a PGDB. For example, column 4 in Figure 7 is a transformation column that shows one or more regulators for each gene in column 1 that have been computed from PGDB relationships. Other gene transformations available include computing the metabolic pathways in which a gene’s product occurs and computing the amino-acid changes caused by sequence variants. Different transformations are available for different data types. For example, the transformations available for a metabolite SmartTable include computing the reactions in which a metabolite occurs, the pathways in which a metabolite occurs, the proteins for which the metabolite is a ligand, and mapping the compounds to their equivalents in another PGDB.
A user can perform a statistical enrichment analysis on a gene or metabolite SmartTable to detect over-represented metabolic pathways or GO terms, or over-represented metabolic pathways, respectively; see Section 6.7 for more details. In addition, a SmartTable of genes or metabolites can be visualized on the cellular overview.
Exporting a SmartTable as a tab-delimited file, for use with a spreadsheet program, is supported. We also support exporting FASTA-format files from SmartTables that include sequence information.
SmartTables can also be used to assist in navigation: a user can put the results of a search into a SmartTable, and then navigate the objects in a given column from one to the next (without having to return to the SmartTable at each navigational step).
SmartTables are also used for doing sophisticated queries of PGDB’s. A simple example: create a SmartTable whose initial column contains all the genes matching some search criteria; using a transformation to show the protein associated with each gene in a new column; using another transformation to show the pathways associated with each protein.
5.4 System-Level Visualization of Metabolic Networks
Pathway Tools can automatically generate organism-specific metabolic charts that we call Cellular Overview diagrams [123]. The Cellular Overview contains all known metabolic pathways and transporters of an organism (online example: [44]; click for example with animated display of omics data: [27]). Each node in the diagram represents a single metabolite, and each line represents a single bioreaction. The diagram is organized with biosynthetic pathways on the left, catabolic pathways on the right, energy metabolism pathways in the middle, and individual reactions not assigned to any pathway on the far right. Transport events are shown in the cell membrane. Each dot depicts a metabolite and each line depicts a metabolic reaction. Reactions are drawn within metabolic pathways, and pathways are organized into related groups, such as the group of all cofactor-biosynthesis pathways. In 2019 the diagram was re-engineered for the web mode of Pathway Tools so that the diagram can be zoomed in real time within a web browser, and so that semantic zooming draws additional detail as the diagram is magnified from the base level to a high level of magnification (see Supplemental Figures 17–19).
The diagram can be interrogated interactively using an extensive set of search operations, such as to find an enzyme or metabolite by name, using a menu in the website sidebar to the right of the diagram. The diagram can be generated as a PDF file for printing as a large-format poster. Example posters can be downloaded from [15].
Omics data (e.g., gene-expression or metabolomics measurements) for a given organism can be painted onto the cellular overview, as described in Section 6.2. Figure 8 depicts the Web Cellular Overview at low resolution painted with gene-expression data.
Cellular Overview diagrams are generated automatically using an advanced layout algorithm [123]. Automated layout is essential to enable the diagram to accurately depict the underlying database content as that content evolves, without requiring time-consuming manual updates by curators that are bound to overlook some content changes. In addition, automated layout enables generation of organism-specific cellular overviews that reflect the exact pathway content of each organism-specific PGDB in large PGDB collections such as BioCyc.
The Cellular Overview has many capabilities (described in more detail in [123]), including semantic zooming of the diagram (where the highest magnification corresponds to the detail shown in the poster version); highlighting of user-requested elements of the diagram (such as metabolites or pathways); highlighting large, biologically relevant subnetworks (such as all reactions regulated by a given transcription factor); and highlighting comparative analysis results, such as comparison of the metabolic networks of two or more PGDBs. Because a metabolite can appear in several different places in the diagram, in desktop mode, the user can better visualize the flow of material through the metabolic network by selectively showing connections between a metabolite of interest, or all the metabolites in a pathway of interest, and everywhere else those metabolites appear in the network, as shown in Figure 9.
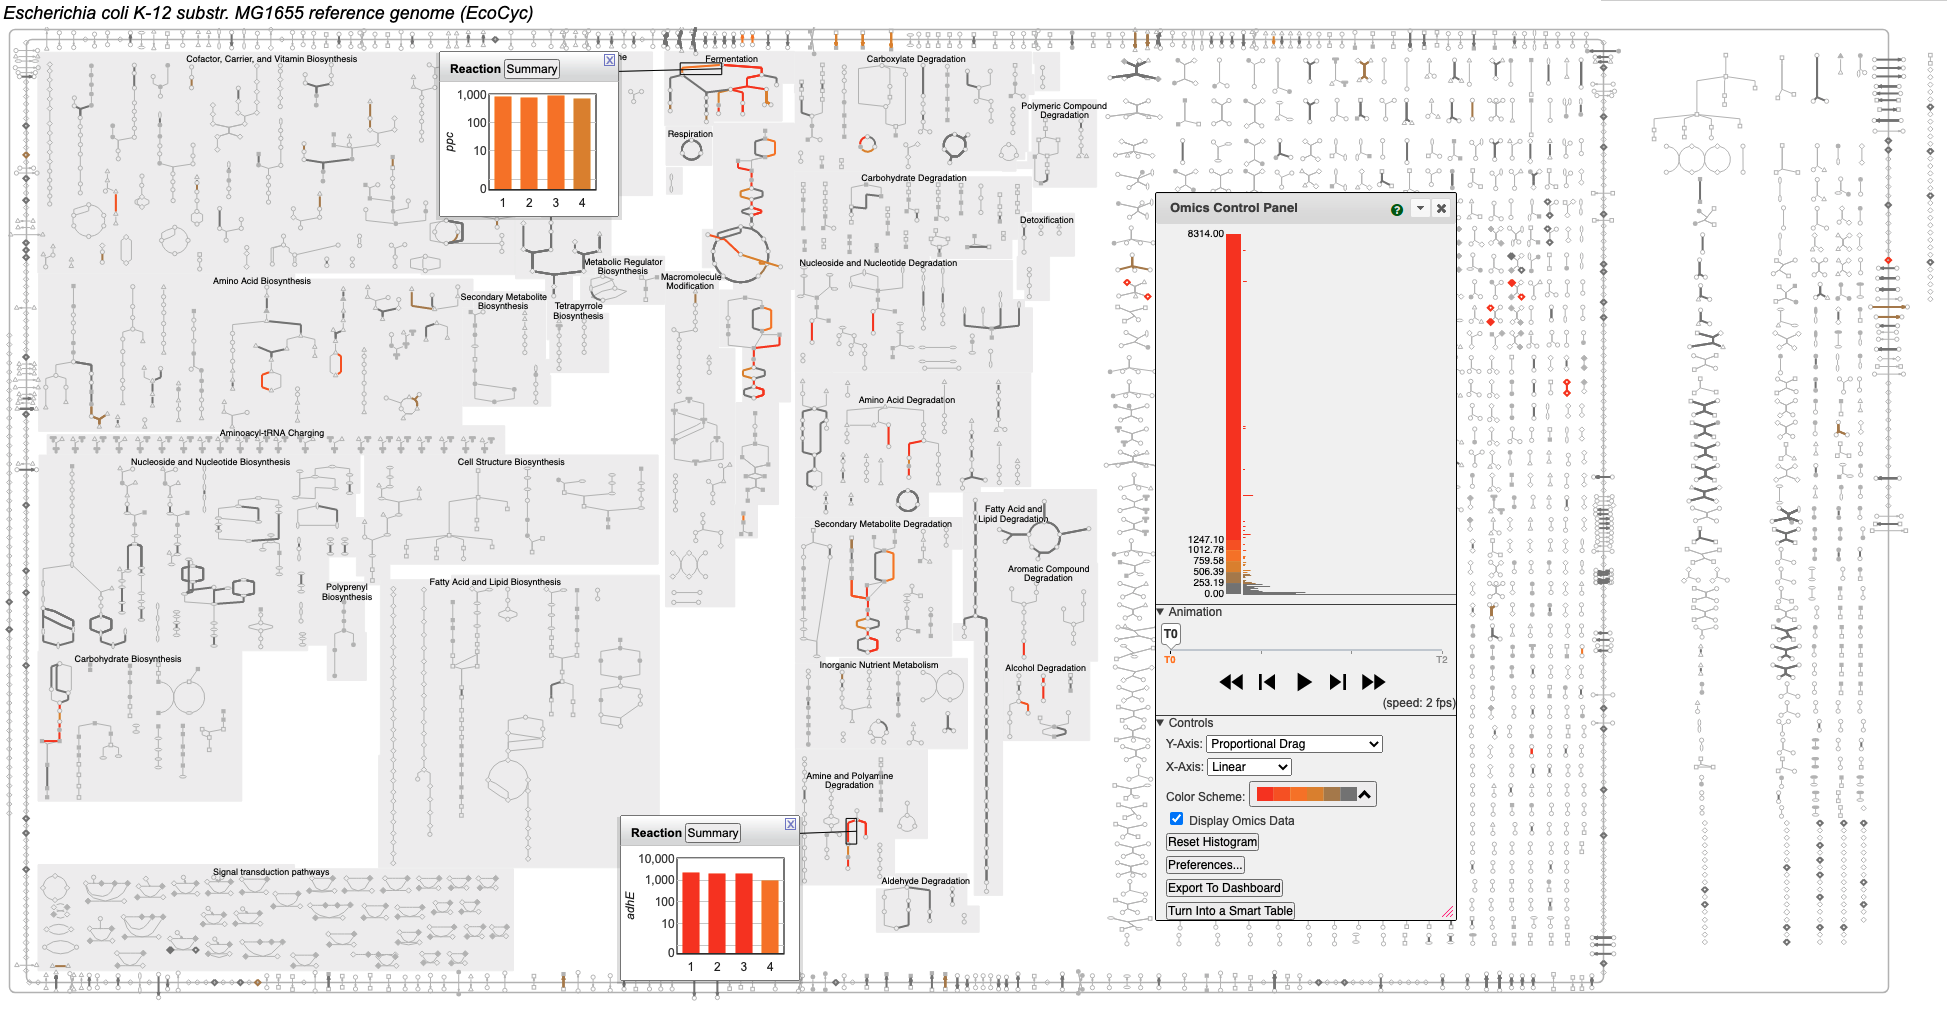
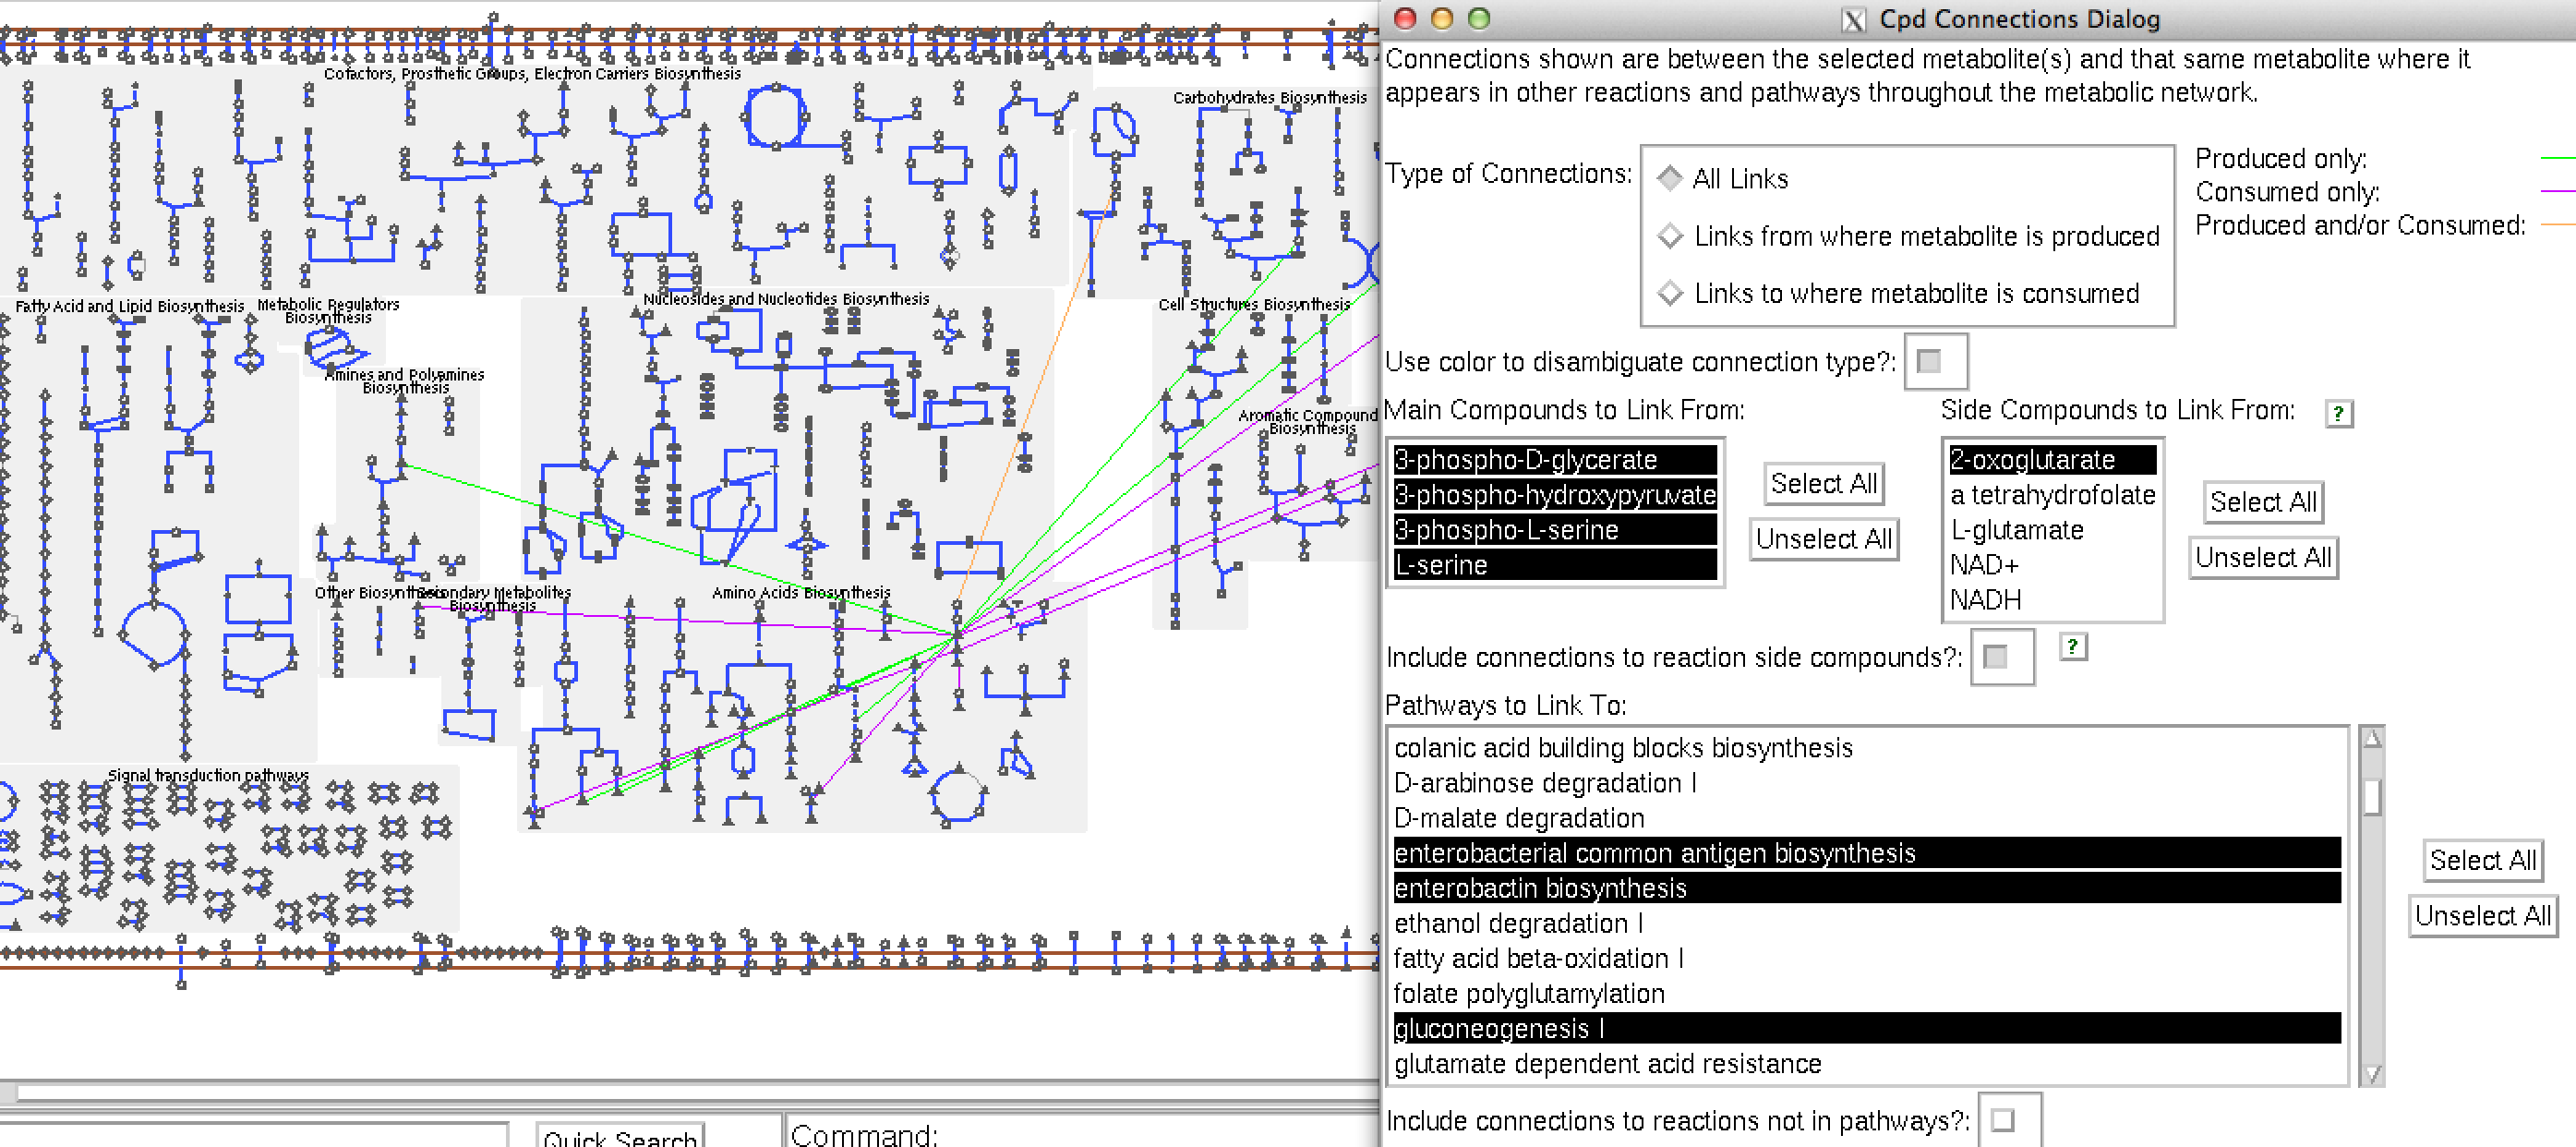
Cellular Overview diagrams from multiple organisms can be combined to depict metabolic cross-feeding relationships. Shared or unique pathways may be highlighted (see Supplemental Figure 20).
5.5 System-Level Visualization of Regulatory Networks
The Pathway Tools Regulatory Overview depicts the full transcriptional regulatory network stored in a PGDB in one screen, and enables the user to interrogate and explore relationships within the network. Figure 10 shows the Regulatory Overview for EcoCyc, after the user has asked the system to highlight all genes annotated under Gene Ontology term GO:0001539 (ciliary or flagellar motility). We can see that a few transcription factors control all E. coli motility genes.
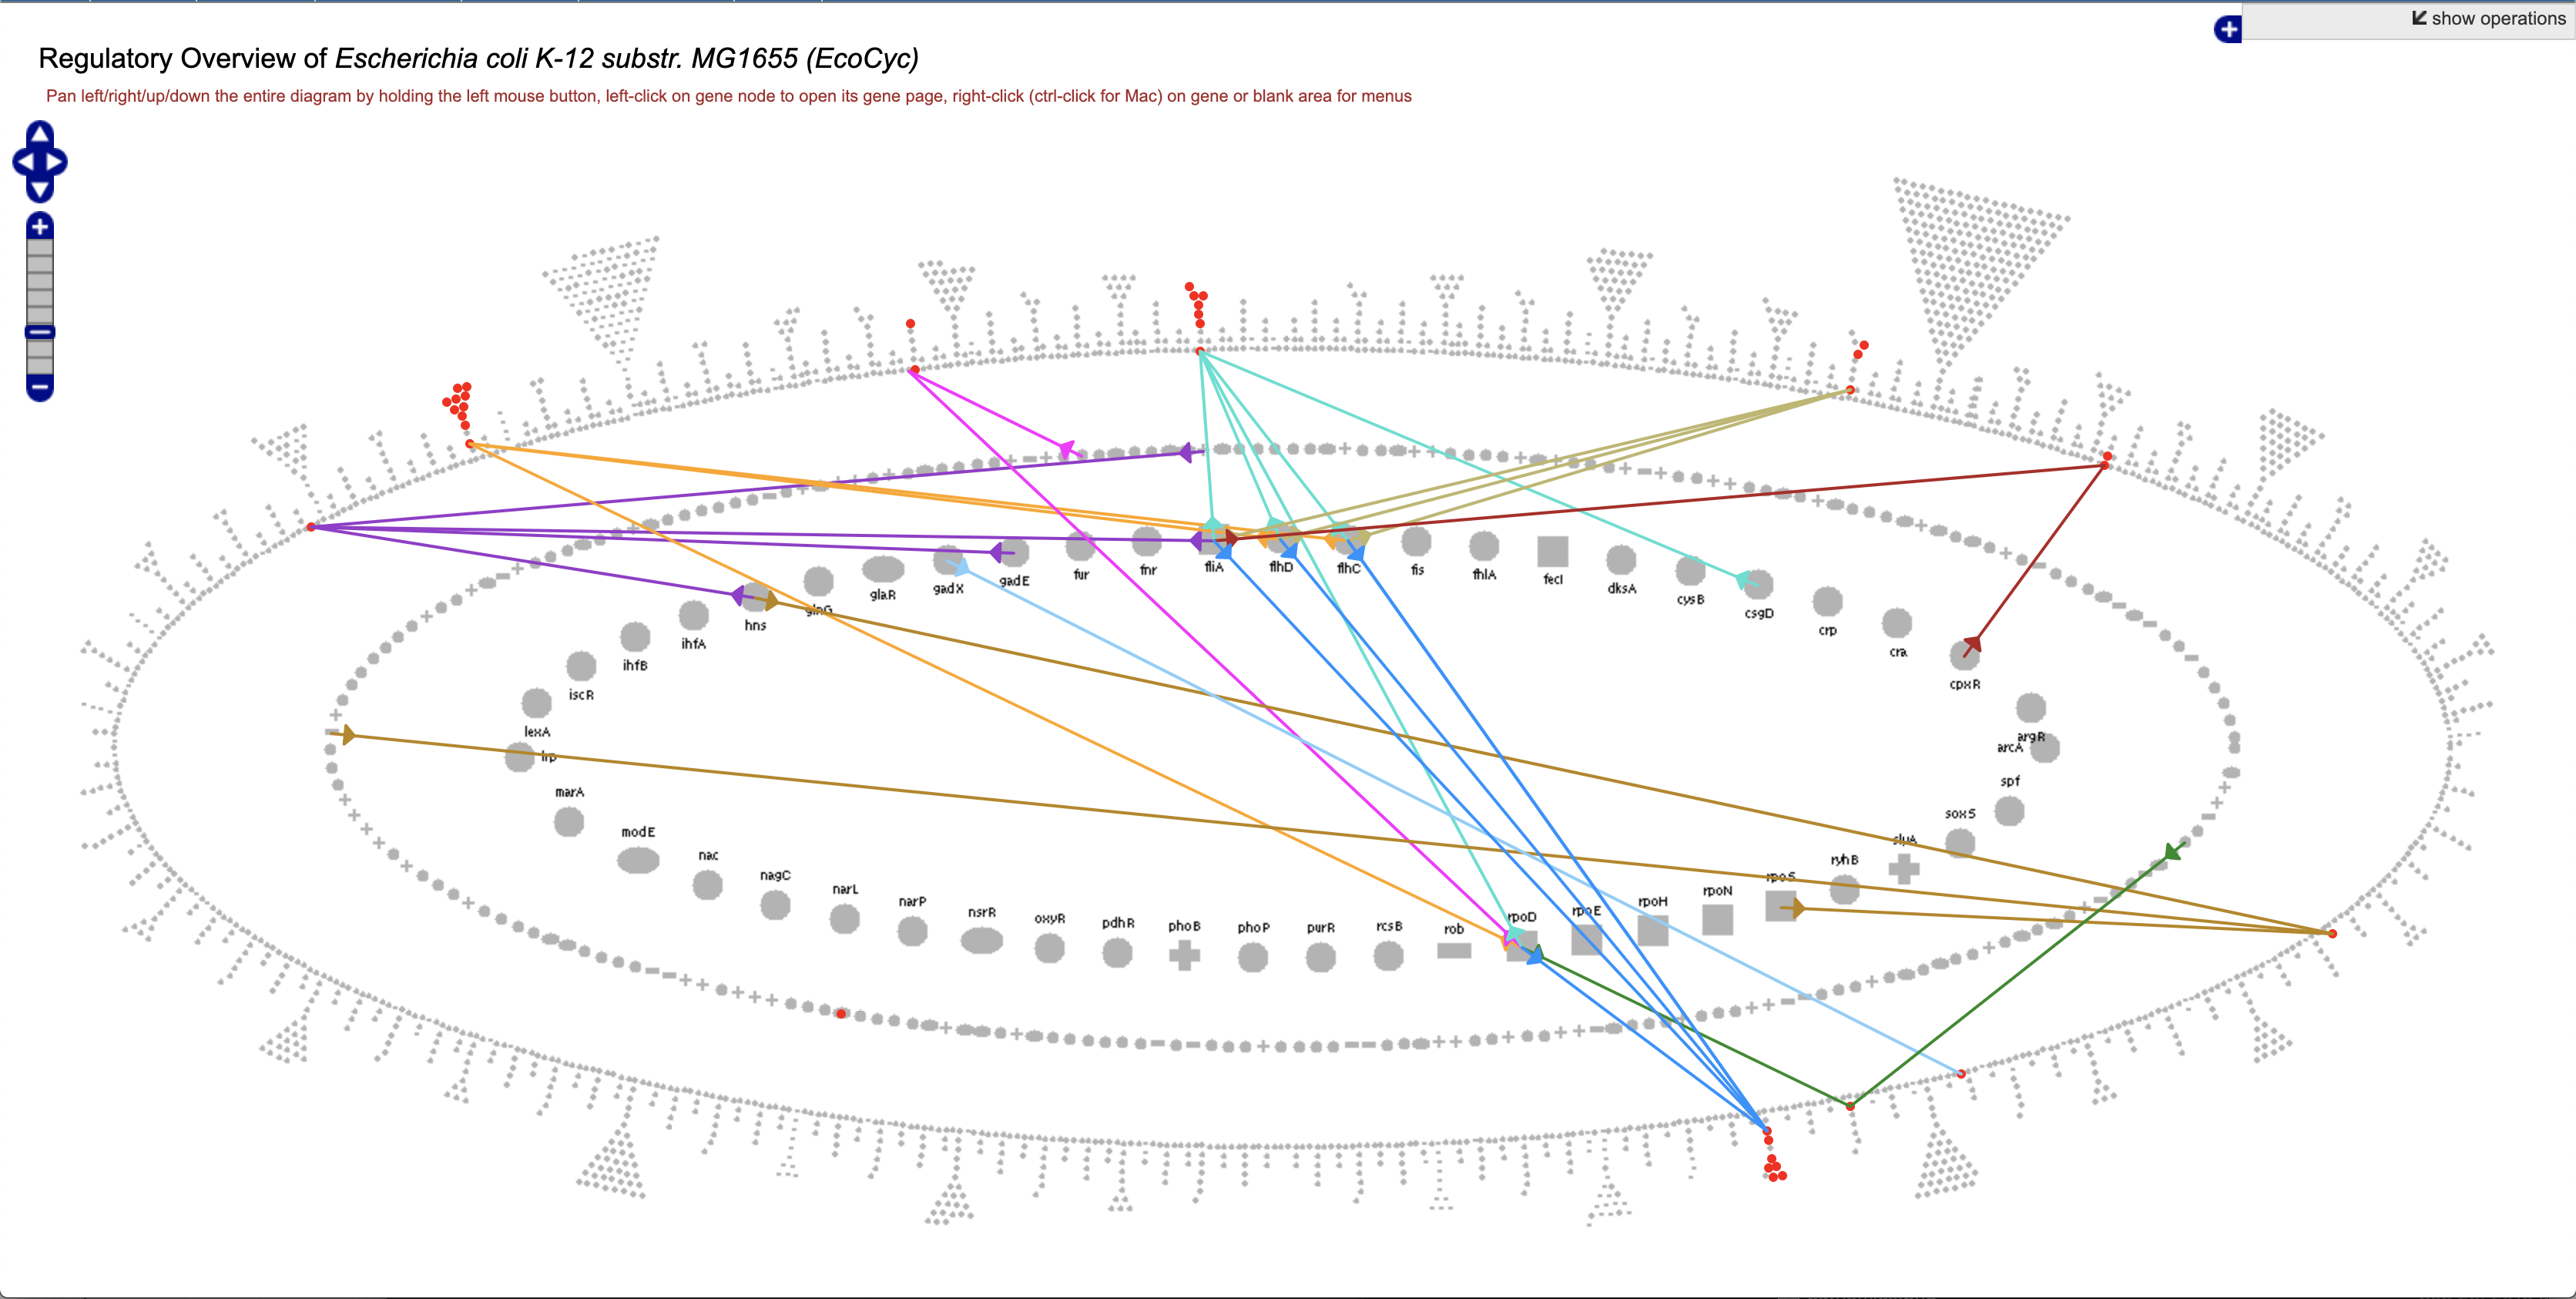
5.6 System-Level Visualization of Genome Maps
Pathway Tools includes two different genome browsers: a linear and a circular genome browser. The linear browser is designed for zooming in and out of genome regions to reveal new features, whereas the circular browser is designed to depict different genome features at a narrower range of magnifications.
5.6.1 Linear Genome Browser
The Pathway Tools linear genome browser displays a selected replicon (chromosome or plasmid), and enables the user to zoom into a region of the replicon by gene name or by coordinates. This browser supports semantic zooming: as the user moves deeper into the genome, additional features are displayed, such as promoters and terminators. At high magnification, the genome sequence and the amino-acid sequence of coding regions become visible. Intron and exon boundaries are shown. This genome browser can be used in a comparative mode that displays replicon regions centered on orthologous genes across a user-specified set of genomes to show the genomic context of those genes (example: [14]). In comparative mode, the user retains the ability to navigate left or right in the genome, and to zoom in and out. The genome browser can also generate large-format genome posters in PDF format; see examples at [15].
The linear genome browser also supports display of tracks, meaning the ability to view positional data from external files along the genome, such as viewing predicted transcription-factor binding sites.
A user who zooms out far enough is presented with a depiction of all the genes on the replicon called the Genome Overview, shown in Figure 11. This diagram can be painted with omics data to provide a global genome view of large-scale data sets.
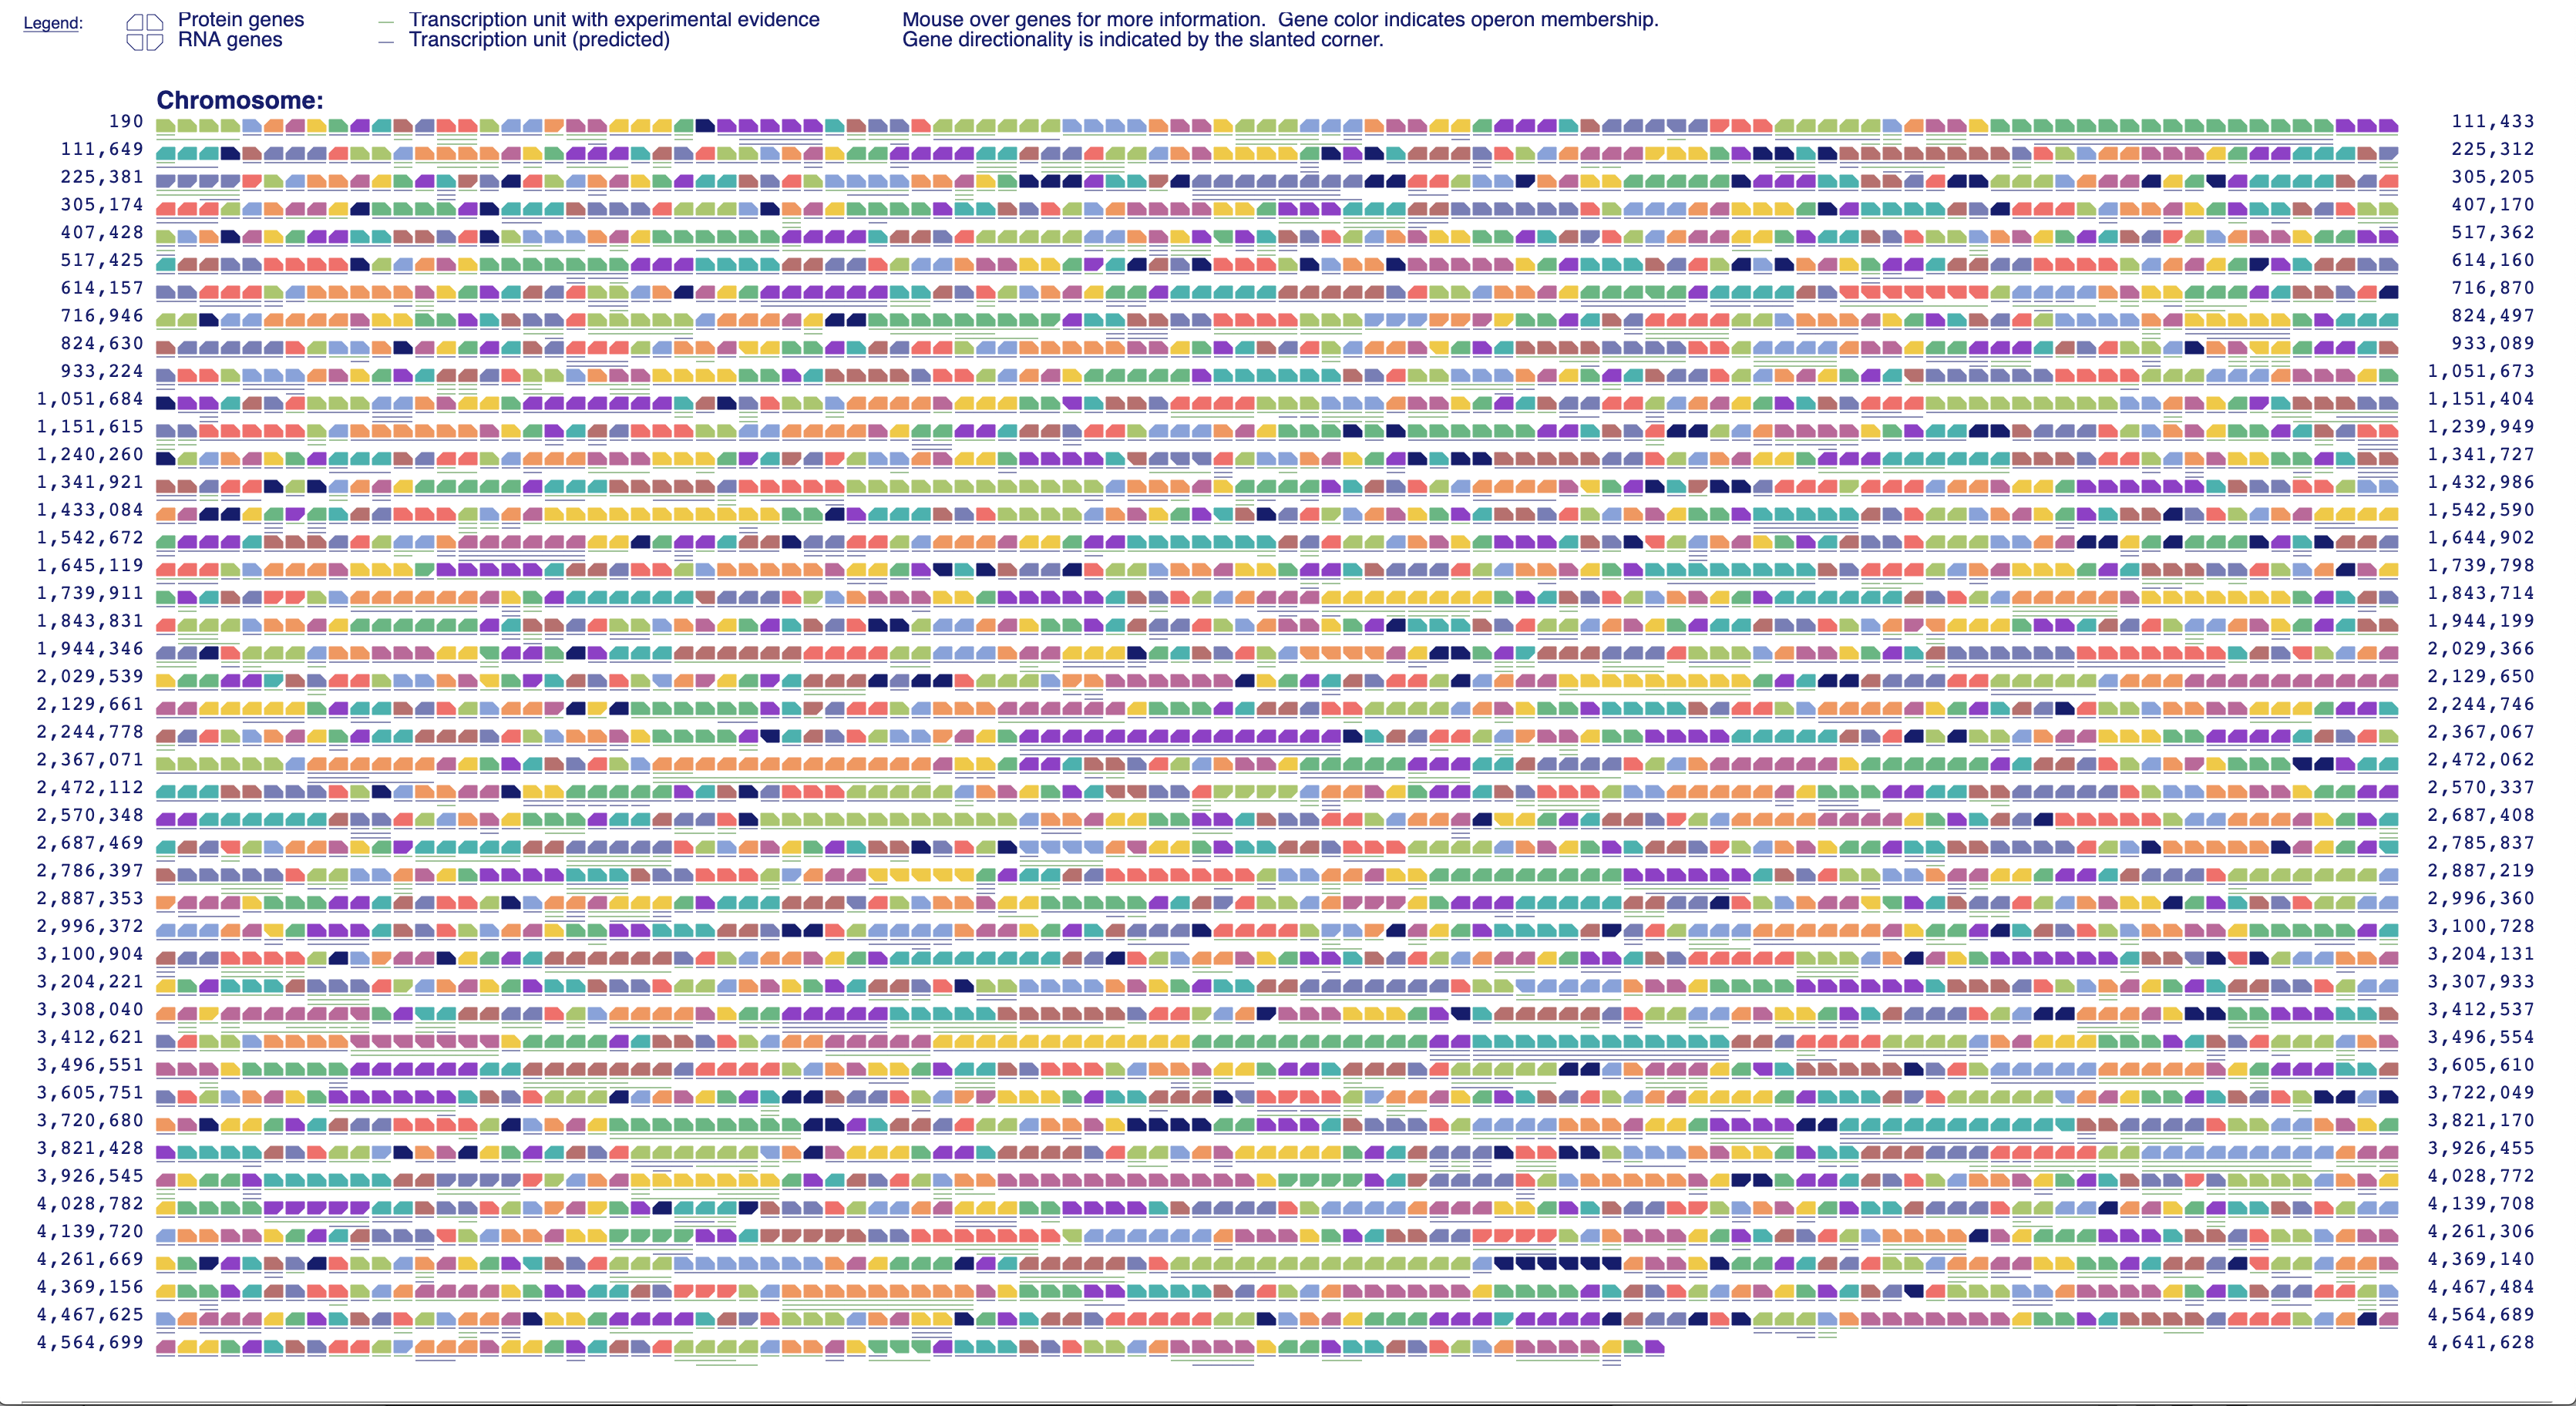
5.6.2 Circular Genome Browser
An interactive circular genome display consists of a set of user-specified concentric circles (tracks) showing features of interest from one or more circular replicons. A single track shows elements of a single feature class, such as genes, promoters, pseudogenes, DNA binding sites, REP elements and others. Some tracks can be filtered and/or highlighted based on user-specified criteria. For example, a gene track can be filtered to only show genes on one strand or the other, genes in a particular metabolic pathway class, RNA-coding genes, genes annotated to a specified GO term, genes regulated by a specified transcription factor, or genes whose names or whose product names match a specified substring. Alternatively, a track can include all genes, and then different subsets of genes can be highlighted in different colors according to one or more of the above criteria. Users also have the option to upload a file of genes of interest to filter or highlight a track. An example circular genome display with tracks for multiple feature types, and multiple gene tracks with different sets of highlights is available as Supplemental Figure 26.
The circular genome viewer can be used to visually compare multiple related strains. When tracks from multiple strains are included, an additional highlighting option colors genes that have orthologs between the selected organisms (See Supplemental Figure 27). In addition, a highlight that is applied to genes in one track can also be simultaneously applied to the orthologs of those genes in other tracks.
5.7 Sequence-Based Query and Visualization Tools
The following tools support query and visualization of sequence data from a Pathway Tools web server:
-
•
Nucleotide Sequence Viewer: Gene pages include links to view or download the nucleotide or RNA/protein sequence for the gene. When viewing the nucleotide sequence, an option is provided to include an additional upstream and/or downstream flanking region of any desired length. This option makes it easy to, for example, view the sequence of a regulatory region surrounding a gene of interest. Alternatively, the user can enter specific start and end coordinates and the desired strand to view the sequence of any arbitrary portion of the chromosome.
-
•
BLAST Search: Users can use BLAST to search for all sequences within a single specified genome or against all BioCyc PGDBs that match a query sequence.
-
•
Sequence Pattern Search (PatMatch): The PatMatch facility enables searching within a single genome for all occurrences of a specified short nucleotide or peptide sequence (less than about 20 residues), with the ability to specify degenerate positions. The user can specify the kind and number of allowable mismatches, and whether to search coding regions only, intergenic regions, or the entire genome. Examples of situations in which this facility might be useful include searching for all occurrences of a particular regulatory motif upstream of any gene, or all occurrences of a known cofactor binding motif within proteins.
-
•
Multiple Sequence Alignment: From a gene page, users can request a multiple sequence alignment between the nucleotide or amino acid sequences of that gene and its orthologs in a user-specified set of organisms. Alignments are displayed using MUSCLE [45].
5.8 Pathway Collages
The Pathway Collages [121] facility enables the user to create multi-pathway diagrams that can be personalized, annotated, printed, and shared. Usually the pathways within a collage are of interest in some biological situation, or are interconnected via shared metabolites. The user can specify the pathways of interest in several ways; the pathways are then exported to the Pathway Collage web application. Although the web application requires a web browser, sets of pathways can be created and exported from the desktop version of Pathway Tools, which will launch a browser after the export is complete.
In the web version of Pathway Tools, pathway sets for a collage can be specified by including a column of pathways in a SmartTable, from data uploaded into the Cellular Overview, by creating a collage with a single pathway from the pathway’s page, or by selecting pathways from a checklist on the page describing pathway collages. In the desktop version of Pathway Tools pathways can be selected from a SmartTable or from a select pathways tool available in the Cellular Overview.
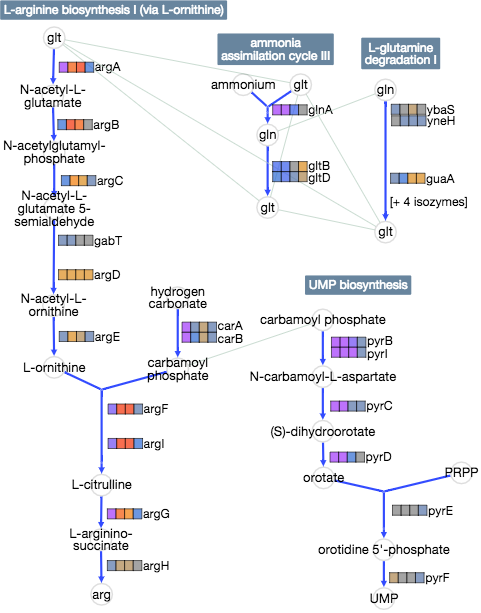
Within the Pathway Collage tool, the user initially sees a high-level drawing of the pathways they selected; they can then customize the diagram in several ways. The user can zoom in (and show more detail), move a pathway by dragging it, and perform editing operations (changing drawing properties or labels, deleting) on compounds or reactions within the pathway. Compound editing also includes the option to edit all occurrences of the compound within the diagram or import other pathways that involve the compound. Compounds can be connected with links, either linking all occurrences of a compound, or linking pairs of the users choosing. Alternatively, multiple occurrences of the same compound can be merged. Omics data can also be added to a collage while in the collage editor. An example pathway collage is shown in Figure 12.
Finally, the collage can be saved for further editing or sharing, or it can be exported as a PNG or SVG file.
6 Omics Data Analysis
Pathway Tools offers a number of tools for analysis of gene expression, proteomics and metabolomics data. These include both visualization tools and analytical tools such as enrichment analysis.
For most of these tools, the input is a tab-delimited file, with the first column containing gene, protein or metabolite names or identifiers, followed by one or more columns of numeric data values. Pathway Tools looks up these names and/or identifiers in its large tables of synonyms and identifiers. In many cases, data can also be imported from a SmartTable or directly from another data repository such as GEO or Metabolomics Workbench.
The visualization tools span several granularities, from visualizing data on individual pathways, to visualization on collections of related pathways (pathway collages), to genome-scale visualization on a complete metabolic network diagram (Cellular Overview), complete regulatory network diagram (Regulatory Overview), or Omics Dashboard. All of these tools can display one type of omics data at a time, with the exception of the Cellular Overview, which can display two types of omics data at a time (e.g., transcriptomics and metabolomics).
-
•
Omics Dashboard
-
•
Paint omics data onto whole metabolic network diagram (Cellular Overview)
-
•
Paint omics data onto multi-pathway diagrams (pathway collages)
-
•
Paint omics data onto individual pathways
-
•
Paint transcriptomics data onto whole genome diagram (Genome Overview)
-
•
Paint transcriptomics data onto whole regulatory network diagram (Regulatory Overview)
Analytical tools:
-
•
Enrichment analysis
-
•
Pathway covering analysis
-
•
Pathway perturbation score analysis
-
•
MultiOmics Explainer
-
•
SmartTable analysis
6.1 Visualization: Omics Dashboard
The Omics Dashboard [124] is a novel tool for interactive exploration and analysis of omics data sets through a hierarchy of cellular systems. At its highest level the Dashboard contains panels for cellular systems such as biosynthesis, energy metabolism, and cellular processes (see Figure 13). Each panel contains a series of X–Y plots depicting the amalgamated expression levels of genes (or quantities of metabolites, in the case of metabolomics data) within the subsystems of that panel. For example, the Response to Stimulus panel includes plots for its component subsystems starvation, DNA damage, osmotic stress, and others. Clicking on any plot shows an expanded panel for that subsystem composed of either (a) plots for its component subsystems, if component subsystems are defined, or for “leaf” subsystems (b) a graph of omics data values for all genes (or metabolites) in the subsystem. For example, clicking on the Amino Acid Biosynthesis plot in the Biosynthesis panel brings up a panel consisting of plots for each individual amino acid. Clicking on the methionine biosynthesis plot then shows a graph of all the genes involved in methionine biosynthesis. This organization allows a user to quickly understand the broad behaviors of systems of interest, and then successively focus in on more specific areas of function. The set of systems and subsystems represented in the Omics Dashboard is derived from ontologies within Pathway Tools, primarily the pathway ontology and GO.
In addition to panels and plots, the Omics Dashboard also provides access to pathway diagrams painted with omics data, diagrams showing the operon organization of all genes within a given biological system and plots of all known regulators for the genes within a given system. It is highly customizable, both in terms of appearance and content. Enrichment analysis (using the hypergeometric distribution) is also supported. Data for the Omics Dashboard and other omics analysis tools can come from a previously loaded data set, a text file, or from a SmartTable.
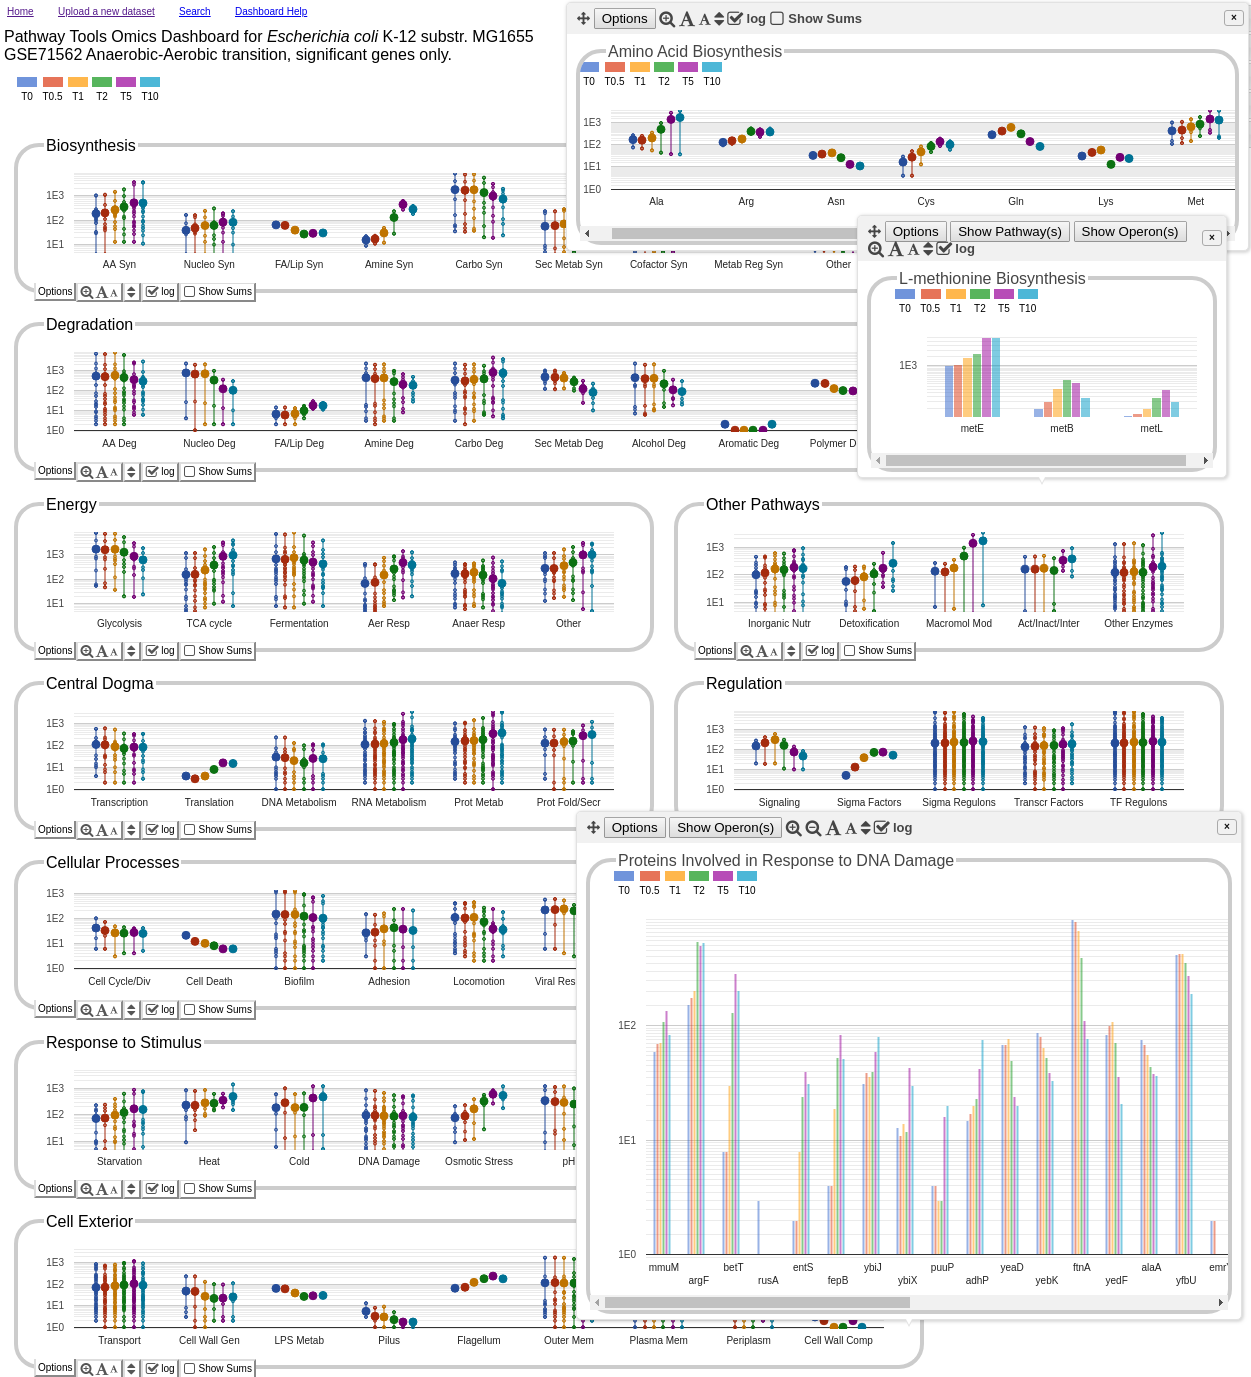
6.2 Visualization: Cellular Overview
Transcriptomics, proteomics, metabolomics or reaction flux data can be painted onto the Cellular Overview diagram (see Section 5.4, as shown in Figure 8, in order to visualize the results of an omics experiment on the full metabolic network. This tool places the data in a pathway context to enable the user to discern the coordinated expression of entire pathways (such as the TCA cycle) or of important steps within a pathway. When the experiment contains multiple data columns, such as in a time series experiment, it can be played as an animation. Omics pop-ups show all time points for particular reactions or metabolites of interest. The display includes histograms showing the data distribution for each time-point. The color scheme is highly customizable, with users able to interactively adjust color bin cutoffs, and selectively show or hide data ranges of interest. Omics data may be loaded from a data file, GEO data set, or SmartTable. In the desktop software, data may also be imported from Metabolomics Workbench.
At most two omics data types at a time can be combined in one invocation of the tool:
-
•
Either transcriptomics, proteomics, or reaction flux data, which are mapped to edges of the diagram
-
•
Metabolomics data, which is mapped to nodes of the diagram
6.3 Visualization: Pathway Collages
The amount of information in the Cellular Overview can be overwhelming. To focus on a smaller set of pathways, the user can build a pathway collage diagram from a specified set of pathways of interest, and overlay the data on that diagram. The diagram accepts transcriptomics, proteomics, reaction flux, or metabolomics data. See Section 5.8 and Figure 12 for more details.
6.4 Visualization: Individual Pathways
Omics data can be viewed on individual pathway diagrams via omics pop-ups, as shown in Figure 4. This tool accepts transcriptomics, proteomics, reaction flux, or metabolomics data.
6.5 Visualization: Genome Overview
In the desktop Pathway Tools, transcriptomics data, but not metabolomics data, can be painted onto the Genome Overview diagram (see Section 5.6 and Figure 11). Each gene within the diagram is colored according to its transcript level, enabling perception of genome-oriented patterns in gene expression.
6.6 Visualization: Regulatory Overview
Transcriptomics data alone can be painted onto the regulatory overview diagram (see Section 5.5 and Figure 10, to view the system-level impact of different transcription factors on gene expression. Each gene within the diagram is colored according to its transcript level, enabling users to correlate gene expression patterns with regulatory relationships.
6.7 Analysis: Enrichment Analysis
Enrichment analysis is a statistical technique for analysis of transcriptomics data and metabolomics data. For metabolomics data, the method determines whether the set of input metabolites (e.g., those metabolites whose abundances were significantly changed) contains more metabolites from a given metabolic pathway (meaning the metabolites are reactants and/or products in the pathway) than one would expect to occur by chance, i.e., is the metabolite set statistically enriched for particular metabolic pathways?
For transcriptomics data the method determines whether the set of input genes was statistically enriched for particular metabolic pathways in which the gene products act as enzymes. Furthermore, the method can determine whether the input genes were statistically enriched for genes in particular Gene Ontology categories [56], or whether the input genes were statistically enriched for particular regulators — for example, did the input genes contain more genes regulated by a particular transcriptional regulator than one would expect to find by chance?
6.8 Analysis: Pathway Covering
Pathway Covering is a new approach to interpreting metabolomics data, available in the web version of Pathway Tools [109]. It addresses the same general question as enrichment scores of pathways for compounds, but takes an approach based on set theory rather than a statistical model such as the hypergeometric distribution. It takes a list of metabolites as input, and as output it reports a set of pathways that includes all metabolites in an input list as substrates (inputs, outputs or intermediates). The set returned by Pathway Covering will always be a minimum cost solution. Each pathway has a “cost” that is calculated by a user selected cost function. The sum of the costs of each pathway is the cost of a pathway- covering solution set. The set of pathways returned will have the lowest total cost (through other possible sets may have the same cost).
Pathway Tools provides five cost functions for use with Pathway Covering:
-
•
Constant — This returns a fixed value for all pathways
-
•
Pathway Size — This returns the number of reactions in the pathway
-
•
Biosynthesis Preferred — This starts with the number of reactions in the pathway, then reduces the cost by a factor of two if the pathway is classified as a biosynthesis pathway in the MetaCyc pathway ontology.
-
•
Compound Sparseness — This considers all the substrate metabolites of a pathway and divides the number of substrate metabolites that were not in the input set by the number that were in input set. Because this is a cost function, returning large values for low proportions of compounds in the input set is appropriate.
-
•
Pathway Harmony — This loosely approximates the notion of pathway flux. It is sensitive to the direction of change in compound abundance. It takes all the compounds associated with the pathway and divides them into three groups: input compounds, output compounds, and intermediates. The function gives low scores if all or a majority of compounds in a group are changed in the same direction.
Pathway covering typically generates a different set of pathways than an enrichment, which ignores whether every metabolite is included in the result. Some weighting functions, e.g., Pathway Harmony, will also make use of the direction of change of a metabolite between a pair of experimental conditions.
Pathway Tools reports the set of covering pathways as a table. The table additionally includes, the subset of the user supplied compounds that are covered by each pathway, and a thumbnail showing the location of each user-supplied compound in the pathway that contains it. An example report page is shown in Figure 14.
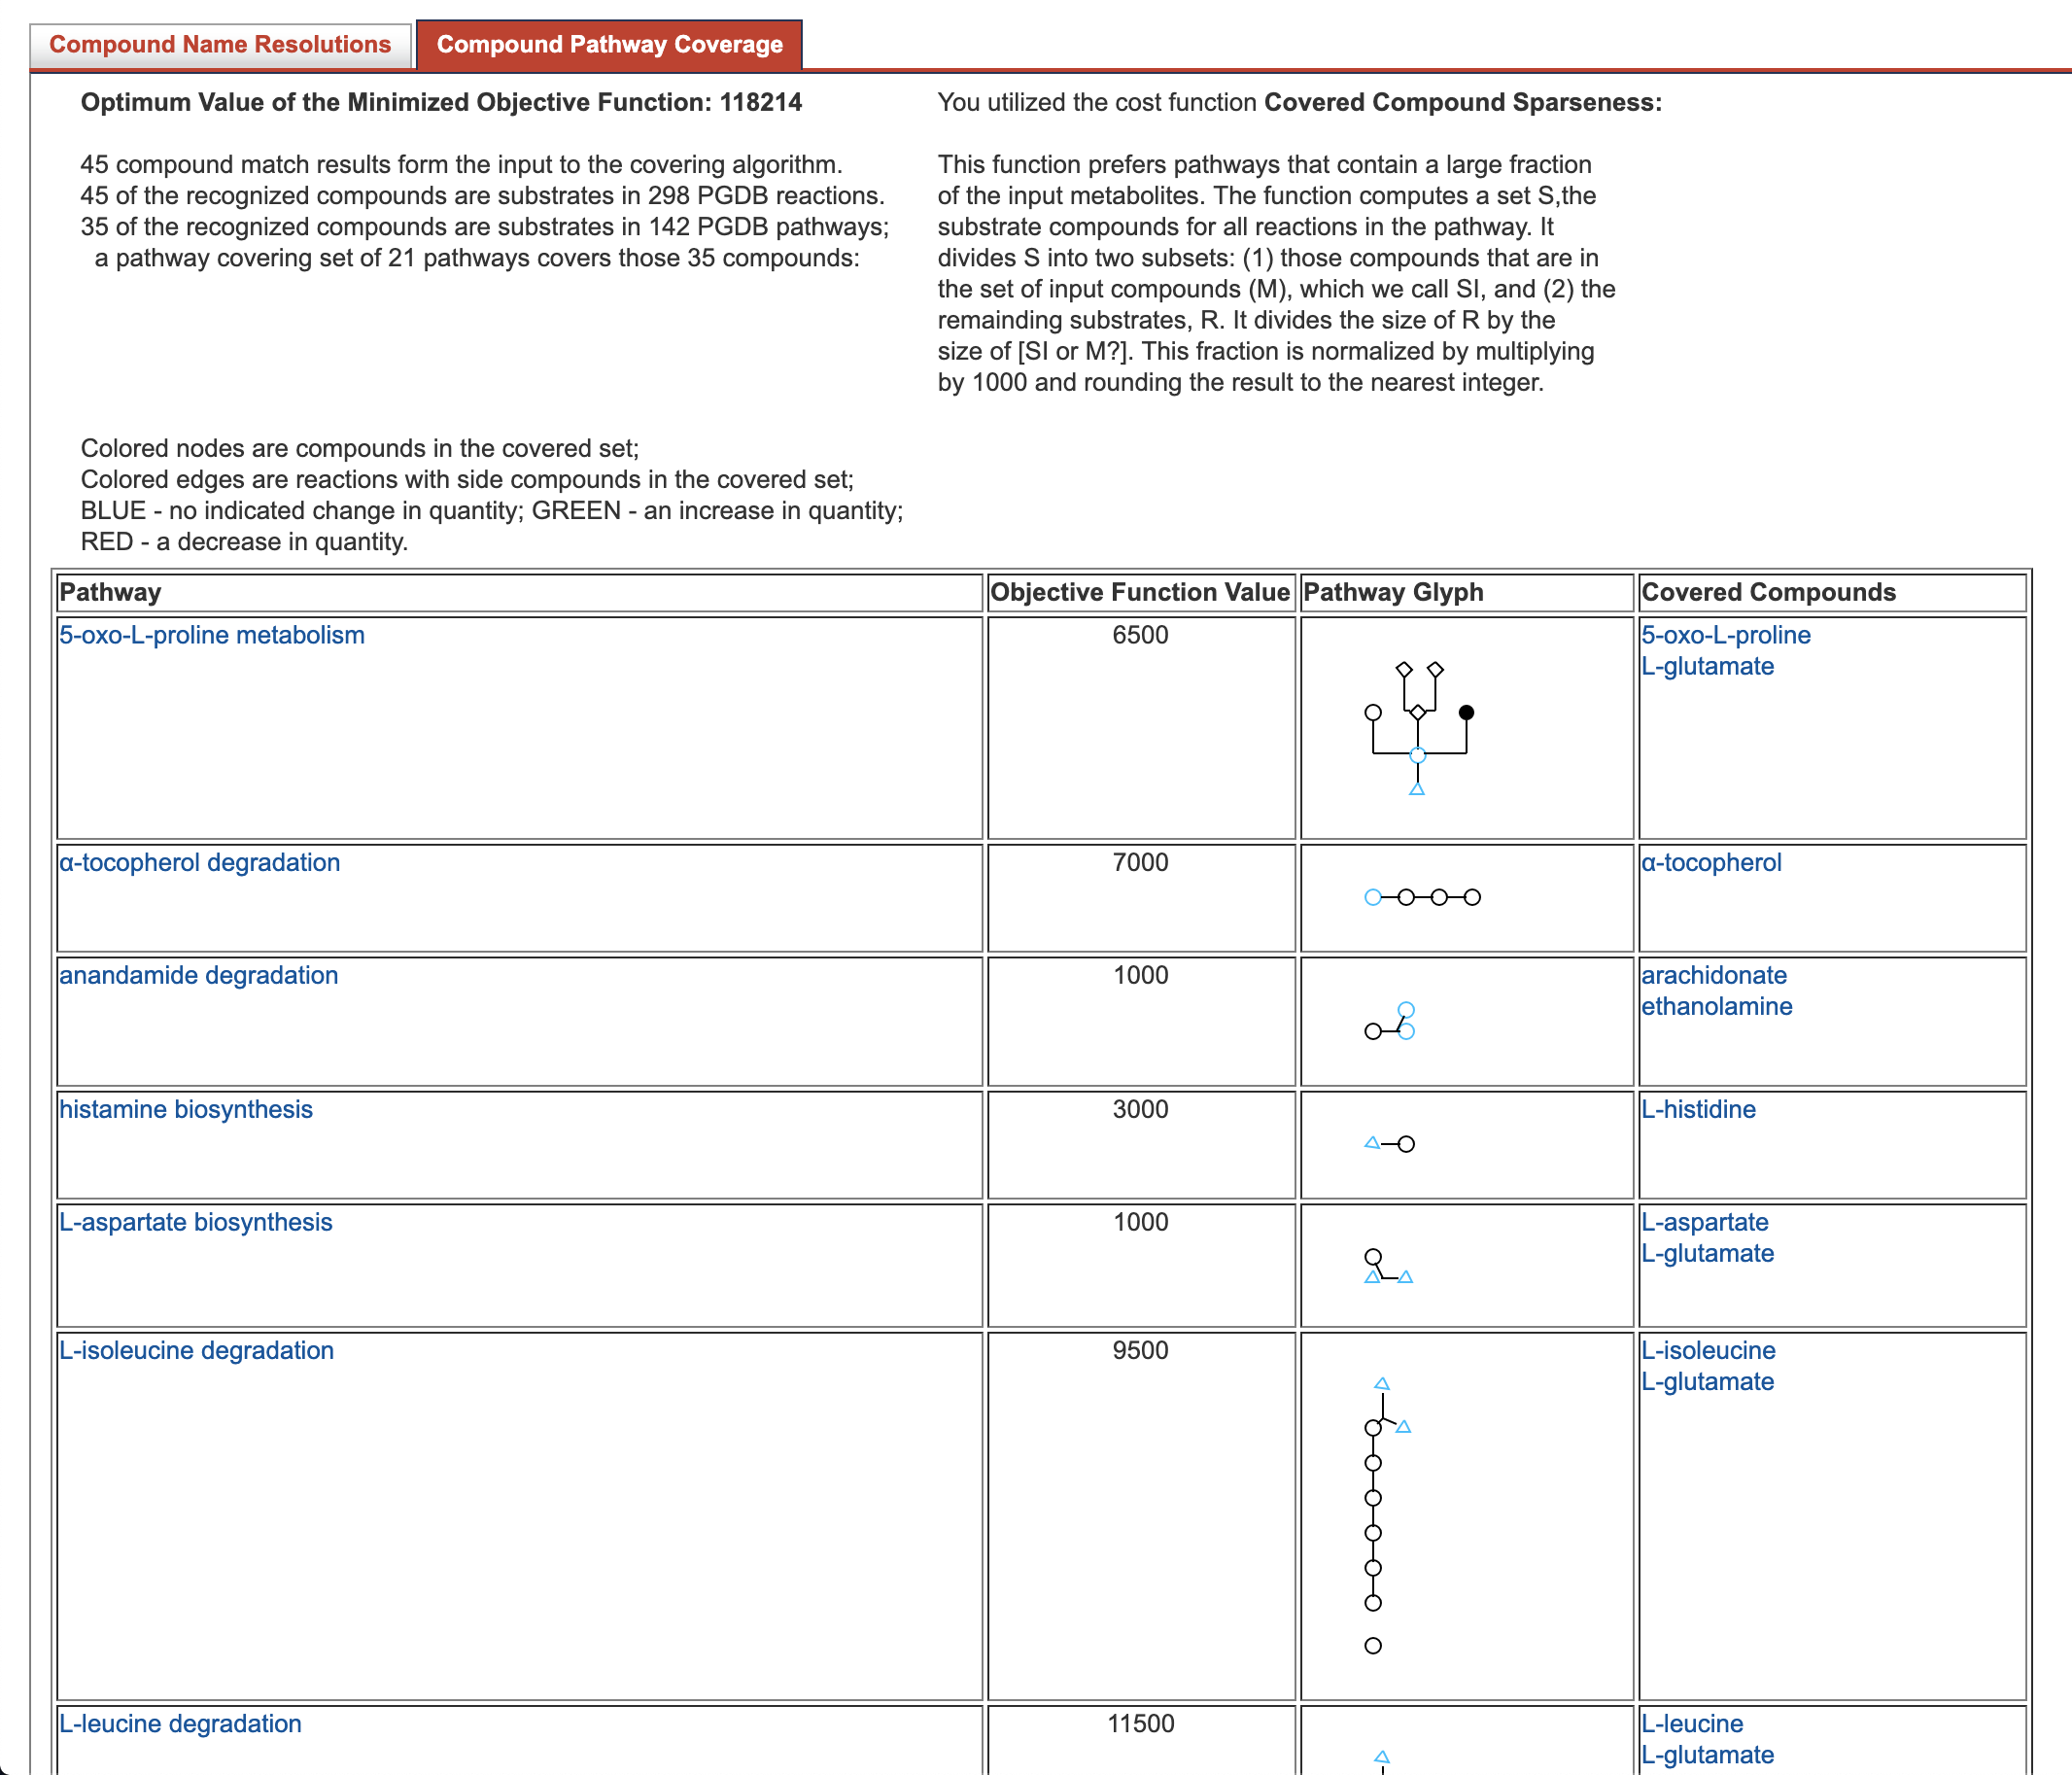
6.9 Analysis: Pathway Perturbation Score
In additional to visualization, and pathway covering for omics data, Pathway Tools provides another way to assess which pathways are affected by an omics experiment. Pathway Tools can compute a pathway perturbation score (PPS) for each pathway with omics data at a single time-point. The PPS attempts to measure the overall extent to which a pathway is expressed by averaging the level of deviation from zero (after log transformation) over all the reactions in the pathway. For omics data representing a time series, the Differential Pathway Perturbation Score (DPPS) measures the extent to which a pathway exhibits change between time-points. Pathway Tools can use omics data from either gene expression or metabolite abundance to calculate these scores, we have not attempted to validate that the perturbations scores are consistent between gene and metabolite data in such mixed sets.
The Pathway Perturbation Score is based on the sum of the perturbation scores for each reaction in the pathway — the reaction perturbation score ( for each reaction in the set of reactions ). The reaction perturbation score in turn looks at each object associated with the reaction (e.g., genes for gene expression data, or compounds for metabolomics data). The perturbation score is a measure of deviation from zero across the participants or genes in the reaction. For each object, the data value is log transformed (if it was not previously) and then from the set of values for the reaction, the absolute values are computed and the largest absolute value is the reaction perturbation score.
| (1) |
Where refers to the data representing the level of each “gene or metabolite” that is associated with (expressed as membership) of the reaction . The pathway perturbation score is the root mean square of the reaction perturbation scores, or:
| (2) |
Where is the number of reactions in the pathway.
When the data is a time series, the Differential Pathway Perturbation Score (DPPS) is used to capture the overall magnitude of pathway activity change across time points; pathways with high DPPS scores exhibit stronger changes. The calculation is similar to the PPS except that the values for each component (gene, compound) associated with a reaction is the difference of the maximum and minimum value observed in the time series rather than a deviation from a baseline.
| (3) |
Where for each reaction is
| (4) |
and for each gene or metabolite associated with the reaction is
| (5) |
is the range of time points in the data set and refers to the value of a gene or metabolite at a time-point .
Pathway Perturbation Scores are displayed as a table with pathways sorted by decreasing PPS or DPPS depending on whether the data is a time series. The table for time series data includes a graph of the PPS at each time point as well as the DPPS across all time values. An example is shown in Figure 15.
A limitation of the PPS and DPPS is that they do not take into account the consistency of expression changes, e.g., if a regulator increased in expression, and the expression of a protein that was negatively regulated by also increased, this could be viewed as an inconsistency.
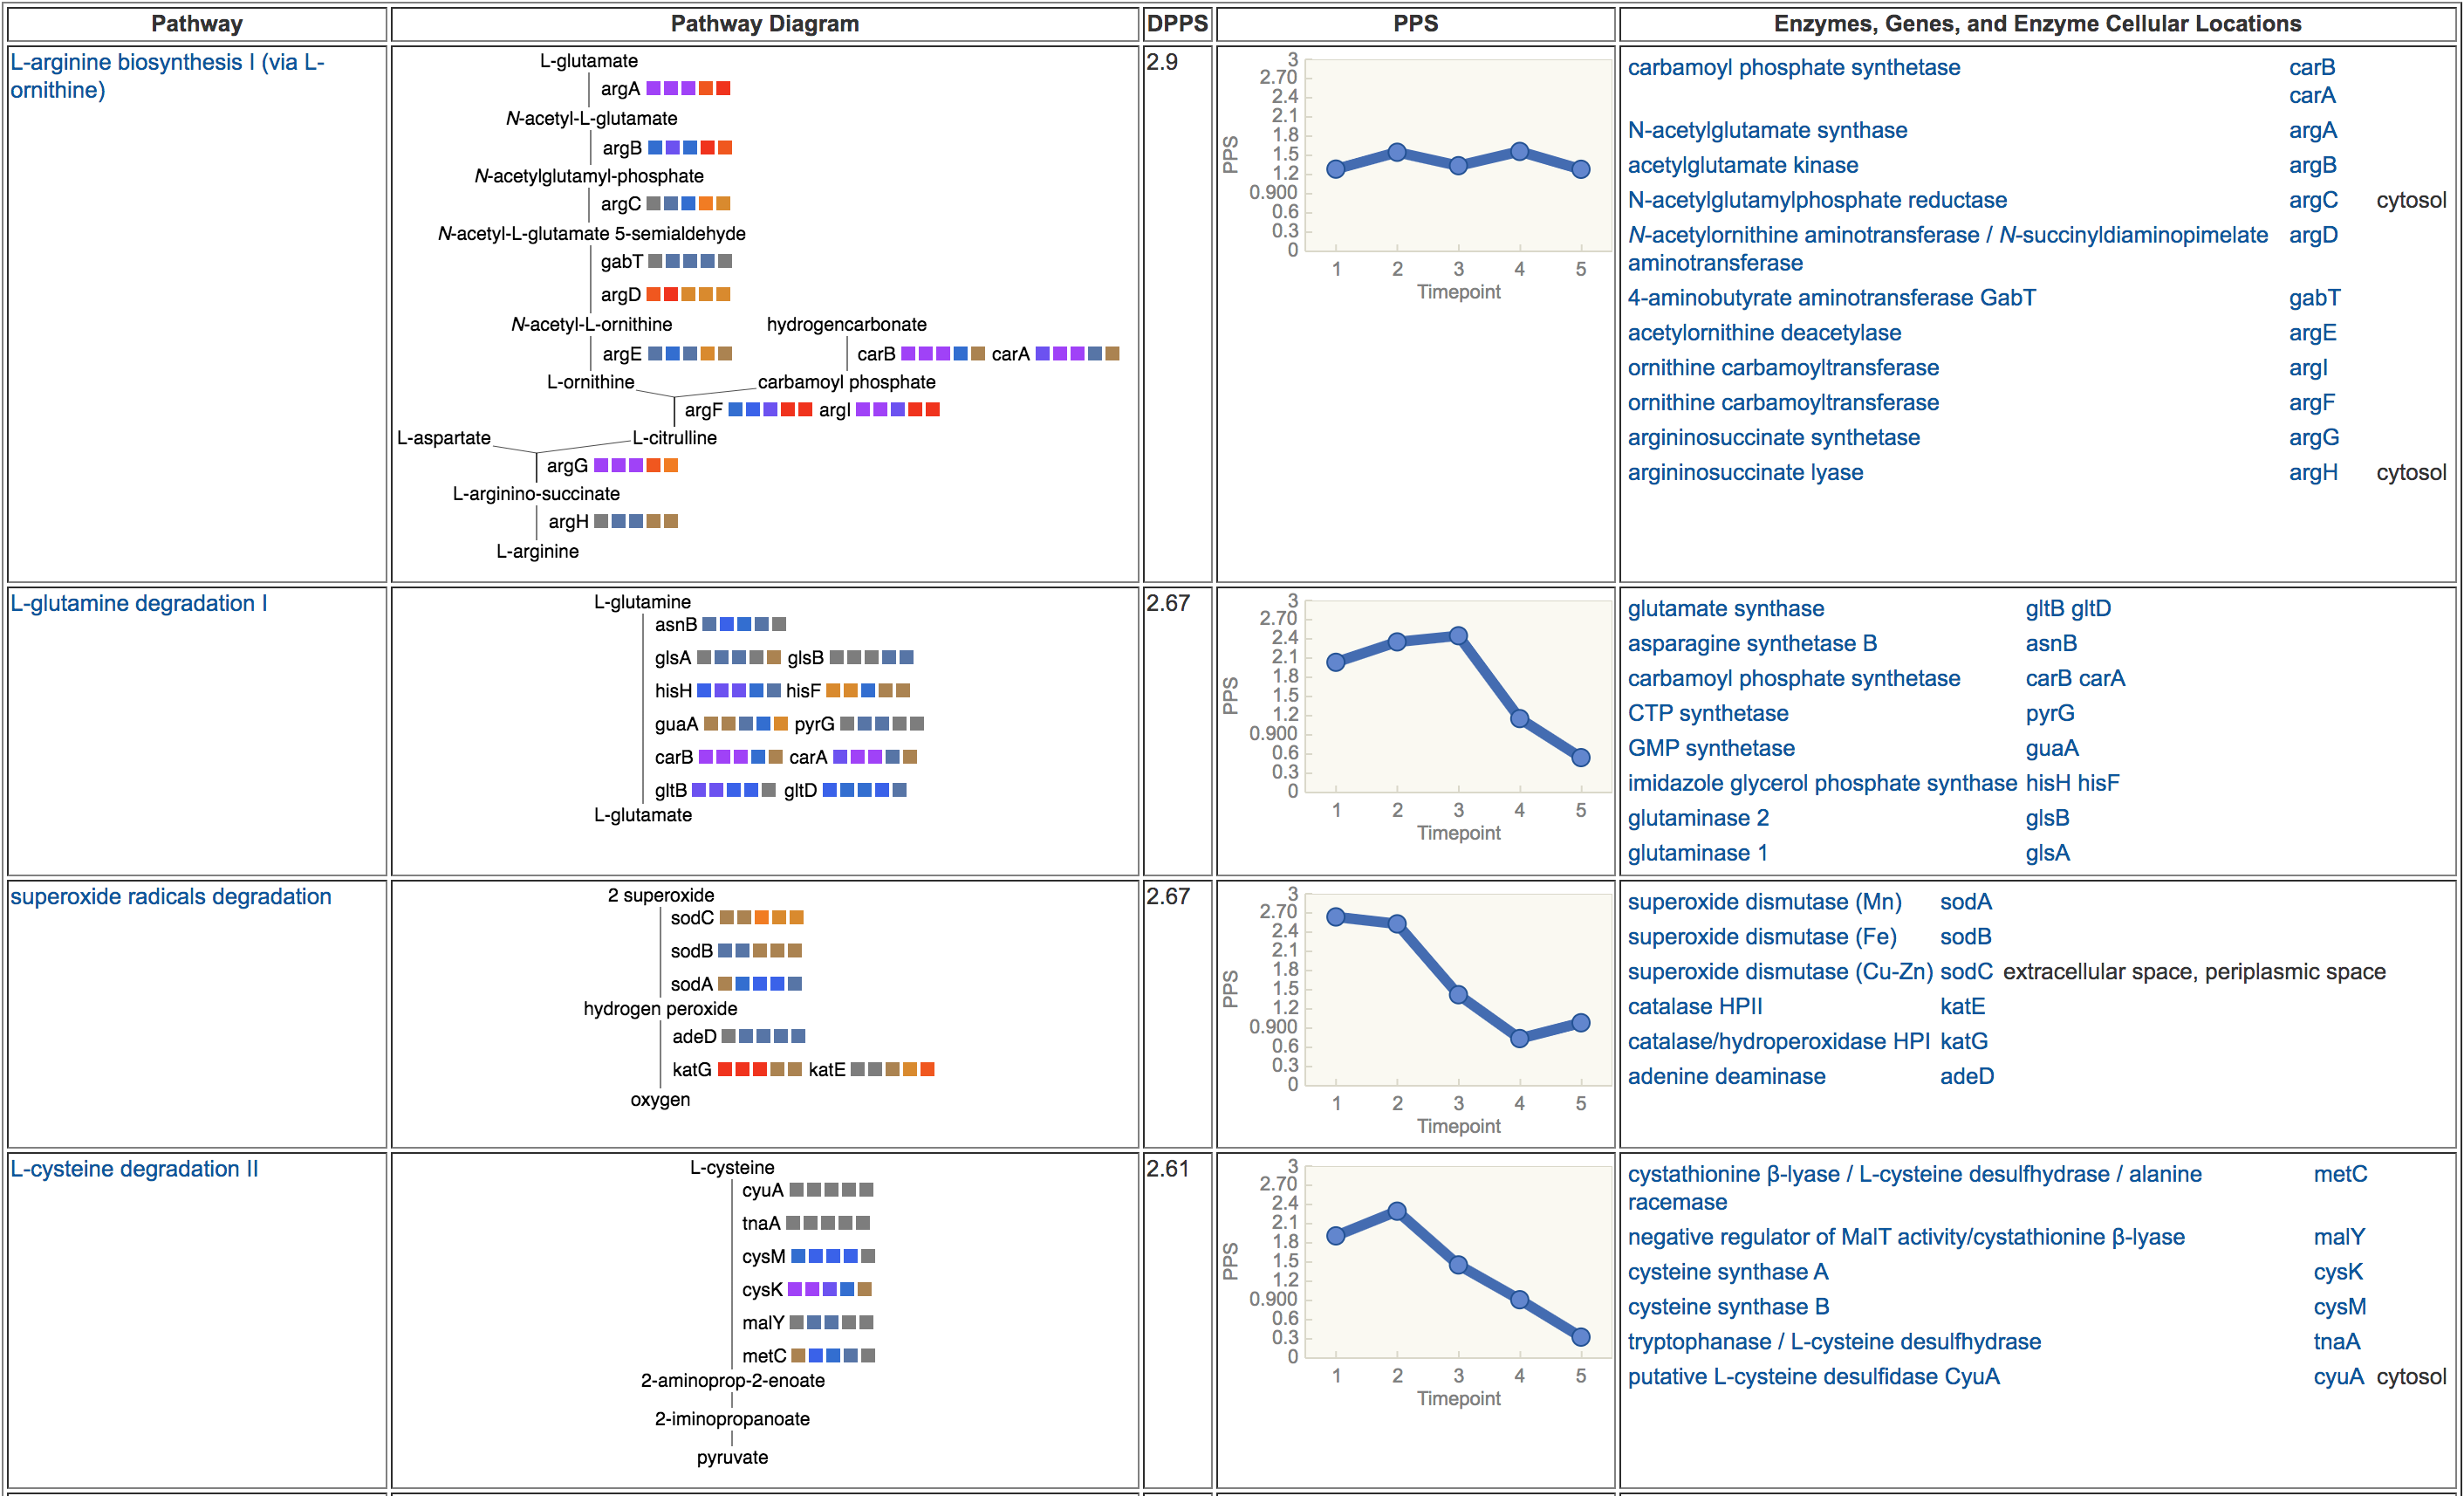
6.10 Analysis: MultiOmics Explainer
High-throughput experiments can reveal associations between genes, proteins, and/or metabolites whose source is not immediately obvious to researchers, but which can be explained by existing knowledge. The MultiOmics Explainer is available only in the desktop software, and leverages what is known about an organism’s metabolic and regulatory network to suggest explanations for some of the results of omics experiments (see Figure 16). Its goal is to speed understanding of experimental results, find explanations that scientists might otherwise overlook, and aid researchers in differentiating which effects can and cannot be explained by existing knowledge.
Given a small number of effect entities (genes, proteins or metabolites), the tool constructs a network of known influences on those entities. If one or more condition entities (for example, a knocked-out gene or a changed metabolite in the medium) are supplied, the tool attempts to find causal paths in the network that connect the conditions to the effects. If no condition entities are supplied, then the tool attempts to identify common influencers (for example, a regulatory gene) that can be linked to the effect entities. The output of the MultiOmics Explainer is an interactive diagram that illustrates one or a small number of possible routes by which the condition entities, or common influencers, influence the effect entities.
The combined metabolic and regulatory network used by the MultiOmics Explainer comprises a set of interactions assembled from an organism’s: a) metabolic, transport, and protein modification reactions; b) enzymes and enzyme activators, inhibitors and cofactors; c) transcriptional regulators such as sigma factors, transcription factors, and the small molecules that bind them; and d) translational regulators such as attenuators, regulatory proteins and RNAs, and small molecule riboswitches. The MultiOmics Explainer is unique in the wide range of potential causal relationships it considers, reflecting the depth and richness of the Pathway Tools ontology.
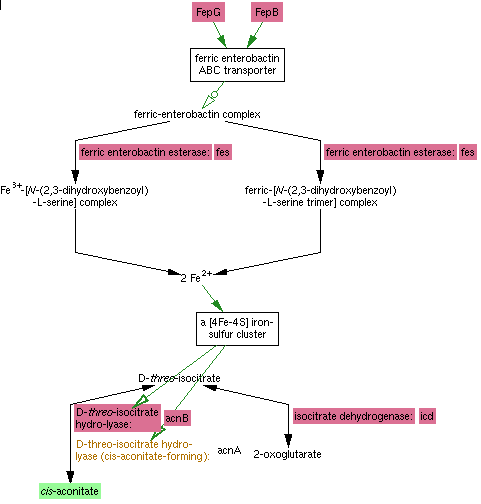
6.11 Analysis: SmartTables
As described in Section 5.3, SmartTable transformations, such as transforming a set of differentially expressed genes or metabolites to the full set of reactions or pathways they participate in, are a convenient tool for the analysis of such data.
7 Computational Access to PGDB Data
In addition to the user-friendly graphical interfaces to PGDBs provided through the web and desktop versions of Pathway Tools, the software supports multiple methods for importing and exporting data from files and via programmatic interactions, which are summarized in Figure 17.
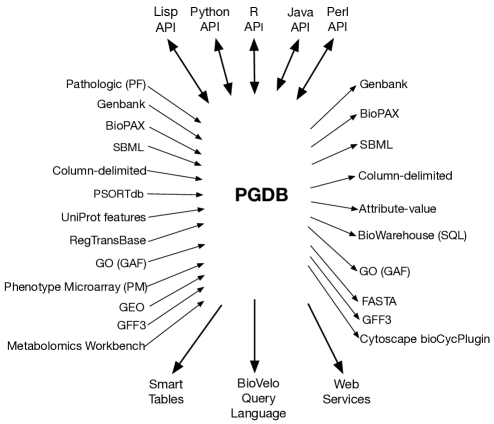
Programmatic Access through Application Programming Interfaces (APIs). Programmers can access and update PGDB data directly [97, 136] by writing programs in the Python, R, Java, Perl, and Common Lisp languages. R, Java, and Perl queries are executed using systems called RCyc [137], JavaCyc [71], and PerlCyc [132].
PythonCyc is a Python package that enables programmatic access to Pathway Tools. The package provides the basic functions to access and modify the data of any PGDB. It also exposes more than 150 functions of Pathway Tools, among them, the MetaFlux module. The PythonCyc package is hosted on GitHub and is a separate installation from Pathway Tools. A full API documentation and a tutorial is available online. Please consult the URL [135] for access to the package, the API documentation and the tutorial.
Data Import Formats. Pathway Tools can import data from many sources into a PGDB. First of all, PathoLogic can create or update a PGDB based on a PathoLogic Format (PF) [69] or GenBank file [55]. A PGDB can also be populated from an SBML [68, 142] or BioPAX [17, 49] file. The SBML Import tool will read SBML level 3 files only and is currently limited to SBML files for prokaryotes. If the provided file is an FBA SBML file, an option to write an FBA file after the import is complete will be enabled. The resulting .fba file can then be run using MetaFlux. Bulk updating of various data items can be accomplished by a simple tab-delimited table format.
Several specialized data types are also supported. The following sources can be imported for proteins. UniProt sequence annotation features [161] can be fetched from a Biowarehouse [103] server that was loaded with SwissProt and TrEMBL. GO (Gene Ontology) annotations can be loaded from a GAF [7, 58] file. PSORTdb [172] cellular localization data can be imported from tab-delimited files.
Gene regulatory data can be imported from RegTransBase [30], which is a SQL database. Growth conditions versus growth media can be imported from Phenotype Microarray (PM) [20, 21] files. High-throughput expression data can be obtained from NCBI GEO [11]. Metabolite abundance data can be obtained from Metabolomics Workbench [154].
File Export Formats. Pathway Tools can export PGDBs into several file formats that we have developed, which include tab-delimited tables and an attribute-value format (see [127]). Pathway Tools can also export subsets of PGDB data to other common formats including SBML [68, 142], BioPAX [17, 49], GO (in the GAF format) [7, 58], GenBank [55], GFF3 [57], and FASTA [50]. The bioCycPlugin for Cytoscape [16] makes use of web services in conjunction with BioPAX, to select and export pathways into the Cytoscape environment. An SBML file for flux balance analysis modeling can be generated by providing a MetaFlux FBA file. Generated SBML files are Level 3 version 1 with flux balance constraints (fbc) package version 2.
Export for Relational Database Access via BioWarehouse. For scientists who want to query PGDB data through a relational database system, the attribute-value files exported by Pathway Tools can be loaded into SRI’s BioWarehouse system [103]. BioWarehouse is a MySQL-based system for integration of multiple public bioinformatics databases. PGDB data can be queried through BioWarehouse alone or in combination with other bioinformatics DBs such as UniProt, GenBank, NCBI Taxonomy, ENZYME, and KEGG.
Queries Using the BioVelo Query Language, and Web Services. Pathway Tools provides a powerful database query language for PGDBs, called BioVelo [156, 18]. BioVelo queries can be issued through an interactive web form, and through APIs.
Pathway Tools web services [130] enable programmatic retrieval of numerous data types, based on submitted HTTP GET or POST commands, and have expanded substantially in recent years. Users can access BioVelo queries, a Metabolite Translation Service, and can also invoke omics visualization services and SmartTable manipulations via web services. Services for SmartTables include creation, retrieval, copying, and deletion; applying many transformations; and changes like adding and deleting rows, columns and cells.
8 Graph-Based Metabolic Network Analyses
This section describes Pathway Tools modules for performing graph-based analyses of metabolic networks.
8.1 Metabolic Route Search Tool (Web Only)
RouteSearch [99] is a Pathway Tools component that enables the exploration of the reaction network of a PGDB, and engineering of new metabolic pathways. RouteSearch computes optimal metabolic routes (that is, an optimal series of biochemical reactions that connect start and goal compounds), given various cost parameters to control the optimality of the routes found. RouteSearch can display several of the best routes it finds using an interactive graphical web page (see Figure 18 for an example).
When RouteSearch is used in metabolic engineering, it uses the MetaCyc database as its external reaction database for new reactions to include in an organism. The cost for adding one reaction is selected by the user. Typically this cost, an integer, is larger than the cost of using one reaction from the organism. In such a case, a new reaction would be added for a route if it conserve more atoms from the start compound to the target compound. The cost of losing one atom from the start compound is also selected by the user, and it is typically larger than the cost of one reaction from the organism or the external library of new reactions.
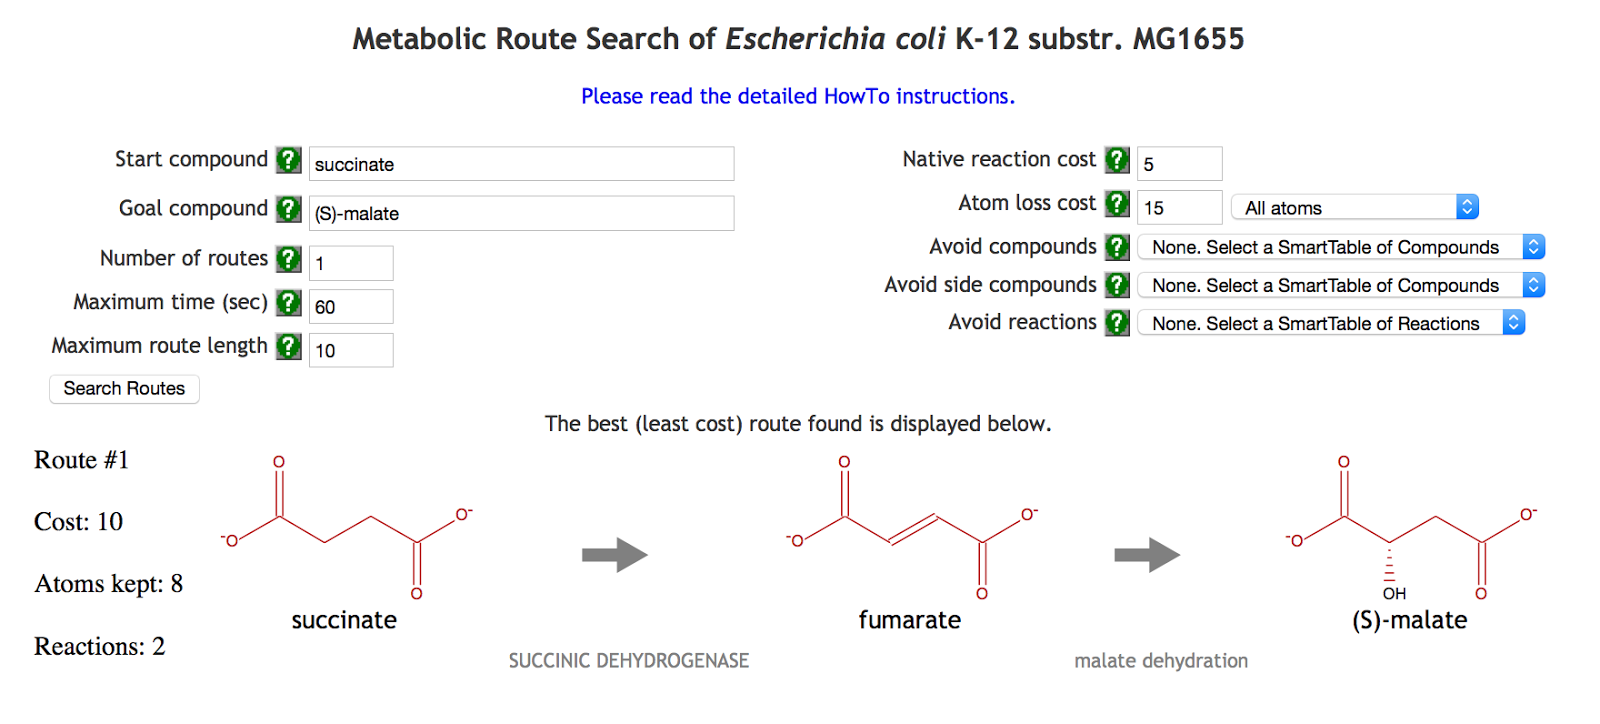
In computing optimality, RouteSearch takes into account the conservation of non-hydrogen atoms from the start compound to the goal compound. The more atoms that are conserved, the more efficient the transformation from start to goal becomes, therefore resulting in a lower cost. To compute the number of conserved atoms, RouteSearch uses pre-computed atom mappings of reactions that are available in MetaCyc. An atom mapping of a reaction gives a one-to-one correspondence of each non-hydrogen atom from reactants to products. RouteSearch is available only in web mode in Pathway Tools.
8.2 Multi-Organism Route Search (Web Only)
Multi-Organism Route Search (MORS) [96] extends our previous single-organism Metabolic Route Search to accept arbitrary sets of organisms, simultaneously, for searching across the union of the reactions in the selected organisms. A typical use case is searching HumanCyc plus the organisms in a microbiome body site, such as the gut, to investigate how a combination of organisms might synthesize a toxic compound, and to see which specific organisms are participating.
Originally, the single-organism Route Search tool would seek the best (least cost) route between user-specified start and goal compounds. A route is a linear series of reactions. The cost of a route involves a weighted combination of the length of the route (number of reactions) and the number of atoms lost from the start to the goal compound (computed using atom mapping information).
The MORS mode adds a multi-organism selector for selecting the set of BioCyc organisms to be searched; the set of reactions searched by MORS will be the union of reactions from that organism set. Additionally, a cost for “organism switching” can be set. A switch occurs when the two organism sets of two consecutive reactions in a route have no overlap. In other words, if the first reaction is known to occur in one set of organisms and the second reaction is occurring in a different organism set, but there is no organism that contains both reactions simultaneously, then the route has to switch organisms by transferring the compound connecting both reactions, from one organism to another (by unspecified transport mechanisms). An organism switch is depicted in a route with a red vertical line. A SmartTable containing the route can be generated, which shows the organism sets containing enzymes that catalyze each reaction along the route.
As an example, let us examine how dietary L-tyrosine is transformed into toxic 4-methylphenyl sulfate, which is a protein fermentation product that has been modified in the liver and is implicated in kidney problems. As it is known that this toxin originates from L-tyrosine [143], the start compound was set to L-tyrosine and the goal compound to 4-methylphenyl sulfate. We selected all organisms in the human microbiome body site called “gastrointestinal-tract” plus Homo sapiens. The total count of organisms was 675. The resulting top two routes are shown in Figure 19. Both routes retain eight atoms. The first route consists of two reactions, and the second of four reactions. The last reaction, after the organism switch, is only found in Homo sapiens. However, the reaction immediately before the switch occurs in 412 organisms in the first route and in 80 organisms in the second.
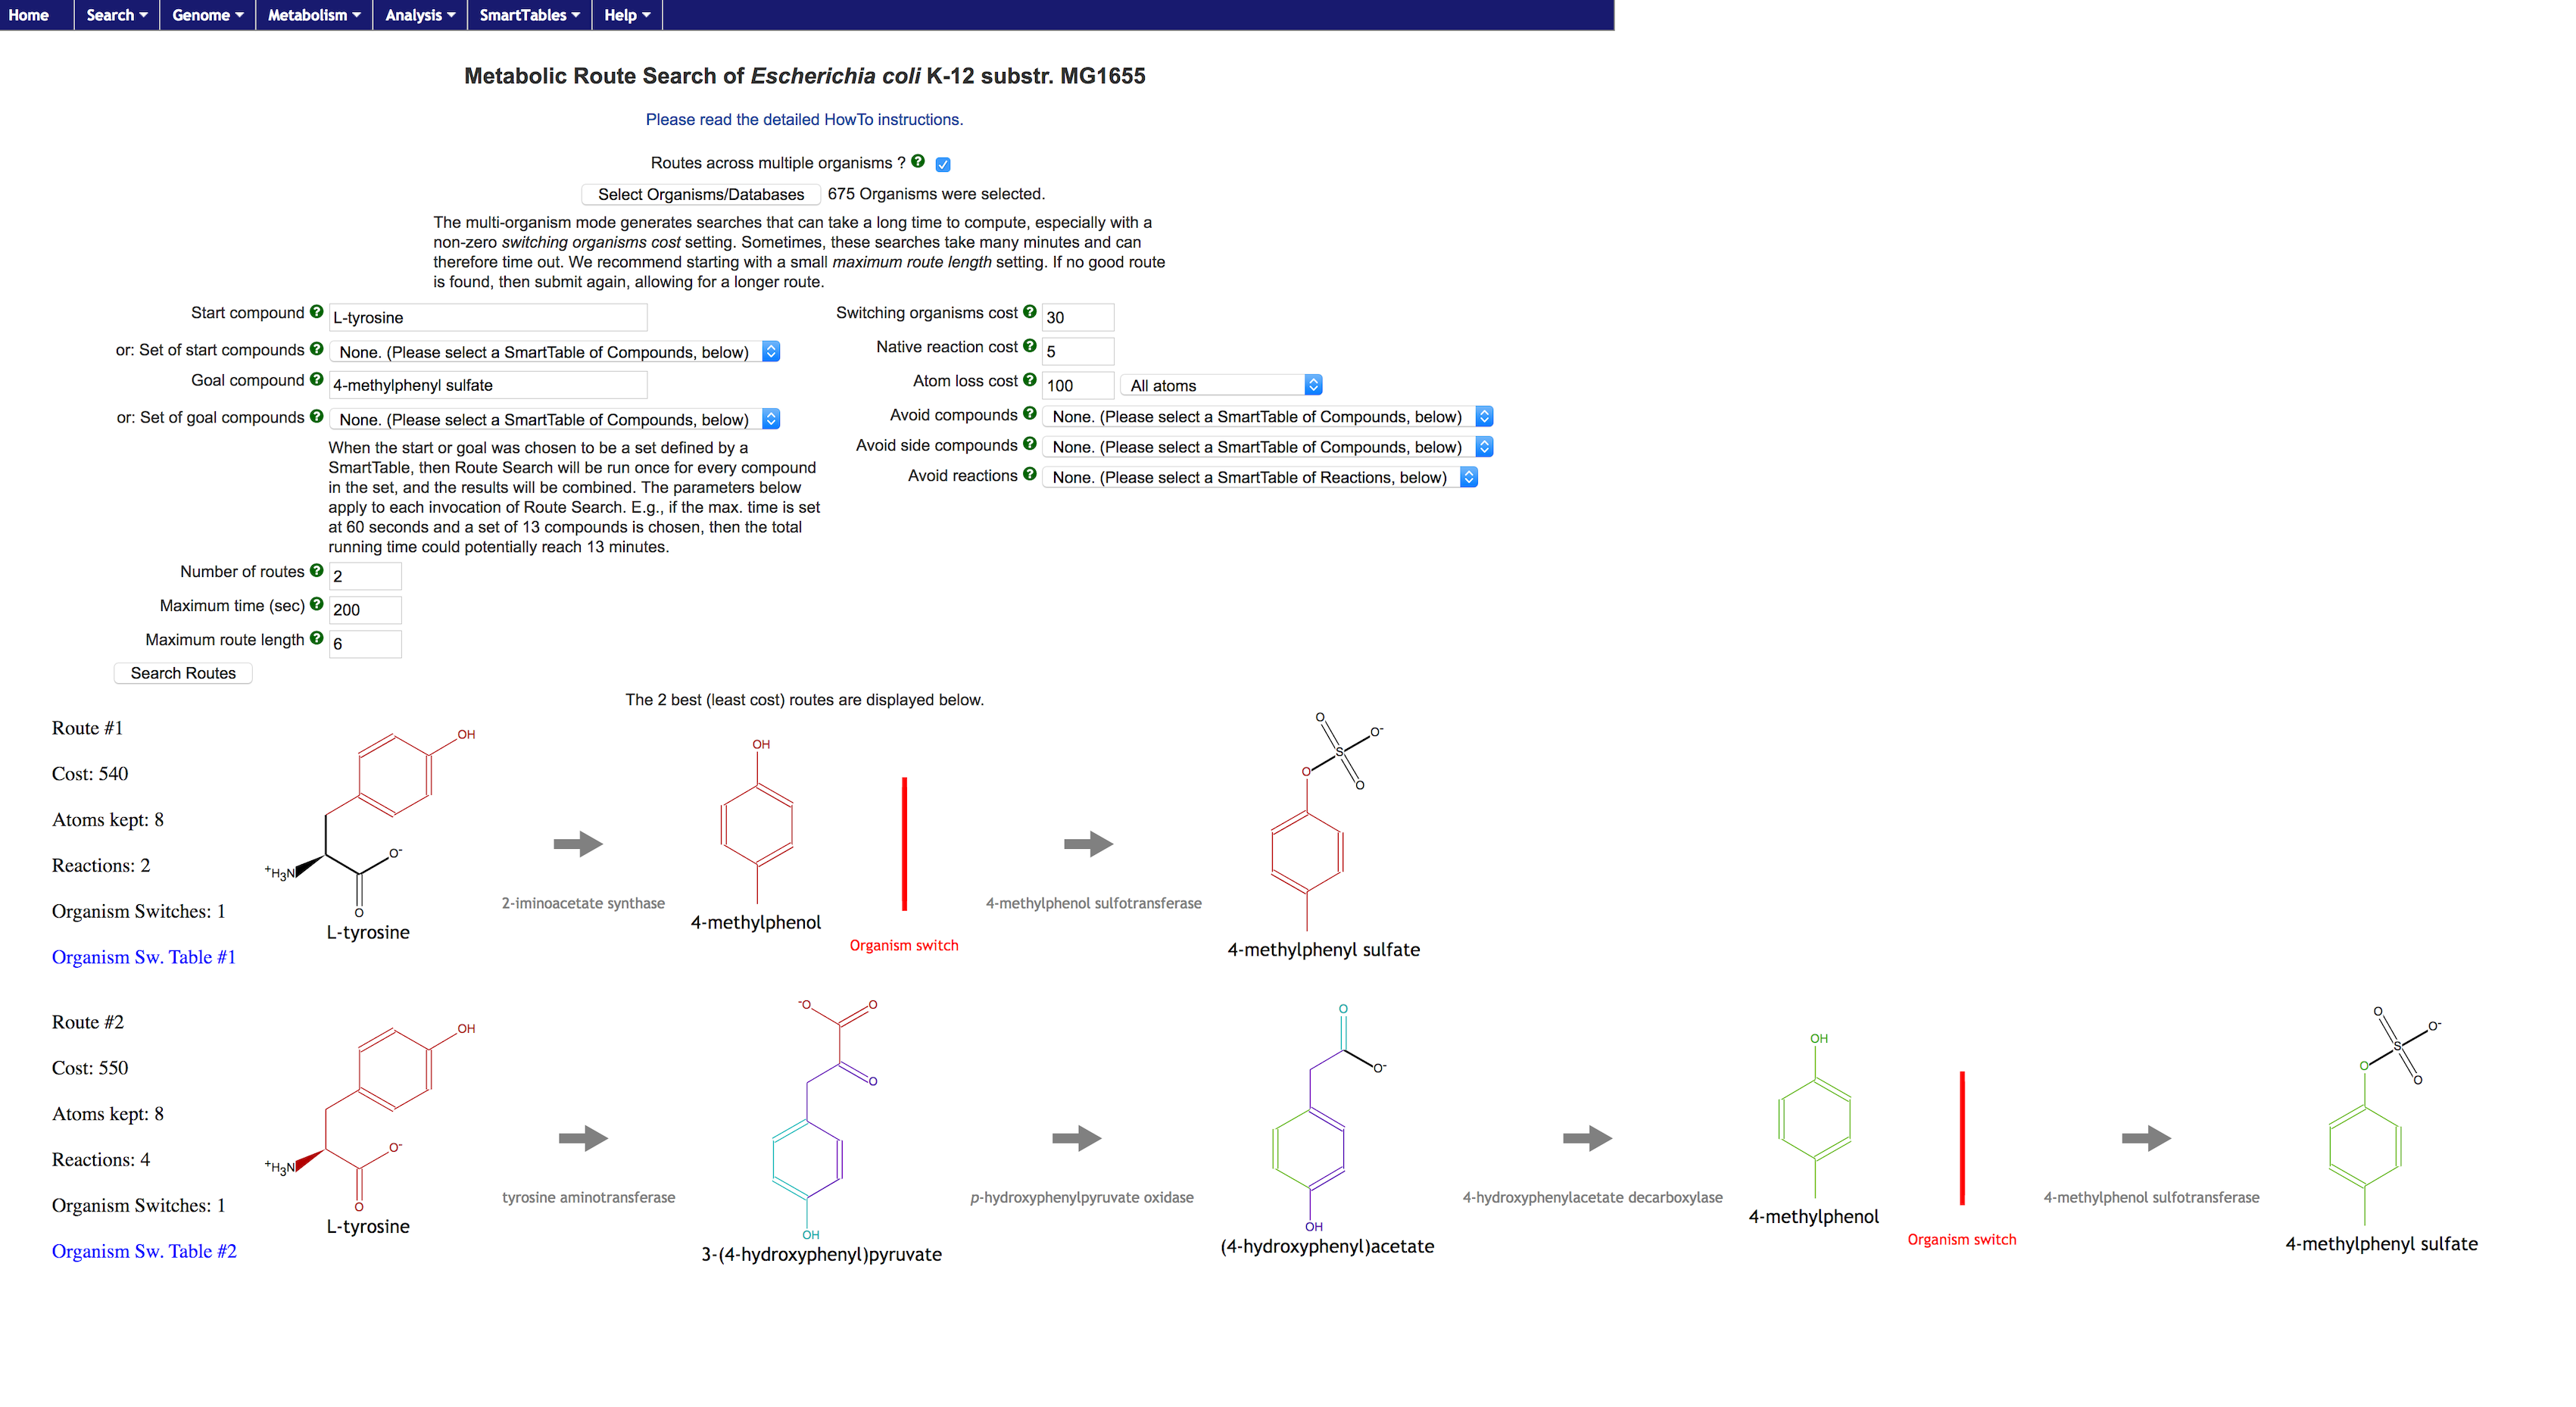
8.3 Dead-End Metabolite Analysis
Dead-end metabolites are metabolites that are only produced by the metabolic network or only consumed by the network. More precisely, the tool for identifying dead-end metabolites will report a small-molecule metabolite as a dead-end metabolite in the cellular compartment if and only if one of the following conditions is true:
-
1.
or parent classes of are only consumed by small-molecule reactions occurring in , and or parent classes of are not transported into .
-
2.
or parent classes of are only produced by small-molecule reactions occurring in , and or parent classes of are not transported out of , and no enzyme in the PGDB uses as a cofactor
8.4 Computation of Blocked Reactions
The MetaFlux component of Pathway Tools computes the blocked reactions in a reaction network (see 11.7.1)—reactions that can never carry flux because of blockages in the network.
8.5 Prediction of Network Choke Points
One application of a metabolic network model is to find network bottlenecks, which, if blocked, could kill the cell. Such bottlenecks could constitute antimicrobial drug targets. We have developed a tool for predicting these so-called choke points.
The Pathway Tools choke point detection algorithm examines the reactions attached to a given metabolite, and processes one metabolite at a time. The first step is to assemble the list of metabolites to examine. This is done by collecting (1) all reactions that are in pathways, plus (2) reactions that stand alone, but which use only small molecule metabolites. The reactions that came from pathways may use some macromolecular substrates, such as proteins that are modified by the reaction. From this list of reactions, the algorithm collects all of their substrate metabolites (meaning their reactant or product metabolites).
Definition [171]: A “choke point reaction” is a reaction that either uniquely consumes a specific substrate or uniquely produces a specific product in a metabolic network, and is also balanced by at least one reaction that respectively produces or consumes that substrate. Specifically, the algorithm searches for two types of choke point reactions: (a) Reactions such that only a single reaction produces metabolite and at least one reaction consumes (b) Reactions such that only a single reaction consumes metabolite and at least one reaction produces These definitions imply that to find a choke point, all reactions involving must be unidirectional. These choke point reactions are collected and returned as the result. Note that the definition excludes reactions directly connected to dead-end metabolites.
The resulting candidate choke point reactions can be painted onto the cellular overview to facilitate further analysis.
9 Comparative Tools
Pathway Tools contains a rich set of operations for comparing the information in two or more PGDBs. These operations range from comparison of genome-related information to comparison of pathway information. These comparisons are of several types.
The comparative genome browser discussed in Section 5.6 displays replicon regions centered on orthologous genes across a set of genomes (see Supplemental Figure 9).
The user can generate a comparative table for a given metabolic pathway across a specified set of organisms. For each organism the table shows the presence of pathway enzymes and operon structures of genes within the pathway.
A global comparison of the metabolic networks of multiple PGDBs can be performed by highlighting on the Cellular Overview diagram (see Section 5.4). This tool enables the user to highlight in the Cellular Overview reactions that are shared, or not shared, among a specified set of organisms.
Finally, a general comparative analysis facility enables the user to generate comparative report tables for many aspects of a PGDB. As well as being used for comparative analyses, these tools can be used to generate statistics regarding the content of a single PGDB. These tools are general in that they present their results in a standard format, and they enable the user to drill down to specific results in a consistent fashion. The initial report page shows summary statistics, but the user can drill down to compare all instances of a category by clicking on elements of a report table.
For example, consider the transporter report page in Supplemental Figure 10. Table 2 within that report summarizes the number of uptake transporters found in two organisms. A user who wants to see the actual transported substrates clicks on the text “Compounds transported into the cell” to generate a new report page containing a table listing the union of all substrates imported by both organisms, along with an indication of which organisms transport each substrate, and which transporter is utilized. If the user clicks on a data cell within Table 2, such as the number of imported substrates in E. coli K-12 (156), a page is generated that lists those substrates only. Similar functionality applies to most tables in these reports.
The following report types are provided. An example comparative report is available at URL [13].
-
•
Reaction report includes the following statistics for each selected organism:
-
–
Number of reactions containing substrates of different types (e.g., reactions for which all substrates are small molecules, and for which some substrate is a protein or a tRNA)
-
–
Number of reactions in each Enzyme Commission (EC) category
-
–
Number of reactions containing different numbers of isozymes
-
–
-
•
Pathway report includes these statistics:
-
–
Number of pathways in each category within the MetaCyc pathway ontology
-
–
Number of pathways with different numbers of pathway holes
-
–
-
•
Compound report includes these statistics:
-
–
Frequency with which different compounds appear in different metabolic roles (substrate, cofactor, inhibitor, activator)
-
–
-
•
Protein report includes these statistics:
-
–
General statistics on number of monomers versus multimeric complexes, breakdown of multimers into heteromultimers and homomultimers
-
–
Statistics on multifunctional enzymes
-
–
-
•
Transporter report includes these statistics:
-
–
Number of efflux versus influx transporters
-
–
Number of genes whose products are transporters
-
–
Number of unique transported substrates, both overall and broken down by efflux versus influx
-
–
Number of transported substrates that are substrates in metabolic pathways or are enzyme cofactors
-
–
Transporters with multiple substrates, and substrates with multiple transporters
-
–
Operon organization of transporters
-
–
-
•
Ortholog report includes these statistics:
-
–
List of all orthologous proteins across the selected organisms
-
–
Proteins that are shared in all selected organisms, or unique to one organism
-
–
-
•
Transcription Unit report includes these statistics:
-
–
Distribution of number of genes per transcription unit
-
–
Distribution of number of operons into which metabolic pathway genes are distributed
-
–
10 Software and Database Architecture
Pathway Tools is mostly implemented in the Common Lisp programming language,222We use the Allegro Common Lisp implementation from Franz Inc., Oakland, CA. with some components implemented in JavaScript and MySQL. We chose Common Lisp because it is a high-productivity programming environment. Because Lisp is a very high-level language, one line of Lisp code is equivalent to several lines of code in a language such as Java or C++. Therefore, the same program can be written more quickly in Lisp, with fewer bugs. A study by Gat found that compiled Lisp programs generally run faster than Java programs, and that a given program can be developed 2–7 times faster in Lisp than in Java [54]. Common Lisp also has a very powerful interactive debugging environment.
Lisp has powerful dynamic capabilities that are illustrated by a Pathway Tools feature called auto-patch. Imagine that a Pathway Tools user site has reported a bug in the software. Once our group has found a fix for the bug, we put a patch file that redefines the offending Lisp function(s) on the SRI website. The next time Pathway Tools is started at remote sites, it automatically downloads the patch (in compiled form) from the SRI website, puts the patch in an appropriate directory, and dynamically loads the patch file into the running Pathway Tools to redefine the altered function(s).
Pathway Tools consists of 790,000 lines of Common Lisp code, organized into 20 subsystems. In addition, 45,000 lines of JavaScript code are used within the Pathway Tools web interface. Pathway Tools runs on the Macintosh, Linux, and Microsoft Windows platforms. Pathway Tools was ported to 64-bit architectures several years ago.
The main bioinformatics modules of Pathway Tools are the Navigator, Editors, PathoLogic, and MetaFlux. PTools also includes a chemoinformatics subsystem that includes tools such as SMILES [168] generation and parsing, a chemical substructure matcher, and a large set of shared utilities that we call the Pathway Tools core. Pathway Tools uses an object-oriented database system called Ocelot. The Pathway Tools user interface relies on a graph layout and display package called Grasper [83], and web and desktop graphics packages called CWEST and CLIM (the Common Lisp Interface Manager). Other software used by and included with Pathway Tools are:
- •
- •
-
•
Lisp: ARNESI; 5am; cl-json; cl-store
- •
Ocelot is an object/relational database management system (DBMS) developed by our group at SRI [75, 79]. Ocelot combines the expressive power of frame knowledge representation systems [76] developed within the AI community (whose object data model is far superior to the relational data model for representing biological data333Superior aspects of the object data model include the following. The object data model is better at managing very complex schemas. That is, if the same domain is represented within the object data and within the relational model, the object schema is usually much more compact and easier to comprehend. One reason is that inheritance enables the object data model to define subclasses by extending existing classes (e.g., the class Polypeptides is a subclass of the class Proteins), whereas the relational model would force attributes shared between the two tables to be duplicated in each, which both obscures the fact that the two tables are related, and complicates schema evolution. Relational normalization also increases the size of the schema by forcing the creation of new tables for every multi-valued attribute, which is not required in the object data model. The object data model used by Ocelot is particularly flexible in supporting any type of schema evolution without forcing the entire database to be reloaded (unlike relational DBMSs), which is important in bioinformatics because the complexity of biological data forces never-ending enhancements to the schema (note that not every object DBMS provides such flexibility).) with the scalability of relational database management systems (RDBMSs). Ocelot DBs are persistently stored within a MySQL RDBMS. Ocelot objects are faulted on demand from the RDBMS, and in addition are faulted by a background process during idle time. Objects that were modified during a user session are tracked and saved to the RDBMS during a save operation. Ocelot uses optimistic concurrency control [79]—during a save operation it checks for conflicts between the updates made by the user and updates saved by other users since the saving user began their session or last made a save operation. This approach avoids the overhead of locking that becomes problematic in object databases because modifications to one object often cascade to related objects and could require a large number of lock operations. The optimistic concurrency control works well in practice because curators tend to focus in different biological areas and therefore rarely update the same objects at the same time.
Ocelot DBs can also be saved to disk files, in which case the RDBMS is not needed (see Figure 20). The file persistence configuration is simpler to use since it does not require installation of an RDBMS. It provides an easy and low-cost way to begin a PGDB project; a project can switch to an RDBMS configuration as its complexity grows. The advantage of an RDBMS configuration is that it provides Ocelot with multi-user update capabilities, and it permits incremental (and therefore faster) saving of DB updates. The RDBMS configuration also enables Ocelot to maintain a history of all DB transactions — DB curators can examine the history of all updates to a given object to determine when a given change was made, and by whom. This functionality is very useful when diagnosing mistakes within a PGDB.
Figure 21 shows the graphics architecture of Pathway Tools. The Grasper graph toolkit is used in pathway layouts, and in the cellular overview and regulatory overview. Grasper graphics, and all other graphics generated by Pathway Tools, are rendered using the Allegro CLIM Common Lisp graphics system, which is implemented using the X window system on Linux and Mac, and the native Windows API on Windows. When Pathway Tools runs as a desktop application, CLIM graphics directly update the user’s screen.
Pathway Tools can also run as a web server, which is how it powers websites such as BioCyc.org. Pathway Tools does not run with an associated HTTP server such as Apache. Instead, Pathway Tools provides a fully functional AllegroServe web server that includes services such as compression and connection keep alive. HTTP servers typically start a new operating-system process for each incoming web request that terminates after the request has been serviced. In contrast, Pathway Tools starts one long-lived web server process that can service many thousands of web requests; that process forks an internal thread to service each incoming request.
Pathway Tools processes an incoming web request in the following manner. The top-level directory name within an incoming URL indicates whether the operation is requesting a static file or dynamically generated page.
-
•
Static files: A small number of web pages, such as the home page and informational pages for BioCyc.org, are implemented as disk files. Pathway Tools can serve file-based web pages like a traditional web server.
-
•
Dynamically generated pages: Most Pathway Tools pages are generated dynamically by processing that typically includes querying PGDBs within the Pathway Tools virtual memory and generating query outputs and visualizations, often using the same code as for desktop mode. The CLIM graphics generated by software such as the pathway layout code are dynamically converted to HTML and GIF images using CWEST [122], which uses Skippy to generate GIF images. The resulting HTML and GIF images are returned to the user’s web browser, and the Pathway Tools web server awaits the next query. The GIF images include generated specifications of mouse-sensitive regions and of what operations should be invoked when the user clicks on such a region.
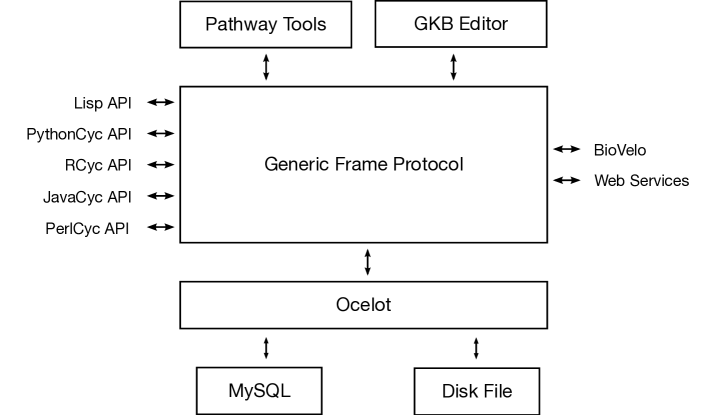
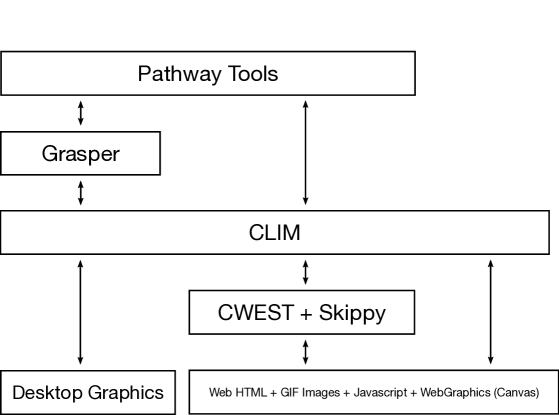
11 Metabolic Modeling with MetaFlux
The MetaFlux component of Pathway Tools is used to develop and execute quantitative metabolic flux models for individual organisms and for organism communities. MetaFlux uses the steady-state modeling technique of flux balance analysis, which can be used to predict the phenotypes of an organism, or a community of organisms, based on a specification of available nutrients in the growth environment.
MetaFlux offers several modes of operation:
-
1.
Solving mode: execute a metabolic model for a single organism or for a community of organisms
-
2.
Development mode: generate hypotheses on how to fill gaps in a developing metabolic model
-
3.
Knockout mode: run metabolic models under gene knockout scenarios
-
4.
Flux variability analysis mode: perform flux variability analysis on a metabolic model and generate a robustness report
MetaFlux can be controlled via a graphical user interface and via a Python API.
The next section provides an overview of metabolic model development using MetaFlux.
11.1 The MetaFlux Model Development Process
Pathway Tools provides a unique environment for the development of metabolic flux models for several reasons. First, it includes a range of tools that support fast and accurate development of metabolic models from annotated genomes. Second, metabolic models developed with MetaFlux are highly accessible to the user, and are coupled with extensive enriching information, resulting in models that are easier to understand and reuse.
The high-level steps for developing a metabolic model from an annotated genome using Pathway Tools are as follows. For more information on the genome-scale metabolic reconstruction process, we suggest the comprehensive COBRA-based [158] overview published by Thiele and Palsson [157].
-
1.
The PathoLogic tool computes a metabolic reconstruction by inferring the reactome of an organism from its annotated genome. By combining the enzyme-name matching tool with the extensive reaction information in the MetaCyc database, we obtain a very complete mapping of annotated enzymes to metabolic reactions.
-
2.
Subsequent inference of metabolic pathways by PathoLogic fills a significant number of missing (gap) reactions, because as well as inferring the presence of pathways, pathway inference also infers the presence of pathway reactions that were not initially identified.
-
3.
The pathway hole filler identifies enzymes that catalyze those pathway-hole reactions. (Note this step is optional and is informative in nature, because it does not modify the set of reactions in the model.)
-
4.
The user can request that MetaFlux compute an initial set of biomass metabolites for the organism. MetaFlux will do so if the organism falls within the twelve taxonomic groups for which MetaFlux has defined biomass compositions, obtained from the experimental literature.
-
5.
The user supplies an objective function and constraints on metabolite uptake and secretion. These can be based on experimental observations of the organism under study, or can be set to arbitrary values to explore the theoretical behavior of metabolism.
-
6.
The MetaFlux gap-filler identifies missing reactions, nutrients, and secretions that enable a model to be solved. It can be run on one compartment at a time to simplify the gap-filling process for eukaryotic organisms. MetaFlux tools for computing blocked reactions and dead-end metabolites identify potential errors and omissions in the metabolic network definition.
-
7.
The reaction network, objective function, and constraints of the metabolic model are adjusted by the user until its predictions match experimental results.
When developing a metabolic model with MetaFlux, the reactions and metabolites within the model are derived from (and stored in) the PGDB. MetaFlux automatically generates the system of linear equations for the model from the PGDB. Thus, to modify the reactions within a model, the user edits the PGDB; to inspect the reactions and metabolites within a model, the user can query the PGDB using the plethora of Pathway Tools query and visualization operations. The entire PGDB/model can be published on a website using Pathway Tools, where, all reactions and pathways that utilize a given metabolite are listed on the Pathway Tools metabolite page for that compound; all model metabolites within a given molecular weight range can be found using metabolite searches; all reactions within a given cellular location or using a given set of reactants and products can be found using reaction searches.
Furthermore, compared to other modeling environments, a metabolic model stored within a PGDB contains extensive additional enriching information. Chemical structures within a PGDB enable reaction mass and charge balancing. Chemical structures and reaction atom mappings aid users in understanding the chemistry of reaction transformations. Pathways arrange reactions into biologically meaningful groupings. Couplings between reactions, enzymes, and genes enable reasoning about the roles of multi-subunit complexes, isozymes, and gene knockouts. Regulatory information supports inferences about metabolic regulation. Model testing and validation are facilitated by PGDB storage of growth media and growth experiment results, and of gene knockout experiment results.
Taken together, the Pathway Tools modeling environment—with its extensive tools for inspecting metabolic model content and its enriching information—renders MetaFlux models significantly easier to understand, learn from, validate through inspection, reuse, and extend than models produced with other metabolic modeling software environments.
11.2 Description of an FBA Model
The description of a flux balance analysis (FBA) model is provided to MetaFlux partly via a text file called an FBA input file and partly via a PGDB. Typically, the FBA file specifies many parameters, but we will describe only the most important ones. Some parameters are only relevant for specific modes of MetaFlux, so that we will present these parameters when describing that mode. All parameter names end with a colon, whereas keyword options for parameters start with a colon. In the following explanation, we omit the colon character to reduce clutter.
11.3 Solving Mode
Solving mode computes flux values for the reactions in the metabolic model given four inputs: a set of nutrient compounds, a set of secreted compounds, a set of biomass metabolites that are synthesized by the cell, and a set of metabolic reactions. The first three inputs are supplied by the FBA file. The set of metabolic reactions are provided by the PGDB, but may be altered by the FBA file. For example, the following file describes a (very simple) FBA model for E. coli:
pgdb: ecoli

reactions:
metab-all           # Include all metabolic reactions of PGDB ecoli.
FUMHYDR-RXN         # Example of including a reaction according to its
                    # PGDB unique identifier.


mal -> fum + water  # Example of including a reaction by reaction equation.

biomass:

CYS[CCO-CYTOSOL] 0.0054
GLN[CCO-CYTOSOL] 0.2987
GLT[CCO-CYTOSOL] 0.2987
GLY[CCO-CYTOSOL] 0.3431

nutrients:

GLC[CCO-EXTRACELLULAR]             :upper-bound 10.0
OXYGEN-MOLECULE[CCO-EXTRACELLULAR] :upper-bound 1.0

secretions:
CARBON-DIOXIDE[CCO-EXTRACELLULAR]
WATER[CCO-EXTRACELLULAR]
Note that this example is meant to show the syntax of the file describing a model, it is not meant to show a working model. The pgdb parameter specifies the PGDB to be used in this model. The set of model reactions is specified by using the reactions parameter. The keyword metab-all specifies all metabolic reactions from the PGDB, whereas FUMHYDR-RXN specifies one reaction using a unique identifier. A reaction equation can be provided to describe a reaction that is to be present in the model, but is not present in the PGDB.
The set of biomass metabolites are specified by parameter biomass; each metabolite is specified either by metabolite name or unique identifier, plus a compartment identifier in square brackets, and an optional coefficient. Nutrients and secretions are provided in the same manner, but no coefficients are allowed. Upper and lower bounds can be provided to constrain nutrient uptake rates or secretion production rates.
Specifying the metabolites of the biomass reaction using groups is also possible. The use of groups present a better structure of the biomass reaction. For example,
biomass:

:group val
Charged-VAL-tRNAs[CCO-CYTOSOL]   0.423162
VAL-tRNAs[CCO-CYTOSOL]          -0.423162
:end-group

:group thr
Charged-THR-tRNAs[CCO-CYTOSOL]   0.253687
THR-tRNAs[CCO-CYTOSOL]          -0.253687
:end-group
These two groups, one named val, the other named thr, specify a relationship between a charged and an uncharged tRNA, for valine and threonine. Essentially, the groups enable gathering the compounds where one or more compounds, with negative coefficients, are needed to produce the other(s) with positive coefficients. In other words, these groups describe partial sub-reactions of the biomass reaction because the metabolites with negative coefficients can be considered as reactants, and the metabolites with positive coefficients can be considered as products of a reaction, which is not necessarily mass balanced. The negative and positive values do not need to be the same absolute values because these sub-reactions are allowed not to be mass balanced. Metabolites can be repeated in different groups, but repetition of a metabolite is not allowed outside groups. Groups have another use with the try-biomass parameter in development mode (see subsection 11.4).
11.3.1 Modeling a Community of Organisms using Dynamic FBA
The organisms within a community model share the same physical space, which can now be specified by the user as a rectangular grid such as to simulate an animal digestive tract. At the start of the simulation, the user seeds the grid squares with different starting biomasses of organisms and metabolite concentrations. Organisms and metabolites may also be introduced at specified grid squares at specified time points as the model runs. At each dynamic FBA time step, metabolite concentrations are updated to reflect metabolites secreted by each organism, and by computed diffusion of metabolites across the grid (diffusion of organisms is also computed). This computation emulates the dispersion of metabolites and organisms due to Brownian collision. The diffusion coefficients of the metabolites and organisms are set to and , respectively. At each step, the concentrations of nutrients in each grid square are decreased and the concentrations of secreted metabolites are changed based on the rate of nutrient uptake and rate of secretion by each model. Each model is run independently in each time step to compute growth rates for each organism, and then the organism biomass is updated with respect to both that growth rate and a specified death rate. A death rate can be specified as a percentage (between 0 and 100) of organisms dying at each step using the parameter organism-death-rate. The same organism death rate is applied to all models. The order in which organism models are solved is chosen at random at each step.
For example, the following COM file specifies two E. coli models with some starting biomass at opposite locations on a grid. The colony in the upper right is the wild type, but the colony in the lower left is missing a single reaction (NADH:ubiquinone reductase) which reduces its ability to use oxygen to speed growth, resulting in somewhat lower population and less CO2 production. The simulation shown here is anaerobic for the first five time steps and aerobic for the remaining time. The simulation is run for 12 steps where each step represents one hour.
community-name: two-ecoli

fba-files:
ecoli-strain-A.fba   :biomass 0.01 :locations (0 0) :steps 1
ecoli-strain-B.fba   :biomass 0.01 :locations (4 4) :steps 1

organism-death-rate: 0

grid-dimensions: 5 5
grid-real-dimensions: .5 .5 .5
nb-steps: 12       # default is 24
time-step: 3600    # seconds, default is 3600

exchange-compartments: [CCO-EXTRACELLULAR]

community-nutrients:
GLC[CCO-EXTRACELLULAR]             :supply 10 :locations (* *) :steps 1
OXYGEN-MOLECULE[CCO-EXTRACELLULAR] :supply 10 :locations (* *) :steps 5
After the simulation run is complete, a solution file will be produced that describes the nutrients used, secretions produced, accumulated biomasses and metabolites used or produced for each FBA model and for each grid. These results can be visualized using generated figures and MPEG movie files with an animation of the simulation results over time.
11.3.2 Visualization of MetaFlux Community Model Outputs
When MetaFlux is used to model a community of organisms, its output results consist of organism biomass values for each time point in the simulation, and metabolite concentrations for each time point for those metabolites supplied as nutrients or secreted into the extracellular space. If the simulation takes place across a spatial grid, then the output consists of organism biomass values and metabolite concentrations at each square within the grid, for each time point in the simulation. We developed several new visualization tools that aid the user in digesting this large amount of output data:
-
•
X-Y Plot: Aggregated Biomasses/Metabolites. This tool produces two separate X-Y plots. One graphs the organism biomasses (in gDW) accumulated in the grid as a function of time. The second graphs aggregate metabolite amounts (in mmol) across the grid as a function of time. The metabolites shown are for the extracellular compartment. The metabolites and organisms shown are selected by the user (see Figure 22).
-
•
X-Y Plot: Metabolites Used/Produced per Organism. The metabolites used and produced by each organism at each time step are shown in a separate X-Y plot for each organism. The metabolites are selected by the user. (The X-axis is time; the Y-axis shows aggregate metabolite concentrations across the grid for that organism.)
-
•
Static Grids: Biomasses/Metabolites. A series of static 2D heatmaps depict the spatial grid in which the organism community grows, showing the organism biomasses (in gDW per grid box) and/or metabolites (in mmol per grid box) at several time steps. Each image of the grid depicts one organism and one metabolite among those selected by the user, at one time point (see Figure 23).
-
•
Dynamic Grids: Biomasses/Metabolites. This option is similar to the preceding static grids display, but an MPEG movie is created, in which each simulation time point corresponds to one step in the animation. An animation step is shown every three seconds. The FFmpeg program is used to create this MPEG movie, which will be shown using the default web browser installed on the user’s computer.
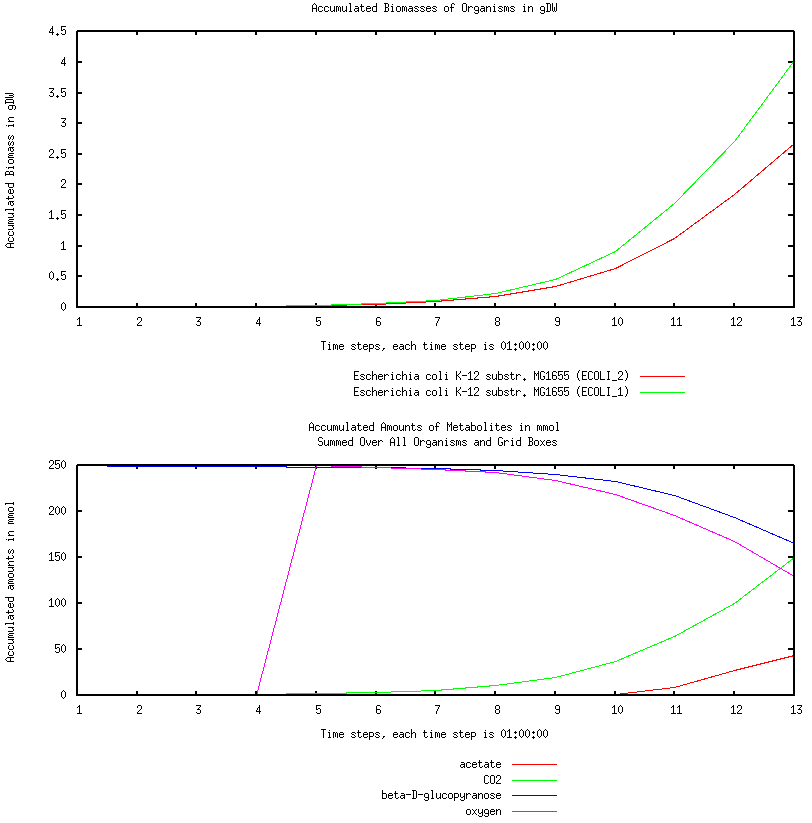
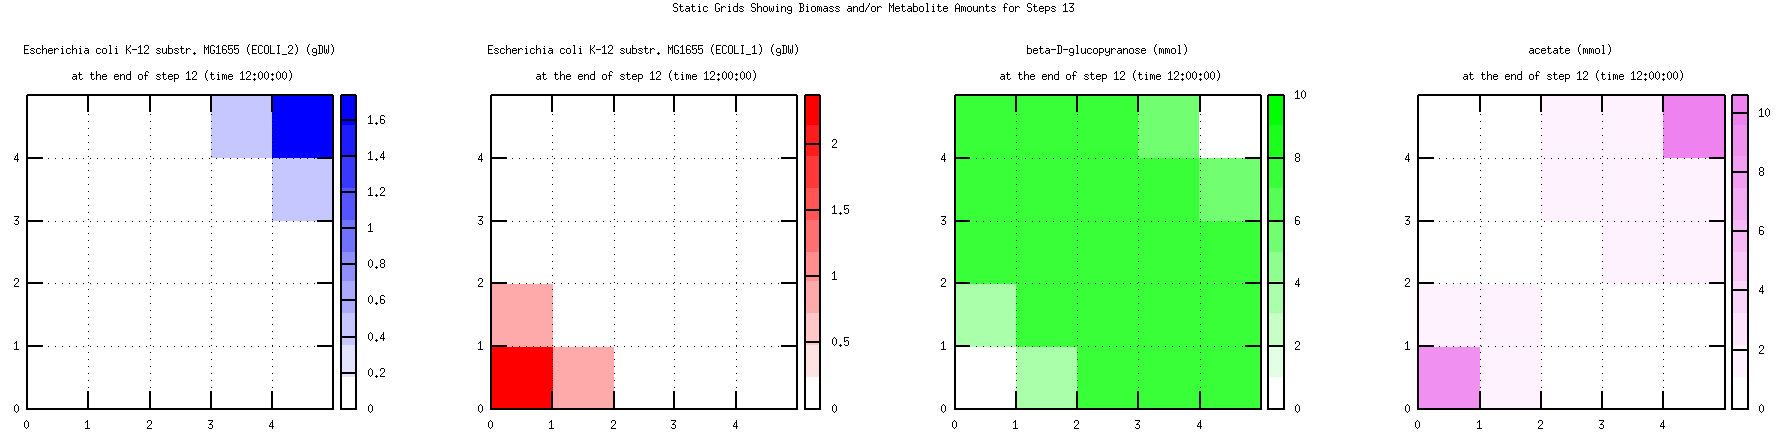
11.4 Development Mode
The development mode can be used to create an FBA model or to discover what is wrong with a model that does not grow when growth is expected. The main parameters used in development mode are the four parameters try-biomass, try-reactions, try-secretions and try-nutrients.
When MetaFlux is provided with a list of metabolites for the try-biomass in development mode, the software tries adding these metabolites to the biomass reaction. That is, in development mode, MetaFlux computes the maximum number of try-biomass metabolites that can be produced by the model. In other words, MetaFlux will output as a solution the largest subset of metabolites it can produce as biomass. In the early phases of developing a model, typically the entire biomass reaction is specified by try-biomass and no metabolites are specified for the biomass parameter.
The try-biomass parameter cannot specify any metabolite with a negative coefficient not included in a group. This is required because any such metabolite could be used as a “free” nutrient for the organism. On the other hand, inside a group, negative coefficients are allowed because MetaFlux tries to produce the entire group of metabolites, not any one of them independently. A group of metabolites is supposed to form a cohesive unit where any metabolite specified with a negative coefficient is used to produce some other metabolites of that group. Therefore, declaring all metabolites that have negative coefficients in some groups enables the entire biomass reaction to be used as a try-biomass set, indicating for all metabolites which ones can or cannot be produced.
The try-reactions parameter can be used to try to add candidate reactions to the model to increase the number of try-biomass metabolites produced by the model. Therefore, the try-reactions parameters is typically used when at least one biomass metabolite is not produced. The candidate reactions are selected from MetaCyc. A single keyword, metacyc-metab-all, instructs MetaFlux to try all the metabolic reactions of MetaCyc. Alternatively, a list of candidate reactions can be specified by their unique identifiers. MetaFlux tries to produce as many biomass metabolites as possible from the try-biomass section, by adding as few reactions as possible from the try-reactions set. This computation is performed using optimization as a Mixed-Integer Linear Program (MILP), which can be computationally expensive to solve. The amount of time to compute an optimal solution varies depending on the number of candidate reactions. It can take a few seconds to several hours, or even days.
MetaFlux also has a fast development mode that can be used with the try-reactions parameter only. It may run much faster than the general development mode and may provide different solutions. It uses a heuristic that does not necessarily provide an optimal solution. But optimality is not always the best possible biological solution. Please consult [101] for a more complete description of the advantages and disadvantages of fast development mode.
11.5 Knockout Mode
Knockout mode is used to computationally evaluate the impact of removing genes or reactions from an FBA model. This mode is used to predict essential genes of an organism for a given growth environment, and can also be used to evaluate the accuracy of a model if experimental gene knockout data are available. MetaFlux can compute single, double, or higher numbers of simultaneous knockouts.
When run, MetaFlux solves the model without any knockouts, and then solves for each gene to knockout by deactivating the reactions associated with that gene. Note that a given gene may deactivate none, one, or several reactions, because some genes may have isozymes, or catalyze several reactions. Requesting a summary only of the results of the knockout or requesting that, beside the summary, a complete solution file be produced for each gene knockout is also possible. See the subsection 11.7.2 for more details on the solution files produced.
11.6 Flux Variability Analysis Mode
Flux variability analysis (FVA) can be used to determine the robustness of metabolic models under different simulated growth conditions by computing the minimum and maximum possible flux values of each reaction for a given growth condition. After FVA is run, a report is generated showing the reactions which are blocked (these reactions cannot carry flux), fixed (these reactions have identical, non-zero minimum and maximum flux values), or free (these reactions have flux values that freely fluctuate within some range between the lower and upper bounds). Other uses of FVA may include classifying reactions as to whether they are fully-coupled, partially coupled, or not coupled to biomass flux or investigating alternate solutions by fixing relevant reaction flux values.
11.7 Outputs Generated by MetaFlux
Whichever mode is used to execute MetaFlux, the following output files are generated: the solution file that contains a description of the active reactions and metabolites used and produced, the log file to describe issues that may exist in the model, and a data file for the fluxes that can be displayed with the Cellular Overview map of Pathway Tools.
In solving mode, the main output is the computed optimal assignments of reaction fluxes. For an organism-community model, solution, log, and data files are produced for each organism.
In development mode, the outputs are the set of biomass metabolites that can be produced; the try nutrients utilized (if any); the try secretions produced (if any); the reactions that actively carry flux; and a minimal list of suggested reactions to be added to the model, and reactions whose directions are reversed (if any) to produce otherwise unproducible biomass metabolites. Development mode also identifies which biomass metabolites could not be produced by the model (if any), despite the additions from the try sets.
11.7.1 Reports Generated by MetaFlux
The set of reactions specified by the PGDB and the FBA input file may contain reactions that cannot, or that should not, be used in a model. MetaFlux checks each reaction to ensure that its inclusion in the model will not invalidate the model. In particular, all reactions are verified to be mass and charge balanced. Reactions that are unbalanced, or cannot be shown to be balanced, are not included in the model, but are listed in the log file.
Another step in model execution is to instantiate the generic reactions of a model according to the compounds available in the PGDB. A generic reaction has some compound classes as products or reactants (e.g., “sugars”). Each computed reaction instantiation is added to the model. If a generic reaction instantiation was not possible (for example, when which compound instances should be used for classes on each side of a reaction is ambiguous) then such generic reactions are listed in the log file.
Blocked reactions. MetaFlux analyzes the network of reactions specified by the PGDB plus the FBA input file to detect if some reactions are blocked. A blocked reaction is a reaction that can never carry flux, given the nutrients, secretions, biomass metabolites, and reactions specified for a particular model execution. That is, blocked reactions are a function not only of the network, but of the cellular growth conditions. A blocked reaction has at least one reactant that is not produced by any reaction in the model, and that is not provided as a nutrient; or has a product that is not used as a reactant by any other reaction and that is not secreted, and is not specified as a biomass metabolite with a positive coefficient. These reactions are the basic blocked reactions, and the metabolites that caused basic blocked reactions to be blocked are called basic blocking metabolites.
Blocked reactions can never carry flux because in steady-state modeling, the producing and consuming fluxes for every metabolite must be balanced. But the preceding metabolites could not have balanced fluxes if a blocked reaction carried flux, because according to the preceding definition, must have either zero reactions that produce it or zero reactions that consume it.
Additional blocked reactions can be identified by eliminating basic blocked reactions from the model, causing more reactions to become basic blocked reactions. This process of removing basic blocked reactions from the model is repeated until no more reactions become blocked. The detection of blocked reactions is done before the linear solver is called (that is, this detection does not depend on the fluxes of reactions, but is a static evaluation of the model).
The set of blocked reactions is listed in the log file, grouped by basic blocking metabolite (the reactions are also grouped by pathways). The basic blocking metabolites are, in a sense, the root causes of blocked reactions, thus their identification is quite valuable for model debugging.
11.7.2 The MetaFlux Solution File
The content of the solution file generated by MetaFlux depends on the mode of MetaFlux. In solving mode, the solution file contains the uptake rates of the nutrients, the production rates of the biomass metabolites and secretions, and the fluxes of the model reactions. If no growth is obtained (that is, the flux of the biomass reaction is zero, or very near zero), this condition is stated in the solution file.
When solving a community model, a community solution file is generated that contains a summary of the result, and a complete solution file is produced for each organism in the community. The summary lists many values: the growth rate of each model, the compartments that were involved in the exchange of metabolites between the organisms; the secretions used as nutrients by some organisms with their flux; the secretions that were not used by any organisms; and the secretions that were not produced by any organism of the community. In essence, the summary gives the overall view of the exchange of metabolites between the organisms and the rate of growth of each organism.
In development mode, the solution file contains essentially what is given in solving mode, but the flux values are only meaningful as to whether they are zero or non-zero. For example, if a try-biomass parameter was specified with some metabolites, the metabolites that could or could not be produced are identified. This is different from the solving mode, where only one biomass metabolite that cannot be produced will result in no growth, but with no indication of which metabolites could not be produced.
In knockout mode, a solution file with a summary of the results is produced. The summary includes the growth of the model with no knockouts, followed by a list of every knockout that was requested, based on genes and/or reactions to knockout, and the resulting flux for the biomass reaction. Requesting a complete solution file for each knockout performed is also possible.
11.7.3 Painting MetaFlux Fluxes on the Cellular Overview and Omics Dashboard
MetaFlux also generates a data file that can be used with the Cellular Overview of Pathway Tools (see Section 5.4). The graphical user interface of MetaFlux enables the user to click one button to invoke the Cellular Overview with the data from that file. The Cellular Overview displays all the reactions, grouped by pathways, of the organisms, and highlights, with colors indicative of flux values, the reactions that have positive fluxes. This overview enables the user to visually assess the metabolic activities of a model solution.
For a community of organisms, a data file is generated for each individual organism, and the graphical user interface gives direct access to each individual Cellular Overview of the organisms involved in the community.
MetaFlux has been extended so that the reaction fluxes computed by solving mode can be displayed on the Omics Dashboard [124] (see Section 6.1) to speed user interpretation of fluxes. The Dashboard is an interactive tool for hierarchical visualization of large-scale data sets. The top level of the Dashboard graphs the aggregate behavior of every metabolic subsystem of the cell, from nucleotide biosynthesis to aromatic compound degradation to aerobic respiration. The user can drill down into any of these graphs to view the fluxes of individual pathways.
12 Survey of Pathway Tools Compatible Databases
According to user surveys, Pathway Tools users have created 9,800 PGDBs for organisms from all domains of life, in addition to the 18,000 PGDBs available from BioCyc.org. This section summarizes sites that provide public-access user-generated PGDBs.
With highly curated PGDBs available for many important organisms, it is not clear why users would consider using the uncurated (and therefore lower quality) pathway DBs available for these same organisms from other pathway DB providers. For example, consider the highly curated AraCyc pathway database for Arabidopsis thaliana [110, 5]. AraCyc contains mini-review summaries for enzymes and metabolic pathways; thousands of literature references; evidence codes for enzyme functions and metabolic pathways (indicating which pathways are supported by experimental evidence); and information on enzyme subunit structure, activators, inhibitors, and cofactors. In contrast, KEGG data on Arabidopsis contains none of the preceding information. In addition, AraCyc curators have carefully refined the metabolic reactions and pathways present in AraCyc, such as to remove false-positive computational predictions, and to add Arabidopsis reactions and pathways from the biomedical literature to AraCyc. Although KEGG updates its reference pathway map diagrams periodically to contain new pathways and reactions from different organisms, the KEGG approach of computationally coloring reactions within pathway maps based on the presence of enzymes for those reactions within a genome results in significant ambiguity. If AraCyc curators are reasonably certain that a reaction or pathway is absent from Arabidopsis, they remove it from the database. The KEGG model does not allow such removal, so whether an uncolored reaction is truly absent from an organism or whether the gene for its enzyme has not yet been identified in the genome is never clear within KEGG. This situation results in a real conundrum for a scientist who wishes to assemble the list of reactions likely to be present in Arabidopsis from KEGG, because is no way exists to distinguish the many uncolored reactions that are likely present but for which no gene has been identified, from the many uncolored reactions that are clearly known to be absent from Arabidopsis (which curators have deleted from AraCyc).
Table 1 lists PTools-based websites, the number of PGDBs they contain, and their supporting institution. This table is based on the web page [131] which is updated on a semi-regular basis.
Database or Collection Scope Institution URLs AcypiCyc Acyrthosiphon pisum Universite de Lyon [1] Aphis glycines Daktulosphaira vitifoliae Diuraphis noxia Myzus cerasi Myzus persicae Rhoplalossiphum padi ArthropodaCyc PGDBs for 32 arthropods ArthropodaCyc group, France [6] CalbiCyc Candida albicans Department of Genetics, Stanford U., USA [24] CottonCyc Gossypium raimondii CottonGen, [35] Gossypium hirsutum Washington State University Gossypium arboreum Gossypium barbadense Gossypium turneri DiatomCyc Phaeodactylum tricornutum Center for Plant Systems Biology, [41] University of Ghent, Belgium Gramene Brachypodium distachyon Gramene curators (CSHL, OSU, EMBL-EBI) [59] Oryza sativa japonica Nipponbare Sorghum bicolor BTX623 Zea mays and mirrored PGDBs for 9 organisms GutCyc 418 gut bacteria available as flat files only University of British Columbia, [62] Stanford University MicroScope PGDBs for 3749 organisms C. Medigue, Genoscope, France [117] PlantCyc PGDBs for 101 plants Plant Metabolic Network, [133] Carnegie Institution, USA PseudoCyc Pseudomonas aeruginosa F. Brinkman, Pseudomonas Genome Project, [134] Simon Fraser U., Canada SoyCyc Glycine max SoyBase [150] Trypanocyc Trypanosoma brucei INRA Toulouse Leishmania major France [160] USDA Bacterial Genomes Mannheimia haemolytica Strain USDA SciNet [162] USDA-ARS-USMARC-183 Salmonella enterica Strain serovar Montevideo str. CDC 2012K-1544 Escherichia coli O157:H7 350 VitisCyc and others Vitis vinifera Center for Genome Research and Biocomputing, [164] Eucalyptus grandis Oregon State University Fragaria vesca and mirrored PGDBs for 10 organisms Yeast Biochemical Pathways Saccharomyces cerevisiae SGD Curators, [140] Stanford University, USA
To facilitate sharing of PGDBs among multiple users, we have created a PGDB Registry that enables peer-to-peer sharing. PGDB sharing is desirable because a user whose own computer has a copy of a PGDB can use Pathway Tools functionality that would not be available through a remote Pathway Tools web server, such as functionality that exists in desktop mode only, and such as comparative operations. Comparative analysis of two or more PGDBs is possible only when they are loaded into the same instance of Pathway Tools.
The PGDB Registry uses a server maintained by SRI that tracks the locations of available PGDBs that PGDB authors have registered for downloading. The author of a PGDB can register that PGDB by using a command within Pathway Tools that creates an entry for the PGDB in the Registry server, and places the PGDB on an FTP or HTTP server of the author’s choosing. Users who want to download a PGDB from the Registry can view available PGDBs by using a web browser (see URL [129]) or using Pathway Tools itself. With a few mouse clicks, a user can download a PGDB from the registry using Pathway Tools.
13 Comparison of Pathway Tools with Related Software Environments
Pathway Tools stands out with respect to related software tools in the breadth of the functionality and the high level of integration that it provides. It addresses a very large number of use cases. And it provides schema, visualization, and editing support for an unusually large number of data types in addition to metabolic and signaling pathways, including chromosomes, genes, enzymes, transporters, regulatory networks, and compounds. The following comparison is organized roughly according to the use cases presented in Section 2.
13.1 Development, Visualization, and Web Publishing of Organism Specific Databases
13.1.1 Metabolic Pathway Information
Other software systems for managing metabolic pathway information are KEGG [73, 112]; The SEED [115]; GenMAPP [141, 163]; PathCase [95, 116]; VisANT [67]; and Reactome [36]. KEGG, Reactome, and GenMAPP employ static, pre-drawn pathway diagrams, a model that does not scale to produce custom pathway diagrams for thousands of different pathways in different organisms. Nor can the static approach produce multiple views of a given pathway at different levels of detail, as can the Customize Pathway option in Pathway Tools that enables the user to choose exactly which graphical elements (e.g., gene names, EC numbers, metabolite structures, activators and inhibitors) appear in the pathway diagram, and to color a pathway diagram with omics data.
PathCase and VisANT do have pathway layout capabilities, but the resulting diagrams bear little resemblance to those found in the biomedical literature, nor are they particularly compelling visually. Their diagrams can be customized in various ways (e.g., choice of layout algorithm, data overlays, and selective compaction of nodes), but they do not offer the same types of customization or multiple-detail views offered by Pathway Tools.
Cytoscape [144] is a general tool for displaying biological networks that embodies the philosophy that general graph layout techniques can satisfactorily depict any biological network. Although the Cytoscape layout algorithms are a terrific fit for display of protein interaction maps, we assert that the general layout algorithms do not produce useful results for metabolic pathways. We believe that superior visualization results are obtained when layout algorithms are specifically tailored to metabolic pathways. For example, Pathway Tools provides separate layout algorithms for circular, linear, and tree-structured pathways to make the structure of those pathways stand out prominently to the biologist. Biologists developed their pre-computer depictions of metabolic pathways for important reasons, namely to clearly present the topology of a pathway.
SEED models lack a unifying pathway visualization framework—they use KEGG pathway diagrams, often supplemented with simple text-based diagrams and/or images imported from other sources, with limited interactivity beyond hyperlinks.
GenMAPP, Reactome, VisANT, KGML-ED [93], and PathCase have pathway-editing capabilities. KEGG and SEED lack pathway editing, meaning that users cannot introduce new organism-specific pathways, nor modify a reference pathway to customize it to a specific organism, thus eliminating the possibility of removing erroneous reaction steps from a pathway, or of adding missing reactions to a pathway.
KEGG Atlas [113] has a comparable analog of our Cellular Overview diagram (which we introduced in 1999 [74, 44]). The KEGG Atlas diagram was constructed by hand and provides a single set of overview metabolic maps for all organisms in KEGG, as opposed to the organism-specific overviews that Pathway Tools generates through advanced layout algorithms. The KEGG diagram is not as flexibly queryable or interactive as the Pathway Tools diagram, and it also lacks semantic zooming for adding increasing details. A notable improvement occurred with Pathway Projector [94]. It relies directly on KEGG for the overall overview diagram and other data, but graphically, it is enhanced, adding EC numbers and genes to reaction edges.
Reactome includes a different type of high-level overview diagram called Fireworks, which shows a hierarchical organization of nodes representing metabolic and signaling pathways, mostly the latter. Users can navigate to pathways of interest with this diagram, and highlight pathways that contain objects such as compounds or genes that are supplied in an analysis interface. Fireworks can zoom in until pathway names are shown. From there, one can click to a specific pathway display for the details. However, Fireworks does not depict individual reactions or metabolites; therefore, it is not a metabolic map diagram.
Tools such as VisANT and Cytoscape can be used to display very large networks, including the entire metabolic network for an organism, and these diagrams can be used to visualize omics data and interacted with in other ways, but given that such diagrams are laid out using general-purpose network layout algorithms, individual pathways are not likely to be recognizable.
No other general tool can show reactions with atom-mapping information.
Computationally generated diagrams for electron transfer reactions and pathways, as well as for transport reactions, with their depiction of compartments at a cellular membrane, are unique features of Pathway Tools.
13.1.2 Genome and Proteome Information
Most model-organism DB tools include genome browsers and gene pages. A representative sample of such systems includes GBrowse [151, 42]; JBrowse [146]; IMG [105]; Entrez Genome [46]; the UC Santa Cruz (UCSC) Genome Browser [139]; Ensembl [37]; and PATRIC [167].
The Pathway Tools genome browser uses a different approach than the others. First, all the other genome browsers depict the chromosome as a single horizontal line, with tracks information below it. Pathway Tools uses this approach when the user explicitly enables tracks, but when tracks are not enabled, a multi-line wrapped display is used to present the most possible information in the available display window. Second, all the other genome browsers use tracks to depict coding regions, promoters, and other genome features. Although Pathway Tools does provide a tracks capability, its assumption is that consensus curated information on coding region extents, promoters, terminators, and transcription-factor binding sites should be depicted “inline” on the multi-line chromosome. This approach results in a much more information-dense display.
GBrowse is highly customizable through the addition of data tracks. Wrapped multiline displays that will make full use of screen real estate are not available. In GBrowse, the semantics of semantic zooming has to be configured but provides flexibility. GBrowse can provide comparative genomics with additional tools like SynView [166] or GBrowse_syn [108].
JBrowse is a JavaScript-based genome browser that could become a replacement for GBrowse. Its main innovation is to rely on the web browser to perform most of the processing and drawing, making it fast and smooth. PATRIC uses JBrowse.
The IMG genome browser (or “chromosome viewer”, in their parlance) is very basic, and does not support zooming. Some views are shown as wrapped multiline displays, and several gene coloring schemes can be selected, but no data tracks are offered. For comparative genomics, three different, unrelated synteny viewers are available.
The Entrez Genome sequence viewer has no real semantic viewing other than showing the DNA sequence at maximum zoom level. It offers support for adding extra tracks and an alignment view for comparative genomics.
The UCSC Genome Browser is mainly geared towards eukaryotes and has an extensive support for addition of data tracks. But no real semantic viewing is available other than showing the DNA sequence at maximum zoom level.
Ensembl is focused on eukaryotes, similarly to UCSC, and also has extensive support for extra tracks. It offers no real semantic viewing, other than showing the DNA sequence at maximum zoom level.
Most sequenced genomes are circular, but Pathway Tools seems to have the only genome browser that can seamlessly depict the junction between the first and last base-pair to show a contiguous view. All other genome browsers seem to artificially linearize all chromosomes. Also, Pathway Tools seems to be unique in providing a compact overview of the entire genome (the “genome overview”), which enables coloring each gene with omics data.
13.1.3 Regulatory Networks
A number of bioinformatics databases include regulatory network information; however, the majority of these databases and their associated software environments can represent information on transcription-factor-based regulation only, such as RegTransBase [89]; TRANSFAC [107]; CoryneRegNet [12]; ProdoNet [92]; and DBTBS [145]. The exception is RegulonDB [53], which can also capture RNA-based regulation, including riboswitches, attenuators, and small-RNA regulators.
We are not aware of tools comparable to the Regulatory Overview in being able to display and interrogate large, complete cellular regulatory networks, although CoryneRegNet and ProdoNet display smaller regulatory networks. CoryneRegNet also displays omics data onto its regulatory network diagrams.
13.1.4 Query Tools
Other organism DBs provide a subset of the three tiers of
queries provided by Pathway Tools (quick search, object-specific
searches, and Structured Advanced Query Page). Virtually all provide
a quick search. Sites providing particularly extensive
object-specific searches are FlyBase [43]; Mouse Genome
Informatics [23]; EuPathDB [8]; and BioMart
[148]. BioMart is used by bioinformatics DBs, including
WormBase, Rat Genome Database, UniProt, Reactome, and Galaxy. Its
underlying query language is Perl, using the BioMart libraries.
However, none of the preceding systems provides the query power of the
Pathway Tools SAQP. For example, BioMart does not allow the user to
construct arbitrary queries that perform joins (queries that combine
multiple data types); it provides only the “and” logical operator
(the “or” operator is not available); and it includes only a limited
form of “not.” Biozon [19] (biozon.org) provides
a web interface that provides fairly complex querying, including join
operations, over several biological DBs.
13.2 Extend Genome Annotations with Additional Computational Inferences
KEGG, Model SEED, and Reactome are the only other tools that can predict pathways from genome data. The pathway hole filler and transport inference parser tools are unique to Pathway Tools. Many genome-annotation pipelines include operon predictors.
13.3 Analysis of Omics Data
Kono et al. introduced a tool based on the Google Maps API for painting omics data onto an enhanced KEGG Atlas map, called Pathway Projector [94]. This tool does not produce animations as our omics viewers do. However, it can depict time-series expression data as small histograms that are reminiscent of Pathway Tools’ omics pop-ups. It also provides more powerful highlighting options than KEGG Atlas. Sequence-based search and highlighting is available via KEGG BLAST, although it can take minutes. Users can manually annotate the map with custom markers and lines, which can be exported via XML and shared with others.
KEGG Atlas [113] enables some limited highlighting, but mostly by using KEGG identifiers. No animation or omics pop-ups seem to be available.
Reactome [36] can paint omics data onto the Fireworks hierarchical pathway overview. Zooming to high detail reveals the pathway names, but zooming does not go to the reaction level. Showing time-series data as animations is possible. No omics pop-ups seem to be available.
13.4 Metabolic Modeling
Other well-known tools providing constraint-based metabolic modeling include COBRA [158] and Model SEED [65]. Many other FBA tools exist, but a detailed comparison with all of them is beyond the scope of this paper. Lakshmanan et al. provide a comparison among 19 FBA tools, including MetaFlux (see their Tables 2, 3, and 4) [98]. This paper was first published in 2012 and therefore covers an old version of MetaFlux. Additions to MetaFlux since that time include expansion to the Windows platform, import of SBML files, solving of models for organism communities, and support for dynamic FBA. Other tools have probably developed new capabilities as well. We now examine some of the issues raised by Lakshmanan et al. in more detail.
Our design of MetaFlux has emphasized ease of use and acceleration of the very slow model development times of 12–18 months stated in some FBA publications. At SRI we have reliably been able to create FBA models for bacteria and fungi in 3–4 weeks (albeit to a lower level of validation than some published models). We note that in another recent survey of metabolic modeling software [63], Pathway Tools was the only software package recommended for users new to modeling.
Elements of the MetaFlux approach that speed model development are as follows. (a) Use of MetaFlux does not require programming ability as some other tools do. (b) Lakshmanan mentions the collection of metabolic reactions for an organism at the start of all metabolic modeling projects in passing, without noting the strong link between model accuracy and the completeness of the initial reaction set. The PathoLogic enzyme name matcher (see Section 3.2) combined with the extensive reaction database of MetaCyc [26] provide a powerful resource for reactome prediction. Furthermore, when metabolic pathway prediction follows reactome prediction, it produces a more complete metabolic network, because it imports all reactions in a pathway, even those that lack enzyme assignments, thus simplifying the later gap-filling step. Furthermore, the fact that Model SEED contains approximately as many metabolic pathways as does MetaCyc raises a major question in the use of Model SEED for pathway reconstruction.444This number was obtained by manually reviewing the 1,320 subsystems present in the February 2015 version of Model SEED, then removing all subsystems not related to metabolism, then removing subsystems for individual metabolic enzymes. This process yielded 730 subsystems that correspond to metabolic pathways, compared to the 2,300 pathways in the February 2015 version of MetaCyc. (c) MetaFlux has a more powerful gap-filler than any other tool: it can gap-fill not only reactions but also nutrients and secretions, and it can identify which biomass metabolites cannot be synthesized by the model, a critical step in helping the user discover which aspect of the network is incomplete. This is a feature not found in other tools to our knowledge. (d) MetaFlux computes blocked reactions and metabolites, reporting to the user the basic blocking metabolites that are the root causes of model blockages. (e) MetaFlux computes the reaction balance from the reaction equations plus chemical structure data to ensure that unbalanced reactions are prohibited from inclusion in a model.
Many other tools use the GLPK solver (some not exclusively). MetaFlux uses the SCIP solver [118], which has a much faster Mixed-Integer Linear Programming (MILP) solver, needed for gap-filling, and is free for research use by academics. The SCIP MILP solver is fast, although not as fast as commercial solvers.
The comment by Lakshmanan et al. on p8 that “none of the [network visualization] tools can handle large-scale models” clearly does not apply to MetaFlux, as its cellular overview diagram does handle genome-scale models.
Lakshmanan et al. suggest (p10) that more tools should consider linking with a biological model storage DB. Pathway Tools has taken this approach to an extreme, as described in Section 11.1.
14 Limitations and Future Work
Here, we summarize limitations of Pathway Tools, organized by use case. Some of these limitations are being addressed in current research; many of the others will be addressed in future work.
Development of Organism Specific Databases. Pathway Tools has an emphasis on prokaryotic biology, although over time we have added, and plan to add, more support for eukaryotic biology. One remaining limitation is that although the software can capture many types of prokaryotic regulation, we have not attempted comprehensive coverage of eukaryotic regulation. Another limitation is that the editing tools within Pathway Tools are not web based, but require installation of Pathway Tools on every computer that will be used for editing.
Visualization and Web Publishing of Organism Specific Databases. In recent years we have made significant progress in making the capabilities of the web and desktop modes of the Pathway Tools Navigator as similar as possible. For example, many cellular overview capabilities previously present only in desktop mode are now also available in web mode. However, not all capabilities of Pathway Tools are available in both the web and desktop modes. For example, many comparative tools function in web mode only, whereas all aspects of PathoLogic and the editing tools are available in desktop mode only.
Analysis of Omics Data. Pathway Tools is not a general-purpose environment for analysis of omics data. Our assumption is that scientists will use one of the many other software packages for the early stages of omics data analysis (such as normalization), and will provide the output of those analyses to Pathway Tools for display with the omics viewers.
15 Summary
Pathway Tools treats a genome as far more than a sequence and a set of annotations. Instead, it links the molecular parts list of the cell both to the genome and to a carefully constructed web of functional interactions. The Pathway Tools ontology defines an extensive set of object attributes and object relations that enables representing a rich conceptualization of biology within a PGDB, along with enabling querying and manipulation by the user. Furthermore, a PGDB can be transformed into a quantitative metabolic model for the organism.
Pathway Tools provides a broad range of functionality. It can manipulate genome data, metabolic networks, and regulatory networks. For each data type, it provides query, visualization, editing, and analysis functions. It provides model-organism database development capabilities, including computational inferences that support fast generation of comprehensive databases, editors that enable refinement of a PGDB, web publishing, and comparative analysis. A family of curated PGDBs has been developed using these tools for important model organisms.
The software also provides visual tools for analysis of omics data sets, and tools for the analysis of biological networks.
16 Software Availability
Pathway Tools runs on Macintosh, Windows, and Linux. It is freely available to academic and government researchers; a license fee applies to commercial use. See http://BioCyc.org/download.shtml.
Funding
This work was supported by grants GM75742, GM080746, and GM077678 from the National Institutes of Health. The contents of this article are solely the responsibility of the authors and do not necessarily represent the official views of the National Institutes of Health.
Acknowledgments
Pathway Tools has benefited from advice, input, and contributions from many scientists during its lifetime. We particularly wish to recognize contributions from Ian Paulsen, Robert Gunsalus, Monica Riley, John Ingraham, Jean-Francois Tomb, and Peifen Zhang. Lukas Mueller developed PerlCyc and has provided many helpful suggestions. Thomas Yan developed JavaCyc. Tomer Altman developed RCyc. Jeremy Zucker developed the first SBML generation module, and contributed many other ideas. Christos Ouzounis was a co-developer of the original metabolic pathway prediction algorithm, contributed an early version of the import/export system, and has been a source of much sound advice.
Key Points
-
•
The Pathway Tools software is a comprehensive environment for creating model organism DBs that span genome information, metabolic pathways, and regulatory networks.
-
•
Pathway Tools inference capabilities include prediction of metabolic pathways, prediction of metabolic pathway hole fillers, inference of transport reactions from transporter functions, and prediction of operons.
-
•
Its metabolic modeling capabilities include flux balance analysis modeling for individual organisms and organism communities, with model gap-filling and the ability to model gene knockouts.
-
•
Pathway Tools provides interactive editing tools for use by database curators.
-
•
Omics data analysis tools paint genome-scale data sets onto a complete genome diagram, complete metabolic network diagram, and complete regulatory network diagram. Pathway Tools also computes enrichment analysis, and provides an Omics Dashboard tool for visual, hierarchical, interactive analysis of omics data sets.
-
•
Other tools include comparative analysis operations, dead-end metabolite and blocked-reaction analysis of metabolic networks, and metabolic route searching.
References
- [1] AcypiCyc. http://acypicyc.cycadsys.org/.
- [2] A. M. Alashqur, S. Y. W. Su, and H. Lam. OQL: A query language for manipulating object-oriented databases. In VLDB ’89: Proceedings of the 15th International Conference on Very Large Data Bases, pages 433–442, San Francisco, CA, USA, 1989. Morgan Kaufmann Publishers Inc.
- [3] Robert A. Alberty. Thermodynamics of Biochemical Reactions. Wiley InterScience, 2003.
- [4] S.F. Altschul, W. Gish, W. Miller, E.W. Myers, and D.J. Lipman. Basic local alignment search tool. J Mol Bio, 215:403–410, 1990.
- [5] AraCyc. https://www.plantcyc.org/databases/aracyc/16.0.
- [6] ArthropodaCyc. http://arthropodacyc.apidb.org/.
- [7] M. Ashburner, C.A. Ball, J.A. Blake, D. Botstein, H. Butler, J.M. Cherry, A.P. Davis, K. Dolinski, S.S. Dwight, J.T. Eppig, M.A. Harris, D.P. Hill, L. Issel-Tarver, A. Kasarskis, S. Lewis, J.C. Matese, J.E. Richardson, M. Ringwald, G.M. Rubin, and G. Sherlock. Gene Ontology: Tool for the unification of biology. Nature Genetics, 25:25–29, 2000.
- [8] C. Aurrecoechea, J. Brestelli, B. P. Brunk, J. Dommer, S. Fischer, B. Gajria, X. Gao, A. Gingle, G. Grant, O. S. Harb, M. Heiges, F. Innamorato, J. Iodice, J. C. Kissinger, E. Kraemer, W. Li, J. A. Miller, V. Nayak, C. Pennington, D. F. Pinney, D. S. Roos, C. Ross, C. J. Stoeckert, C. Treatman, and H. Wang. PlasmoDB: A functional genomic database for malaria parasites. Nuc Acids Res, 37(Database issue):D539–43, 2009.
- [9] C. Aurrecoechea, M. Heiges, H. Wang, Z. Wang, S. Fischer, P. Rhodes, J. Miller, E. Kraemer, C.J. Stoeckert, D. S. Roos, and J. C. Kissinger. ApiDB: Integrated Resources for the Apicomplexan Bioinformatics Resource Center. Nuc Acids Res, 35:D427–D430, 2007.
- [10] A. Bairoch, R. Apweiler, and C. Wu. UniProt Knowledgebase User Manual. UniProt Knowledgebase User Manual, 2009.
- [11] T. Barrett, S. E. Wilhite, P. Ledoux, C. Evangelista, I. F. Kim, M. Tomashevsky, K. A. Marshall, K. H. Phillippy, P. M. Sherman, M. Holko, A. Yefanov, H. Lee, N. Zhang, C. L. Robertson, N. Serova, S. Davis, and A. Soboleva. NCBI GEO: archive for functional genomics data sets–update. Nuc Acids Res, 41(Database issue):D991–5, 2013.
- [12] J. Baumbach. CoryneRegNet 4.0 — A reference database for corynebacterial gene regulatory networks. BMC Bioinformatics, 8:429, 2007.
- [13] BioCyc Comparative Analysis. https://biocyc.org/comp-genomics?tables=reaction&tables=pathway&tables=compound&tables=protein&tables=orthologs&tables=tport&tables=tu&savedlist=none&orgid=VCHO&orgid=ECOLI&orglistname=&orglistname=none&orgids=(VCHO+ECOLI+).
-
[14]
BioCyc Comparative Genome Browser.
https://biocyc.org/ECOLI/NEW-IMAGE?type=LOCUS-POSITION
&object=(EG11024+C1725+TRPA+VC1169)&orgids=(ECOLI+ECOL199310+ECOO157+VCHO). - [15] BioCyc genome and metabolic map posters. https://biocyc.org/posters.shtml.
- [16] BioCycPlugin for Cytoscape. http://www.cgl.ucsf.edu/cytoscape/bioCycPlugin/.
- [17] BioPAX. http://www.biopax.org/.
- [18] BioVelo Advanced Query Page. https://biocyc.org/query.html.
- [19] A. Birkland and G. Yona. Biozon: A system for unification, management and analysis of heterogeneous biological data. BMC Bioinformatics, 7:70–93, 2006.
- [20] B. R. Bochner, P. Gadzinski, and E. Panomitros. Phenotype microarrays for high-throughput phenotypic testing and assay of gene function. Genome Research, 11(7):1246–1255, 2001.
- [21] B.R. Bochner. Global phenotypic characterization of bacteria. FEMS Microbiol Rev, 33(1):191–205, 2009.
- [22] B. J. Bornstein, S. M. Keating, A. Jouraku, and M. Hucka. LibSBML: an API library for SBML. Bioinformatics, 24(6):880–881, 2008.
- [23] C. J. Bult, J. T. Eppig, J. A. Kadin, J. E. Richardson, and J. A. Blake. The Mouse Genome Database (MGD): Mouse biology and model systems. Nuc Acids Res, 36:D724–D728, 2008.
- [24] CandidaCyc Database. http://pathway.candidagenome.org/.
- [25] R. Caspi, T. Altman, R. Billington, K. Dreher, H. Foerster, C.A. Fulcher, T.A. Holland, I.M. Keseler, A. Kothari, A. Kubo, M. Krummenacker, M. Latendresse, L.A. Mueller, Q. Ong, S. Paley, P. Subhraveti, D.S. Weaver, D. Weerasinghe, P. Zhang, and P. D. Karp. The MetaCyc database of metabolic pathways and enzymes and the BioCyc collection of Pathway/Genome Databases. Nuc Acids Res, 42:D459–71, 2014. http://nar.oxfordjournals.org/content/42/D1/D459.
- [26] R. Caspi, R. Billington, C. A. Fulcher, I. M. Keseler, A. Kothari, M. Krummenacker, M. Latendresse, P. E. Midford, Q. Ong, W. K. Ong, S. Paley, P. Subhraveti, and P. D. Karp. The MetaCyc database of metabolic pathways and enzymes. Nuc Acids Res, 46(D1):D633–9, 2018.
- [27] Cellular Overview with Animated Display of Example Gene Expression Dataset. https://biocyc.org/overviewsWeb/celOv.shtml?omics=t&url=file://expr-examples/time-series.txt&orgid=ecoli&zoomlevel=0&column1=6-9&class=gene&expressiontype=relative&log=on.
- [28] A. Ceroni, A. Dell, and S. M. Haslam. The GlycanBuilder: a fast, intuitive and flexible software tool for building and displaying glycan structures. Source Code Biol Med, 2:3, 2007.
- [29] H.J. Chung, M. Kim, C.H. Park, J. Kim, and J.H. Kim. ArrayXPath: Mapping and visualizing microarray gene-expression data with integrated biological pathway resources using Scalable Vector Graphics. Nuc Acids Res, 32:W460–4, 2004.
- [30] M. J. Cipriano, P. N. Novichkov, A. E. Kazakov, D. A. Rodionov, A. P. Arkin, M. S. Gelfand, and I. Dubchak. RegTransBase–a database of regulatory sequences and interactions based on literature: a resource for investigating transcriptional regulation in prokaryotes. BMC Genomics, 14:213, 2013.
- [31] Comparison of BioCyc Desktop Mode and Web Mode. https://biocyc.org/desktop-vs-web-mode.shtml.
- [32] Gene Ontology Consortium. The gene ontology project in 2008. Nuc Acids Res, 36:D440–4, 2008.
- [33] The MetaSUB International Consortium. The metagenomics and metadesign of the subways and urban biomes (metasub) international consortium inaugural meeting report. Microbiome, 4:24, 2016.
- [34] M. C. Costanzo, S. R. Engel, E. D. Wong, P. Lloyd, K. Karra, E. T. Chan, S. Weng, K. M. Paskov, G. R. Roe, G. Binkley, B. C. Hitz, and J. M. Cherry. Saccharomyces genome database provides new regulation data. Nuc Acids Res, 42(Database issue):D717–25, 2014.
- [35] CottonCyc. http://ptools.cottongen.org/.
- [36] D. Croft, A. F. Mundo, R. Haw, M. Milacic, J. Weiser, G. Wu, M. Caudy, P. Garapati, M. Gillespie, M. R. Kamdar, B. Jassal, S. Jupe, L. Matthews, B. May, S. Palatnik, K. Rothfels, V. Shamovsky, H. Song, M. Williams, E. Birney, H. Hermjakob, L. Stein, and P. D’Eustachio. The Reactome pathway knowledgebase. Nuc Acids Res, 42(Database issue):D472–7, 2014.
- [37] F. Cunningham, M. R. Amode, D. Barrell, K. Beal, K. Billis, S. Brent, D. Carvalho-Silva, P. Clapham, G. Coates, S. Fitzgerald, L. Gil, C. G. Girón, L. Gordon, T. Hourlier, S. E. Hunt, S. H. Janacek, N. Johnson, T. Juettemann, A. K. Kähäri, S. Keenan, F. J. Martin, T. Maurel, W. McLaren, D. N. Murphy, R. Nag, B. Overduin, A. Parker, M. Patricio, E. Perry, M. Pignatelli, H. S. Riat, D. Sheppard, K. Taylor, A. Thormann, A. Vullo, S. P. Wilder, A. Zadissa, B. L. Aken, E. Birney, J. Harrow, R. Kinsella, M. Muffato, M. Ruffier, S. M. Searle, G. Spudich, S. J. Trevanion, A. Yates, D. R. Zerbino, and P. Flicek. Ensembl 2015. Nuc Acids Res, 43(Database issue):D662–9, 2015.
- [38] K.D. Dahlquist, N. Salomonis, K. Vranizan, S.C. Lawlor, and B.R. Conklin. GenMAPP, a new tool for viewing and analyzing microarray data on biological pathways. Nature Genetics, 31:19–20, 2002.
- [39] J. M. Dale, L. Popescu, and P. D. Karp. Machine learning methods for metabolic pathway prediction. BMC Bioinformatics, 11:15, 2010.
- [40] D. Damerell, A. Ceroni, K. Maass, R. Ranzinger, A. Dell, and S. M. Haslam. The GlycanBuilder and GlycoWorkbench glycoinformatics tools: updates and new developments. Biol Chem, 393(11):1357–1362, 2012.
- [41] DiatomCyc. http://www.diatomcyc.org/.
- [42] M. J. Donlin. Using the generic genome browser (gbrowse). Curr Protoc Bioinformatics, Chapter 9:Unit 9.9, 2007.
- [43] R. A. Drysdale, M. A. Crosby, W. Gelbart, K. Campbell, D. Emmert, B. Matthews, S. Russo, A. Schroeder, F. Smutniak, P. Zhang, P. Zhou, M. Zytkovicz, M. Ashburner, A. de Grey, R. Foulger, G. Millburn, D. Sutherland, C. Yamada, T. Kaufman, K. Matthews, A. DeAngelo, R. K. Cook, D. Gilbert, J. Goodman, G. Grumbling, H. Sheth, V. Strelets, G. Rubin, M. Gibson, N. Harris, S. Lewis, S. Misra, and S. Q. Shu. FlyBase: Genes and gene models. Nuc Acids Res, 33:D390–D395, 2005.
- [44] EcoCyc Cellular Overview. https://ecocyc.org/overviewsWeb/celOv.shtml.
- [45] R. C. Edgar. MUSCLE: Multiple sequence alignment with high accuracy and high throughput. Nuc Acids Res, 32(5):1792–1797, 2004.
- [46] Entrez Genome. http://www.ncbi.nlm.nih.gov/genome?db=genome.
- [47] J. T. Eppig, J. A. Blake, C. J. Bult, J. A. Kadin, and J.E. Richardson. The Mouse Genome Database (MGD): facilitating mouse as a model for human biology and disease. Nuc Acids Res, 43(Database issue):D726–36, 2015.
- [48] D. Field et al. The minimum information about a genome sequence (MIGS) specification. Nature Biotechnology, 26:541–547, 2008.
- [49] E. Demir et al. The BioPAX community standard for pathway data sharing. Nat Biotechnol, 28(12):935–942, 2010.
- [50] FASTA Format. http://www.ncbi.nlm.nih.gov/blast/fasta.shtml.
- [51] T. Fuhrer, M. Zampieri, D. C. Sevin, U. Sauer, and N. Zamboni. Genome-wide landscape of gene-metabolome associations in Escherichia coli. Mol Syst Biol, 13(1):907, 2017.
- [52] A. Funahashi, M. Morohashi, and H. Kitano. CellDesigner: a process diagram editor for gene-regulatory and biochemical networks. Biosilico, 1(5):159–62, 2003.
- [53] S. Gama-Castro, V. Jiménez-Jacinto, M. Peralta-Gil, A. Santos-Zavaleta, M.I. Peñaloza Spinola, B. Contreras-Moreira, J. Segura-Salazar, L. Muñiz Rascado, I. Martínez-Flores, H. Salgado, C. Bonavides-Martínez, C. Abreu-Goodger, C. Rodríguez-Penagos, J. Miranda-Ríos, E. Morett, E. Merino, AM. Huerta, L. Treviño Quintanilla, and J. Collado-Vides. RegulonDB (version 6.0): Gene regulation model of Escherichia coli K–12 beyond transcription, active (experimental) annotated promoters and Textpresso navigation. Nuc Acids Res, 36:D120–4, 2008.
- [54] E. Gat. Point of view: Lisp as an alternative to Java. Intelligence: New Visions of AI in Practice, 11(4):21–4, 2000. http://www.flownet.com/ron/papers/lisp-java/lisp-java.pdf.
- [55] Genbank Format. http://www.ncbi.nlm.nih.gov/collab/FT/#7.1.2.
- [56] Gene Ontology Consortium. The gene ontology resource: 20 years and still going strong. Nuc Acids Res, 47:D330–D338, 2019.
- [57] Generic Feature Format Version 3 (GFF3). https://github.com/The-Sequence-Ontology/Specifications/blob/master/gff3.md.
- [58] GO Annotation File Formats. http://geneontology.org/page/go-annotation-file-formats.
- [59] Gramene Database. http://pathway.gramene.org/.
- [60] M.L. Green and P. D. Karp. A Bayesian method for identifying missing enzymes in predicted metabolic pathway databases. BMC Bioinformatics, 5(1):76, 2004. http://www.biomedcentral.com/1471-2105/5/76.
- [61] M.L. Green and P. D. Karp. The outcomes of pathway database computations depend on pathway ontology. Nuc Acids Res, 34:3687–97, 2006. http://nar.oxfordjournals.org/cgi/content/full/34/13/3687.
- [62] GutCyc. http://gutcyc.org/.
- [63] J. J. Hamilton and J. L. Reed. Software platforms to facilitate reconstructing genome-scale metabolic networks. Environ Microbiol, 16(1):49–59, 2014.
- [64] T. W. Harris, J. Baran, T. Bieri, A. Cabunoc, J. Chan, W. J. Chen, P. Davis, J. Done, C. Grove, K. Howe, R. Kishore, R. Lee, Y. Li, H. M. Muller, C. Nakamura, P. Ozersky, M. Paulini, D. Raciti, G. Schindelman, M. A. Tuli, K. Van Auken, D. Wang, X. Wang, G. Williams, J. D. Wong, K. Yook, T. Schedl, J. Hodgkin, M. Berriman, P. Kersey, J. Spieth, L. Stein, and P. W. Sternberg. Wormbase 2014: new views of curated biology. Nuc Acids Res, 42(Database issue):D789–93, 2014.
- [65] C. S. Henry, M. DeJongh, A. A. Best, P. M. Frybarger, B. Linsay, and R. L. Stevens. High-throughput generation, optimization and analysis of genome-scale metabolic models. Nat Biotechnol, 28(9):977–82, 2010.
- [66] M. Holford, N. Li, P. Nadkarni, and H. Zhao. VitaPad: Visualization tools for the analysis of pathway data. Bioinformatics, 15:1596–1602, 2004.
- [67] Z. Hu, D. M. Ng, T. Yamada, C. Chen, S. Kawashima, J. Mellor, B. Linghu, M. Kanehisa, J. M. Stuart, and C. Delisi. VisANT 3.0: New modules for pathway visualization, editing, prediction and construction. Nuc Acids Res, 35:W625–32, Jun 2007.
- [68] M. Hucka, A. Finney, B. J. Bornstein, S. M. Keating, B. E. Shapiro, J. Matthews, B. L. Kovitz, M. J. Schilstra, A. Funahashi, J. C. Doyle, and H. Kitano. Evolving a lingua franca and associated software infrastructure for computational systems biology: the Systems Biology Markup Language (SBML) project. Syst Biol (Stevenage), 1(1):41–53, 2004.
- [69] SRI International. Pathway Tools User’s Guide version 19.0. Available from SRI International, 2015.
- [70] M. D. Jankowski, C. S. Henry, L. J. Broadbelt, and V. Hatzimanikatis. Group contribution method for thermodynamic analysis of complex metabolic networks. Biophys J, 95(3):1487–99, 2008.
- [71] JavaCyc API to Pathway Tools. http://solgenomics.net/downloads/index.pl.
- [72] H. Jeong, B. Tombor, R. Albert, Z. N. Oltvai, and A.-L. Barabasi. The large-scale organization of metabolic networks. Nature, 407:651–4, 2000.
- [73] M. Kanehisa, S. Goto, M. Hattori, K. F. Aoki-Kinoshita, M. Itoh, S. Kawashima, T. Katayama, M. Araki, and M. Hirakawa. From genomics to chemical genomics: New developments in KEGG. Nuc Acids Res, 34:D354–D357, 2006.
- [74] P. Karp, M. Krummenacker, S. Paley, and J. Wagg. Integrated pathway/genome databases and their role in drug discovery. Trends in Biotechnology, 17(7):275–81, 1999.
- [75] P. Karp and S. Paley. Integrated access to metabolic and genomic data. Journal of Computational Biology, 3:191–212, 1996. http://www.ai.sri.com/pubs/papers/Karp96:Integrated/document.ps.
- [76] P. D. Karp. The design space of frame knowledge representation systems. Technical Report 520, SRI International AI Center, 1992. URL http://www.ai.sri.com/pubs/files/236.pdf.
- [77] P. D. Karp. Pathway databases: A case study in computational symbolic theories. Science, 293:2040–4, 2001.
- [78] P. D. Karp, R. Billington, R. Caspi, C. A. Fulcher, M. Latendresse, A. Kothari, I. M. Keseler, M. Krummenacker, P. E. Midford, Q. Ong, W. K. Ong, S. M. Paley, and P. Subhraveti. The BioCyc collection of microbial genomes and metabolic pathways. Briefings in Bioinformatics, 20:1085–93, 2017. https://doi.org/10.1093/bib/bbx085.
- [79] P. D. Karp, Vinay K. Chaudhri, and Suzanne M. Paley. A collaborative environment for authoring large knowledge bases. J Intelligent Information Systems, 13:155–94, 1999. http://www.ai.sri.com/pkarp/pubs/99jiis.pdf.
- [80] P. D. Karp, M. Latendresse, and R. Caspi. The Pathway Tools pathway prediction algorithm. Stand Genomic Sci, 5(3):424–429, Dec 2011.
- [81] P. D. Karp, M. Latendresse, S. M. Paley, M. Krummenacker, Q.D. Ong, R. Billington, A. Kothari, D. Weaver, T. Lee, P. Subhraveti, A. Spaulding, C. Fulcher, I.M. Keseler, and R. Caspi. Pathway Tools version 19.0 update: Software for pathway/genome informatics and systems biology. Brief Bioinform, 2015. https://academic.oup.com/bib/article/17/5/877/2261661.
- [82] P. D. Karp, M. Latendresse, S.M. Paley, M. Krummenacker, Q. Ong, R. Billington, A. Kothari, D. Weaver, T. Lee, P. Subhraveti, A. Spaulding, C. Fulcher, I.M. Keseler, and R. Caspi. Pathway Tools version 19.0: Integrated software for pathway/genome informatics and systems biology. arXiv, pages 1–79, 2015. http://arxiv.org/abs/1510.03964v2.
- [83] P. D. Karp, J.D. Lowrance, T.M. Strat, and D.E. Wilkins. The Grasper-CL graph management system. LISP and Symbolic Computation, 7:245–282, 1994.
- [84] P. D. Karp, P.E. Midford, R. Billington, A. Kothari, , M. Krummenacker, W.K. Ong, P. Subhraveti, R. Caspi, I.M Keseler, and S. M. Paley. Pathway Tools version 23.0 update: Software for pathway/genome informatics and systems biology. Brief Bioinform, 2019. in press.
- [85] P. D. Karp, P.E. Midford, S.M. Paley, M. Krummenacker, R. Billington, A. Kothari, W.K. Ong, P. Subhraveti, I.M. Keseler, and R. Caspi. Pathway Tools version 23.0: Integrated software for pathway/genome informatics and systems biology. arXiv, pages 1–111, 2019. http://arxiv.org/abs/1510.03964v3.
- [86] P. D. Karp, S. Paley, C.J. Krieger, and P. Zhang. An evidence ontology for use in pathway/genome databases. In R. Altman and T. Klein, editors, Proc Pacific Symposium on Biocomputing, pages 190–201, Singapore, 2004. World Scientific. http://www.ai.sri.com/pkarp/pubs/04psb-evidence.pdf.
- [87] P. D. Karp, S. Paley, and P. Romero. The Pathway Tools Software. Bioinformatics, 18:S225–S232, 2002.
- [88] P. D. Karp, S. M. Paley, M. Krummenacker, M. Latendresse, J.M. Dale, T. Lee, P. Kaipa, F. Gilham, A. Spaulding, L. Popescu, T. Altman, I. Paulsen, I.M. Keseler, and R. Caspi. Pathway Tools version 13.0: Integrated software for pathway/genome informatics and systems biology. Brief Bioinform, 11:40–79, 2010. http://bib.oxfordjournals.org/cgi/content/abstract/bbp043.
- [89] A. E. Kazakov, M. J. Cipriano, P. S. Novichkov, S. Minovitsky, D. V. Vinogradov, A. Arkin, A. A. Mironov, M. S. Gelfand, and I. Dubchak. RegTransBase—A database of regulatory sequences and interactions in a wide range of prokaryotic genomes. Nuc Acids Res, 35(Database issue):D407–D412, 2007.
- [90] I. M. Keseler, A. Mackie, M. Peralta-Gil, A. Santos-Zavaleta, S. Gama-Castro, C. Bonavides-Martinez, C. Fulcher, A. M. Huerta, A. Kothari, M. Krummenacker, M. Latendresse, L. Muniz-Rascado, Q. Ong, S. Paley, I. Schroder, A. G. Shearer, P. Subhraveti, M. Travers, D. Weerasinghe, V. Weiss, J. Collado-Vides, R. P. Gunsalus, I. Paulsen, and P. D. Karp. EcoCyc: Fusing model organism databases with systems biology. Nuc Acids Res, 41(Database issue):D605–12, 2013.
- [91] I. M. Keseler, A. Mackie, A. Santos-Zavaleta, R. Billington, C. Bonavides-Martinez, R. Caspi, C. Fulcher, S. Gama-Castro, A. Kothari, M. Krummenacker, M. Latendresse, L. Muniz-Rascado, Q. Ong, S. Paley, M. Peralta-Gil, P. Subhraveti, D. A. Velazquez-Ramirez, D. Weaver, J. Collado-Vides, I. Paulsen, and P. D. Karp. The EcoCyc database: Reflecting new knowledge about Escherichia coli K–12. Nuc Acids Res, 45(D1):D543–D550, 2017. https://academic.oup.com/nar/article-lookup/doi/10.1093/nar/gkw1003.
- [92] J. Klein, S. Leupold, R. Munch, C. Pommerenke, T. Johl, U. Karst, L. Jansch, D. Jahn, and I. Retter. ProdoNet: Identification and visualization of prokaryotic gene regulatory and metabolic networks. Nuc Acids Res, 36(Web Server issue):W460–4, 2008.
- [93] C. Klukas and F. Schreiber. Dynamic exploration and editing of KEGG pathway diagrams. Bioinformatics, 23(3):344–350, 2007.
- [94] Nobuaki Kono, Kazuharu Arakawa, Ryu Ogawa, Nobuhiro Kido, Kazuki Oshita, Keita Ikegami, Satoshi Tamaki, and Masaru Tomita. Pathway Projector: Web-based zoomable pathway browser using KEGG Atlas and Google Maps API. PLoS ONE, 4(11):e7710, 11 2009. http://dx.doi.org/10.1371%2Fjournal.pone.0007710.
- [95] L. Krishnamurthy, J. Nadeau, G. Ozsoyoglu, M. Ozsoyoglu, G. Schaeffer, M. Tasan, and W. Xu. Pathways database system: An integrated system for biological pathways. Bioinformatics, 19(8):930–937, May 2003.
- [96] M. Krummenacker, M. Latendresse, and P. D. Karp. Metabolic route computation in organism communities. Microbiome, 7:89–96, 2019. https://doi.org/10.1186/s40168-019-0706-6.
- [97] M. Krummenacker, S. Paley, L. Mueller, T. Yan, and P. D. Karp. Querying and computing with BioCyc databases. Bioinformatics, 21:3454–5, 2005. http://bioinformatics.oxfordjournals.org/cgi/reprint/21/16/3454.
- [98] M. Lakshmanan, G. Koh, B. K. Chung, and D. Y. Lee. Software applications for flux balance analysis. Brief Bioinform, 15(1):108–22, 2014.
- [99] M. Latendresse, M. Krummenacker, and P. D. Karp. Optimal metabolic route search based on atom mappings. Bioinformatics, 30:2043–50, 2014.
- [100] M. Latendresse, J.P. Malerich, M. Travers, and P. D. Karp. Accurate atom-mapping computation for biochemical reactions. J Chem Inf Model, 2012.
- [101] Mario Latendresse. Efficiently gap-filling reaction networks. BMC Bioinformatics, 15:225, 2014. http://dx.doi.org/10.1186/1471-2105-15-225.
- [102] T.J. Lee, I. Paulsen, and P. D. Karp. Annotation-based inference of transporter function. Bioinformatics, 24:i259–67, 2008. http://bioinformatics.oxfordjournals.org/cgi/content/full/24/13/i259.
- [103] T.J. Lee, Y. Pouliot, V. Wagner, P. Gupta, D.W.J. Stringer-Calvert, J.D. Tenenbaum, and P. D. Karp. BioWarehouse: A bioinformatics database warehouse toolkit. BMC Bioinformatics, 7:170, 2006. http://www.biomedcentral.com/1471-2105/7/170.
- [104] H. W. Ma, B. Kumar, U. Ditges, F. Gunzer, J. Buer, and A. P. Zeng. An extended transcriptional regulatory network of Escherichia coli and analysis of its hierarchical structure and network motifs. Nuc Acids Res, 32(22):6643–6649, 2004.
- [105] V. M. Markowitz, I. M. Chen, K. Palaniappan, K. Chu, E. Szeto, M. Pillay, A. Ratner, J. Huang, T. Woyke, M. Huntemann, I. Anderson, K. Billis, N. Varghese, K. Mavromatis, A. Pati, N. N. Ivanova, and N. C. Kyrpides. IMG 4 version of the integrated microbial genomes comparative analysis system. Nuc Acids Res, 42(Database issue):D560–D567, 2014.
- [106] Marvin Chemical Editor. http://www.chemaxon.com/products/marvin/.
- [107] V. Matys, O. V. Kel-Margoulis, E. Fricke, I. Liebich, S. Land, A. Barre-Dirrie, I. Reuter, D. Chekmenev, M. Krull, K. Hornischer, N. Voss, P. Stegmaier, B. Lewicki-Potapov, H. Saxel, A. E. Kel, and E. Wingender. TRANSFAC and its module TRANSCompel: Transcriptional gene regulation in eukaryotes. Nuc Acids Res, 34(Database issue):D108–D110, 2006.
- [108] S. J. McKay, I. A. Vergara, and J. E. Stajich. Using the Generic Synteny Browser (GBrowse_syn). Curr Protoc Bioinformatics, Chapter 9:Unit 9.12, 2010.
- [109] P.E. Midford, M. Latendresse, P. O’Maille, and P. D. Karp. Using pathway covering to explore connections among metabolites. Metabolites, 9(5):88, 2019.
- [110] L.A. Mueller, P. Zhang, and S.Y. Rhee. AraCyc, a biochemical pathway database for Arabidopsis. Plant Physiology, 132:453–460, 2003.
- [111] H. M. Muller, E. E. Kenny, and P. W. Sternberg. Textpresso: An ontology-based information retrieval and extraction system for biological literature. PLoS Biol, 2(11):e309, Nov 2004.
- [112] S. Okuda, T. Yamada, M. Hamajima, M. Itoh, T. Katayama, P. Bork, S. Goto, and M. Kanehisa. KEGG atlas mapping for global analysis of metabolic pathways. Nuc Acids Res, 36:W423–26, 2008.
- [113] S. Okuda, T. Yamada, M. Hamajima, M. Itoh, T. Katayama, P. Bork, S. Goto, and M. Kanehisa. KEGG Atlas mapping for global analysis of metabolic pathways. Nuc Acids Res, 36(suppl 2):W423–6, 2008. http://nar.oxfordjournals.org/content/36/suppl_2/W423.abstract.
- [114] C. Ouzounis and P. D. Karp. Global properties of the metabolic map of Escherichia coli. Genome Research, 10:568, 2000.
- [115] R. Overbeek, R. Olson, G. D. Pusch, G. J. Olsen, J. J. Davis, T. Disz, R. A. Edwards, S. Gerdes, B. Parrello, M. Shukla, V. Vonstein, A. R. Wattam, F. Xia, and R. Stevens. The SEED and the Rapid Annotation of microbial genomes using Subsystems Technology (RAST). Nuc Acids Res, 42(Database issue):D206–D214, 2014.
- [116] Z. M. Ozsoyoglu, G. Ozsoyoglu, and J. Nadeau. Genomic pathways database and biological data management. Anim Genet, 37 Suppl 1:41–47, Aug 2006.
- [117] MicroScope Home Page. https://www.genoscope.cns.fr/agc/microscope/home/index.php.
- [118] SCIP Software Home Page. http://scip.zib.de/.
- [119] S. Paley and P. D. Karp. Evaluation of computational metabolic-pathway predictions for H. pylori. Bioinformatics, 18(5):715–24, 2002.
- [120] S. Paley and P. D. Karp. Update notifications for the BioCyc collection of databases. Database, 2017:bax086, 2017.
- [121] S. Paley, P. E. O’Maille, D. Weaver, and P. D. Karp. Pathway collages: Personalized multi-pathway diagrams. BMC Bioinformatics, 17(1):529–38, 2016.
- [122] S. M. Paley and P. D. Karp. Adapting EcoCyc for use on the World Wide Web. Gene, 172:GC43–GC50, 1996.
- [123] S. M. Paley and P. D. Karp. The Pathway Tools cellular overview diagram and omics viewer. Nuc Acids Res, 34:3771–8, 2006. http://nar.oxfordjournals.org/cgi/content/full/34/13/3771.
- [124] S. M. Paley, K. Parker, A. Spaulding, J.F. Tomb, P. O’Maille, and P. D. Karp. The Omics Dashboard for interactive exploration of gene-expression data. Nuc Acids Res, 2017. https://academic.oup.com/nar/article/45/21/12113/4508872.
- [125] Pathway Tools Cell Component Ontology. http://bioinformatics.ai.sri.com/CCO/.
- [126] Pathway Tools Data-File Formats. http://bioinformatics.ai.sri.com/ptools/flatfile-format.html.
- [127] Pathway Tools Data-File Formats. http://bioinformatics.ai.sri.com/ptools/flatfile-format.html.
- [128] Pathway Tools Evidence Ontology. http://bioinformatics.ai.sri.com/evidence-ontology/.
- [129] Pathway Tools PGDB Registry. https://BioCyc.org/registry.html.
- [130] Pathway Tools Web Services. https://biocyc.org/web-services.shtml.
- [131] Pathway/Genome Database Websites. https://BioCyc.org/otherpgdbs.shtml.
- [132] PerlCyc API to Pathway Tools. http://solgenomics.net/downloads/perlcyc.pl.
- [133] PlantCyc Website. http://plantcyc.org/.
- [134] PseudoCyc Database. http://v2.pseudomonas.org:1555/.
- [135] PythonCyc API to Pathway Tools. http://bioinformatics.ai.sri.com/ptools/pythoncyc.html.
- [136] Querying Pathway/Genome Databases. http://brg.ai.sri.com/ptools/ptools-resources.html.
- [137] RCyc API to Pathway Tools. https://github.com/taltman/RCyc/blob/master/DESCRIPTION.
- [138] P. Romero and P. D. Karp. Using functional and organizational information to improve genome-wide computational prediction of transcription units on Pathway/Genome Databases. Bioinformatics, 20:709–17, 2004.
- [139] K. R. Rosenbloom, J. Armstrong, G. P. Barber, J. Casper, H. Clawson, M. Diekhans, T. R. Dreszer, P. A. Fujita, L. Guruvadoo, M. Haeussler, R. A. Harte, S. Heitner, G. Hickey, A. S. Hinrichs, R. Hubley, D. Karolchik, K. Learned, B. T. Lee, C. H. Li, K. H. Miga, N. Nguyen, B. Paten, B. J. Raney, A. F. Smit, M. L. Speir, A. S. Zweig, D. Haussler, R. M. Kuhn, and W. J. Kent. The UCSC Genome Browser database: 2015 update. Nuc Acids Res, 43(Database issue):D670–81, 2015.
- [140] Saccharomyces Genome Database. http://www.yeastgenome.org/.
- [141] N. Salomonis, K. Hanspers, A. C. Zambon, K. Vranizan, S. C. Lawlor, K. D. Dahlquist, S. W. Doniger, J. Stuart, B. R. Conklin, and A. R. Pico. GenMAPP 2: New features and resources for pathway analysis. BMC Bioinformatics, 8:217–28, 2007.
- [142] SBML. http://www.sbml.org/.
- [143] T. Selmer and P. I. Andrei. p-Hydroxyphenylacetate decarboxylase from Clostridium difficile. A novel glycyl radical enzyme catalysing the formation of p-cresol. Eur J Biochem, 268(5):1363–1372, 2001.
- [144] P. Shannon, A. Markiel, O. Ozier, N. S. Baliga, J. T. Wang, D. Ramage, N. Amin, B. Schwikowski, and T. Ideker. Cytoscape: A software environment for integrated models of biomolecular interaction networks. Genome Research, 13(11):2498–2504, Nov 2003.
- [145] N. Sierro, Y. Makita, M. de Hoon, and K. Nakai. DBTBS: a database of transcriptional regulation in Bacillus subtilis containing upstream intergenic conservation information. Nuc Acids Res, 36(Database issue):D93–6, 2008.
- [146] M. E. Skinner, A. V. Uzilov, L. D. Stein, C. J. Mungall, and I. H. Holmes. JBrowse: a next-generation genome browser. Genome Research, 19(9):1630–1638, 2009.
- [147] SKIPPY – Read and Write GIF Files with Common Lisp. http://www.xach.com/lisp/skippy/.
- [148] D. Smedley, S. Haider, B. Ballester, R. Holland, D. London, G. Thorisson, and A. Kasprzyk. BioMart — biological queries made easy. BMC Genomics, 10:22–33, 2009.
- [149] SOLR Website. http://lucene.apache.org/solr/resources.html.
- [150] SoyCyc Database. http://soycyc.soybase.org/.
- [151] L. D. Stein, C. Mungall, S. Shu, M. Caudy, M. Mangone, A. Day, E. Nickerson, J. E. Stajich, T. W. Harris, A. Arva, and S. Lewis. The generic genome browser: A building block for a model organism system database. Genome Research, 12(10):1599–1610, Oct 2002.
- [152] S. E. Stein, S. R. Heller, and D. Tchekhovskoi. An open standard for chemical structure representation: The IUPAC chemical identifier. In Proc. 2003 International Chemical Information Conference (Nimes), pages 131–43, 2003.
- [153] G.N. Stephanopoulos, A.A. Aristidou, and J. Nielsen. Metabolic Engineering: Principles and Methodologies. Academic Press, San Diego, CA, 1998.
- [154] M. Sud, E. Fahy, D. Cotter, K. Azam, I. Vadivelu, C. Burant, A. Edison, O. Fiehn, R. Higashi, K. S. N. S. Sumner, and S. Subramaniam. Metabolomics Workbench: An international repository for metabolomics data and metadata, metabolite standards, protocols, tutorials and training, and analysis tools. Nuc Acids Res, 44:D463–D470, 2015.
- [155] Supplemental Figures. http://www.ai.sri.com/pkarp/pubs/pt20suppfigs4.pdf.
- [156] The BioVelo Query Language. https://biocyc.org/bioveloLanguage.html.
- [157] I. Thiele and B. Ø. Palsson. A protocol for generating a high-quality genome-scale metabolic reconstruction. Nat Protoc, 5(1):93–121, 2010.
- [158] S. G. Thorleifsson and I. Thiele. rBioNet: A COBRA toolbox extension for reconstructing high-quality biochemical networks. Bioinformatics, 27(14):2009–10, 2011.
- [159] M. Travers, S. M. Paley, J. Shrager, T.A. Holland, and P. D. Karp. Groups: Knowledge spreadsheets for symbolic biocomputing. Database, pages 1–12, 2013. http://database.oxfordjournals.org/content/2013/bat061.abstract.
- [160] TrypanoCyc Database. http://vm-trypanocyc.toulouse.inra.fr/TRYPANO/organism-summary.
- [161] UniProt Sequence annotation (Features). http://www.uniprot.org/help/sequence_annotation.
- [162] USDA Bacterial Genome PGDBs. https://pathwaytools.scinet.science/.
- [163] M. P. van Iersel, T. Kelder, A. R. Pico, K. Hanspers, S. Coort, B. R. Conklin, and C. Evelo. Presenting and exploring biological pathways with Pathvisio. BMC Bioinformatics, 9:399, 2008.
- [164] VitisCyc and other Databases. http://pathways.cgrb.oregonstate.edu/metabolic.html.
- [165] J. von Wulffen, A. Ulmer, G. Jager, O. Sawodny, and R. Feuer. Rapid sampling of Escherichia coli after changing oxygen conditions reveals transcriptional dynamics. Genes (Basel), 8(3):90–114, 2017.
- [166] H. Wang, Y. Su, A. J. Mackey, E. T. Kraemer, and J. C. Kissinger. SynView: a GBrowse-compatible approach to visualizing comparative genome data. Bioinformatics, 22(18):2308–2309, 2006.
- [167] A. R. Wattam, D. Abraham, O. Dalay, T. L. Disz, T. Driscoll, J. L. Gabbard, J. J. Gillespie, R. Gough, D. Hix, R. Kenyon, D. Machi, C. Mao, E. K. Nordberg, R. Olson, R. Overbeek, G. D. Pusch, M. Shukla, J. Schulman, R. L. Stevens, D. E. Sullivan, V. Vonstein, A. Warren, R. Will, M. J. Wilson, H. S. Yoo, C. Zhang, Y. Zhang, and B. W. Sobral. PATRIC, the bacterial bioinformatics database and analysis resource. Nuc Acids Res, 42(Database issue):D581–D591, 2014.
- [168] D. Weininger. SMILES, a chemical language and information system. 1. Introduction to methodology and encoding rules. J Chem Inf Comput Sci, 28:31–36, 1988.
- [169] Yahoo User Interface Library. http://developer.yahoo.com/yui/.
- [170] T. Yan, D. Yoo, T. Z. Berardini, L. A. Mueller, D. C. Weems, S. Weng, J. M. Cherry, and S. Y. Rhee. PatMatch: a program for finding patterns in peptide and nucleotide sequences. Nuc Acids Res, 33(Web Server issue):W262–6, 2005.
- [171] I. Yeh, T. Hanekamp, S. Tsoka, P. D. Karp, and R.B. Altman. Computational analysis of Plasmodium falciparum metabolism: Organizing genomic information to facilitate drug discovery. Genome Research, 14(5):917–24, 2004.
- [172] N. Y. Yu, M. R. Laird, C. Spencer, and F. S. Brinkman. PSORTdb–an expanded, auto-updated, user-friendly protein subcellular localization database for Bacteria and Archaea. Nuc Acids Res, 39(Database issue):D241–4, 2011.