Discovery of molecular gas around HD 131835 in an APEX molecular line survey of bright debris disks
Abstract
Debris disks are considered to be gas-poor, but recent observations revealed molecular or atomic gas in several 10–40 Myr old systems. We used the APEX and IRAM 30m radiotelescopes to search for CO gas in 20 bright debris disks. In one case, around the 16 Myr old A-type star HD131835, we discovered a new gas-bearing debris disk, where the CO 3–2 transition was successfully detected. No other individual system exhibited a measurable CO signal. Our Herschel Space Observatory far-infrared images of HD 131835 marginally resolved the disk both at 70 and 100µm, with a characteristic radius of 170 au. While in stellar properties HD 131835 resembles Pic, its dust disk properties are similar to those of the most massive young debris disks. With the detection of gas in HD 131835 the number of known debris disks with CO content has increased to four, all of them encircling young (40 Myr) A-type stars. Based on statistics within 125 pc, we suggest that the presence of detectable amount of gas in the most massive debris disks around young A-type stars is a common phenomenon. Our current data cannot conclude on the origin of gas in HD 131835. If the gas is secondary, arising from the disruption of planetesimals, then HD 131835 is a comparably young and in terms of its disk more massive analogue of the Pic system. However, it is also possible that this system similarly to HD 21997 possesses a hybrid disk, where the gas material is predominantly primordial, while the dust grains are mostly derived from planetesimals.
Subject headings:
circumstellar matter — infrared: stars — stars: individual (HD 131835)1. Introduction
Stars can be accompanied by circumstellar matter throughout their life. In the early phase of their evolution, they are surrounded by massive gas-rich primordial disks that form during the collapse of the molecular cloud core as a consequence of angular momentum conservation (e.g., Williams & Cieza, 2011). According to the current paradigm, most of these disks dissipate within a few million years (Zuckerman et al., 1995; Pascucci et al., 2006). During this evolution disk material accretes onto the star, forms planets, or is removed from the system through outflows and photoevaporation (Alexander et al., 2014, and references therein). What left is a tenuous debris disk which differs from their predecessors in many ways. Dust grains in these disks are second generation: collisional erosion and evaporation of previously formed planetesimals provides a continuous replenishment of dust particles removed by the stellar radiation or wind on a significantly shorter timescale than the age of the star (Backman & Paresce, 1993; Wyatt, 2008; Krivov, 2010). Debris disks are thought to be gas-poor with a significantly lower gas-to-dust ratio than that of primordial disks (e.g. Matthews et al., 2014), because processes like collisions, evaporation, and photodesorption from icy grains only produce a small amount of secondary gas (Beust et al., 1994; Czechowski & Mann, 2007; Grigorieva et al., 2007; Zuckerman & Song, 2012).
One way to study the dust component in debris disks is to observe its thermal emission at infrared (IR) and millimeter wavelengths. Thanks to a series infrared space missions now we know hundreds of debris disks. The spectral energy distribution (SED) of the disks’ excess emission is routinely used to infer their fundamental properties such as the characteristic dust temperature and the amount of dust grains, while resolved images give information about their spatial extent and even the grain size distribution (e.g. Booth et al., 2013; Morales et al., 2013; Pawellek et al., 2014). Due to the intimate link between the grains and larger parent planetesimals the study of dust disk properties can also give insight into the characteristics and evolution of parent planetesimal belt(s) (Wyatt, 2008).
Observing the signatures of presumably very small amounts of gas is a more challenging task. Despite extensive surveys (Dent et al., 2005, 2013; Moór et al., 2011a; Hales et al., 2014; Riviere-Marichalar et al., 2014; Rigliaco et al., 2015), the number of debris disks with known gas component is still very limited. In the edge-on disks around Pic and HD 32297 the gas was firstly detected via absorption lines (Slettebak, 1975; Hobbs et al., 1985; Redfield, 2007). At 49 Cet and HD 21997 a substantial amount of CO gas has been observed (Zuckerman et al., 1995; Moór et al., 2011a), while the gaseous disks around HD 172555, HD 181296 and AU Mic were identified based on O I, C II and fluorescent H2 line emissions, respectively (Riviere-Marichalar et al., 2012, 2014; France et al., 2007). Recently, Rigliaco et al. (2015) identified H I (7–6) lines in the mid-infrared Spitzer/IRS spectra of 8 young (5–20 Myr old) F7-K0 type stars that hosted debris disks. It is yet an open question whether these emission lines are linked to low level accretional processes and thereby indicate the presence of long lived gaseous circumstellar disks or they have pure chromospheric origin (Rigliaco et al., 2015).
While debris dust disks have been found around stars with a variety of ages the current sample of gaseous disks is mostly limited to young (typically 10–40 Myr old) stars. The origin of gas in these systems is not unambiguous yet. Because of their relatively young age we cannot exclude that some of them harbor hybrid disks where the dust has secondary origin and produced from planetesimals, while the gas is predominantly primordial, the remnant of the original disk. Indeed, as one of the early discoveries of ALMA, our group identified such a hybrid disk around the 30-Myr-old HD 21997 (Kóspál et al., 2013). This discovery challenges the current paradigm on the timescale of primordial disk evolution. Nevertheless, based on this small and, in many ways, limited sample we cannot draw general and comprehensive conclusions about the production mechanism and long term evolution of the gas component in debris disks.
Motivated to find additional examples of gaseous debris disks and scrutinize the fundamental properties of their gas and dust contents, we used the Atacama Pathfinder Experiment111This publication is based on data acquired with the Atacama Pathfinder Experiment (APEX). APEX is a collaboration between the Max-Planck-Institut fur Radioastronomie, the European Southern Observatory, and the Onsala Space Observatory. and the IRAM 30m222Based on observations carried out with the IRAM 30m Telescope. IRAM is supported by INSU/CNRS (France), MPG (Germany) and IGN (Spain). radio telescopes to search for molecular gas in 20 debris disks in the rotational lines of CO. This work is a continuation of our similar survey of 20 objects (Moór et al., 2011a). In this paper we review the results of the new survey and report on the discovery of a gaseous debris disk around HD 131835, a 16 Myr old member of the Upper Centaurus Lupus association. For this object we present additional photometric and spectroscopic observations with the Herschel Space Observatory (Pilbratt et al., 2010).
2. Observations and data reduction
2.1. Sample selection
In our previous survey we searched for gas in 20 young (50 Myr) debris disks with high fractional luminosity () around A- and F-type stars (Moór et al., 2011a). The current project focuses on 20 additional debris disks. We included seven disks where the selection criteria were similar to those applied in the first survey, except that we allowed lower fractional luminosities down to . We added four targets (HD 10939, HD 17848, HD 161868 and HD 182681) which are similar to the gaseous 49 Cet and HD 21997 systems in that they harbor cold, very extended debris disks. By including six debris disks around G–K-type star we also extended the sample to Sun-like stars. Recently, Montgomery & Welsh (2012) and Welsh & Montgomery (2013) reported nightly variability of the Ca II K absorption line in the spectra of some A-type debris disk host stars, indicating the presence of circumstellar gas. Note that among the known gaseous disks, Pic, 49 Ceti, and HD 172555 also show similar variable Ca absorption (Ferlet et al., 1987; Montgomery & Welsh, 2012; Kiefer et al., 2014). Thus we selected three nearby (75 pc) targets, HD 110411, HD 182919, and HD 183324, from this sample. Basic properties of the selected targets are summarized in Table 1.
2.2. CO line observations
Observations with APEX.
The majority of our observations were carried out with the 12 m Atacama Pathfinder Experiment radio telescope (APEX, Güsten et al., 2006) in the framework of three different programmes. All of our targets were observed in the =32 transition of 12CO at a rest frequency of = 345.796 GHz. In program M-087.F-0001-2011 the observations were performed with the Swedish Heterodyne Facility Instrument/APEX2 (SHeFI, Vassilev et al., 2008) receiver, while in M-092.F-0012-2013 and M-093.F-0010-2014 the First Light APEX Submillimeter Heterodyne receiver (FLASH+, Klein et al., 2014) was used. The latter is a dual-frequency receiver that operates simultaneously in the 345 GHz and 461 GHz atmospheric windows, therefore we obtained 12CO =43 line ( = 461.041 GHz) observations as well. For HD 131835, CO (2–1) line observations were also conducted using the SHeFI/APEX1 instrument.
For SHeFI observations acquired before June 2011 we utilized the Fast Fourier Transform Spectrometer (FFTS) backend with a spectral resolution of 488 kHz (0.42 km s-1 at =3–2 transition). For later SHeFI measurements the eXtended bandwidth Fast Fourier Transform Spectrometer (XFFTS, Klein et al., 2012) with 32768 channels providing a spectral resolution of 77 kHz (0.066 kms-1 at =3–2 transition) was connected to the receiver. FLASH+ was always connected to the XFFTS backend. Beam sizes of APEX are 27″, 18″ and 14″ at 230, 345 and 460 GHz, respectively. All of our APEX observations were performed in on-off observing mode.
The CO (3–2) spectral line observations of HD 131835 were further supplemented by yet unpublished measurements obtained in our previous APEX programme E-083.C-0303 (for details see, Moór et al., 2011a).
Observations with the IRAM 30 m telescope.
The three targets selected because of variable Ca II K absorption line were observed with the IRAM 30 m telescope using the multi-band heterodyne Eight MIxer Receiver (EMIR, Carter et al., 2012) as part of the IRAM programme No. 172-13. We searched for gas in our targets at 230.538 GHz, the transition of the 12CO. The observations were conducted in wobbler-switching on-off mode with a wobbler throw of 60″. For the backend, we used the new Fast Fourier Transform Spectrometer (FTS) with a frequency resolution of 200 kHz providing a velocity resolution of 0.25 km s-1 in the =21 transition. Table 2 summarizes the main characteristics of the observing programmes.
Data reduction.
Both the APEX and IRAM spectra have been processed using the GILDAS/CLASS package333http://iram.fr/IRAMFR/GILDAS/. For the final average spectrum, we discarded noisy scans and a baseline was subtracted from each individual scan. The baseline was typically linear, except for a few cases where we used second order polynomials. The final spectrum was derived as an average of the individual spectra weighted by the inverse square of their rms noise. As a final step the obtained antenna temperatures were converted to line flux densities. For the APEX data we used Kelvin-to-Jansky conversion factors of 39, 41, and 48 Jy K-1 for CO (2–1), CO (3–2), and CO (4–3) transitions, respectively. For the IRAM CO (2–1) observations the corresponding number was 7.8 Jy K-1. These conversion factors were taken from the relevant APEX444http://www.apex-telescope.org/telescope/efficiency/ and IRAM555http://www.iram.es/IRAMES/mainWiki/Iram30mEfficiencies home pages.
Outcome of the survey.
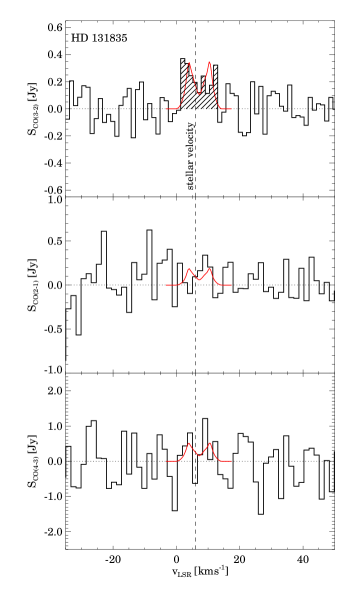
CO emission was evident only for HD 131835, where the integrated line flux of the 3–2 transition was successfully detected at a 5.0 level. Figure 1 shows the baseline subtracted CO (3–2) profile of this target. The measured line has a width of roughly 12 km s-1 and is centred at a velocity of 7.2 km s-1 with respect to the Local Standard of Rest (LSR), in very good agreement with the systemic LSR velocity of the star (6.11.1 km s-1, computed from the radial velocity derived in Sect. 3.1). The measured line tentatively shows a double peak profile in accordance what we expect for a gas disk in Keplerian rotation around a star. The peak flux is 370 mJy, the integrated line flux – obtained by integrating the line over a 12 km s-1 interval – is 2.740.55 Jy km s-1. By inspecting the same velocity interval in the =2–1 and 4–3 spectra (Fig. 1) we found no statistically significant evidence for lines, the obtained integrated line fluxes are 1.600.78 and 4.462.99 Jy km s-1, respectively. We note that HD 131835 was previously observed in the CO 2–1 transition by Kastner et al. (2010) resulting in a non-detection. This observation was about two times less sensitive than ours. Assuming a linewidth of 5 km s-1, Zuckerman & Song (2012) deduced a 5 line flux upper limit of 5.1 Jy km s-1 from this measurement, that is compatible with our result.
None of our other targets were detected at any of the CO transitions. For these sources, upper limits were computed as where is the 1 measured noise, is the velocity channel width, and is the number of velocity channels over an interval of 10 km s-1. The obtained line fluxes and upper limits are listed in Table 1.
2.3. Additional observations for HD 131835
Because of the detection of CO (Sect. 2.2), for HD 131835 we performed several additional observations. In order to better characterize its spectral energy distribution at far infrared/submillimeter wavelengths and to search for O I and C II emission from the disk we obtained photometric and spectroscopic measurements using the Photodetector Array Camera and Spectrometer (PACS, Poglitsch et al., 2010) and the Spectral and Photometric Imaging Receiver (SPIRE, Griffin et al., 2010) onboard the Herschel Space Observatory (program id OT2_amoor_3). These data were complemented by mid-infrared spectra obtained with the Spitzer Space Telescope (Werner et al., 2004). To investigate the stellar properties a high-resolution ground-based optical spectrum was also taken.
2.3.1 Herschel Observations
PACS maps.
Far-infrared maps were obtained with the PACS detector on 2012 September 9 and 11 in mini scan-map mode (PACS Observer’s Manual v2.5666http://herschel.esac.esa.int/Docs/PACS/html/pacs_om.html) using a scan speed of 20″ s-1 with 10 scan-legs of 3′ length separated by 4″. We made two scans with scan angles of 70 and 110 both at 70 µm (OBSID: 1342250784, 1342250785) and at 100 µm (OBSID: 1342250868, 1342250869). Since the PACS photometer observed in two bands simultaneously (at 160µm in addition to 70µm or 100µm) these measurements provided four 160µm scans as well.
Data processing was done with the Herschel Interactive Processing Environment (HIPE, Ott, 2010) version 13 using PACS calibration tree No. 65 and the standard HIPE script optimized for the reduction of bright sources. Additionally we used the recently developed ”gyro” correction to reduce the pointing jitter. We selected only those data frames from the timeline where the actual scan speed of the spacecraft was between 15 and 25″ s-1. To eliminate the marked low-frequency (1/f) noise we applied highpass filtering with filter width parameters of 15, 20, and 35 for the 70, 100, and 160µm data, respectively. In order to avoid flux loss the 25″ radius vicinity of our targets was excluded from the filtering. For glitch removal we used the second-level deglitching algorithm. As a final step, in each band we applied the ’photProject’ task to combine all frames into a map using the default pixel fraction (1.0) and pixel sizes of 11, 14, and 21 at 70, 100, and 160 µm, respectively.
HD 131835 was clearly detected in all PACS bands. We performed aperture photometry on the source using a radius of 18″, while the sky background was estimated in an annulus between 40″ and 50″. The aperture was placed at the source’s centroid position. The offsets between the derived centroids and the targets’ optical position (corrected for the proper motion using the epochs of PACS observations) were 1″ in all bands. For sky noise determination, we distributed sixteen apertures with radii of 18″ (identical to the the source aperture) randomly along the background annulus. By performing aperture photometry without background subtraction in each aperture, we computed the sky noise as the standard deviation of these background flux values. We applied aperture correction in each band, by using correction factors taken from the calibration file attached to the measurement. To derive the final uncertainty of our photometry we added the measurement errors and the calibration uncertainty (7%, Balog et al., 2014) quadratically. The obtained flux density values and their uncertainties are listed in Table 3.
PACS spectroscopy.
We carried out PACS spectroscopic observations centred on the O I 63µm (OBSID: 1342248686) and the C II 158µm (OBSID: 1342248687) lines. These fine structure lines if arising from circumstellar disks are unresolved in Herschel PACS observations. Observations were performed on 2012 July 29 using the Line Spectroscopy observing template that enables the coverage of a small wavelength interval around these lines. To efficiently eliminate telescope and sky background, the measurements were obtained in chop-nod mode. The PACS spectrometer array consists of 55 spectral pixels (spaxel), each having a size of 94. We made small 33 and 22 raster maps with raster point/line step sizes of 3″ and 2″ for the O I and C II observations, respectively. The maps were centred on the target, and they were repeated two and four times in the case of O I and C II observations, respectively.
Raster map observing mode has been selected to mitigate the risk of eventual pointing offsets of the telescope significant larger than 2″. While the 47″47″ spatial footprint of the integral field unit is sufficiently large to almost entirely cover the spectrometer spatial beam, a single spaxel of 9.4″9.4″ size is strongly undersampling the beam especially at the short wavelength of the O I line. As a consequence of undersampling, in the baseline pointed observing scheme the spectrum of a point source is extracted from the central spaxel of the 55 unit applying a correction for fluxes due to small pointing offsets from the centre of the central spaxel and point jitter. However, if the source flux is lower than about a few Jy per spaxel then correction factors estimated from the source continuum sampled by the eight neighbors of the central spaxel may become unreliable and the spectrum extracted from the central spaxel may have to be left uncorrected for mispointing.
To overcome this problem, we apply mapping observation of the same field of view with sub-spaxel raster step size. When data from raster positions is combined the sampling of the beam is highly improved even in case of an eventual pointing offset of the raster central position. This technique directly provides a high resolution image of the source where the spectrum can be extracted within a synthetic aperture centered on the measured peak position.
We apply the telescope normalization scheme for spectro-photometric flux calibration, where the Herschel telescope background calibrated on Neptune is used as an absolute radiometric reference. The method efficiently eliminates any drifts with time in the system response at the frequency of individual chopper cycles resulting the offset signals in nod A and nod B positions perfectly cancel each other. This method may improve signal-to-noise - especially for faint sources in the sub-Jansky per spaxel regime - comparing to the baseline flux calibration method which relies on response estimates from calibration blocks executed at the beginning of the observation and propagated to the covered wavelength range through the relative spectral response function.
Flux calibrated IFU cubes obtained at subsequent raster positions are combined into a single spectral cube using a 3D drizzling algorithm (Regibo, 2012) available in the PACS interactive pipeline in HIPE. The strength of the drizzling algorithm is that the convolution with the detector footprint is minimized especially when we apply the ”gyro” improved high spatial resolution reconstruction of instantaneous pointing jitter. The projected pixel size is adjusted to Nyquist sample the beam at the line central wavelength.
In the last data processing step, spectra from the drizzled spectral cube are combined within an extraction aperture of 6.3″ radius centered on the source position.
Figure 2 shows the obtained O I and C II spectra. Though in the C II spectrum there is a peak at 157.7µm its significance is only 2.3 , thus neither the O I or C II line was detected towards our target. In order to derive upper limits for the line fluxes we used the continuum subtracted spectra and determined the rms noise () in a 20 pixels wide window centred on the expected line wavelength. The upper limits were computed as where is the width of one pixel in Hz, while is the width of an unresolved emission line in pixels. Values of were calculated as the ratio of the full width half maximum (FWHM) of unresolved lines (taken from PACS Observer’s Manual v2.5, 0.020µm and 0.126µm for O I and C II spectra, respectively) to the appropriate pixel widths (in µm). The obtained upper limits for the O I and C II lines are 1.510-18 Wm-2 and 5.310-19 Wm-2, respectively.

SPIRE maps.
We observed HD 131835 with the SPIRE Photometer on 2012 August 9, in Small Scan Map mode (Spire Handbook v2.5777http://herschel.esac.esa.int/Docs/SPIRE/spire_handbook.pdf) at 250, 350, and 500 µm simultaneously. Data were processed with HIPE 13 following the standard pipeline processing steps with default values for all applied tasks. The final maps were produced using the ’naiveMapper’ task. The beam sizes are 176, 239, and 352 at 250, 350, and 500 µm, respectively, and the maps were resampled to pixel sizes of 6″, 10″, and 14″ at these wavelengths.
Our target is detected in all bands. We used point-spread function (PSF) photometry to extract the source fluxes, the corresponding SPIRE beam profiles were taken from the calibration context. This method yielded flux densities of 156.47.6 mJy, 84.36.9 mJy, and 35.48.6 mJy at 250, 350, and 500 µm, respectively. In order to validate our flux values the photometry was also performed using the SPIRE Timeline Fitter task in HIPE. Instead of using the final maps, this task fits two dimensional elliptical or circular Gaussian functions to the baseline-subtracted timeline data of the photometer at the coordinates of the source (Bendo et al., 2013). The radius of the region that includes the peak of the source was set to 22″, 30″, 42″ for 250, 350, and 500 µm maps. The background was estimated from an annulus between 300″ and 350″ centred on the source. At 250 and 350 µm we used elliptical Gaussian during the fitting, at 500 µm, because of the source’s lower signal-to-noise ratio, we applied a circular Gaussian. Using the Timeline Fitter we obtained flux densities of 165.44.4 mJy, 77.84.4 mJy, and 44.18.3 mJy at 250, 350, and 500 µm, respectively, in good accordance with the ones derived from PSF photometry. In the following analysis, we will use the PSF photometry. The final uncertainties were derived as the quadratic sum of the measurement errors and the overall calibration uncertainty of the SPIRE photometer (5.5% Bendo et al., 2013). The derived results are quoted in Table 3.
2.3.2 Spitzer/IRS observation
HD 131835 was observed with the InfraRed Spectrograph (IRS, Houck et al., 2004) twice, first on 2007 August 30 (PID40651), then on 2008 April 1 (PID40235). Both spectra were obtained in Staring mode using the low-resolution IRS modules (SL and LL), covering the m wavelength range with a spectral resolution of . We retrieved the processed spectra from the CASSIS888The Cornell Atlas of Spitzer/IRS Sources (CASSIS) is a product of the Infrared Science Center at Cornell University, supported by NASA and JPL. database (Lebouteiller et al., 2011). As post-processing, some outlying data points were discarded. We fitted polynomials to the data of individual IRS modules using a robust method and then searched for data points outlying by more than 4 from these fits. We found that there is a mismatch between the SL1 and LL2 modules in both spectra. Since the shortest wavelength parts of the spectra match perfectly with the predicted photospheric fluxes (see Sect. 3.1), the modules were stitched together by scaling the LL modules to the SL ones. The multiplicative scaling factors were estimated from the overlapping spectral regions of the SL1 and LL2 modules.
The spectra of HD 131835 do not show any prominent silicate features. Following Redfield et al. (2007) and Rigliaco et al. (2015), we also looked for atomic metal and hydrogen lines, and rotational lines of molecular hydrogen in the spectrum. However, none of the lines are detected. We compared the two IRS spectra of HD 131835 obtained at different epochs. The flux differences were typically in the order of 5% over the whole spectral range, i.e. the continuum level was unchanged. For the further analysis the two spectra were combined using a simple weighted average.
For the SED modelling process the combined IRS spectrum was split into 15 adjacent wavelength bins between 6 and 35 µm. The derived flux density values are listed in Table 3. Their uncertainties were computed by adding an 5% absolute calibration uncertainty quadratically to the measured ones.
2.3.3 FEROS observation
High-resolution optical spectroscopy of HD 131835 was performed using the Fiber-fed Extended Range Optical Spectrograph (FEROS, Kaufer et al., 1999) installed on the 2.2 m MPG/ESO telescope in La Silla, on 2011 April 17 using the “object-sky” configuration, with one fiber positioned at the target, and the other one on the sky. The integration time was 180 s. FEROS has a mean resolving power of R 48000 and covers the wavelength range between 3500 and 9200 Å in 39 echelle orders. Data reduction, including bias subtraction, flat-field correction, background subtraction, the definition and extraction of orders, and wavelength calibration, was performed using the FEROS Data Reduction System pipeline at the telescope.
3. Results
3.1. Stellar properties of HD 131835
HD 131835 is an A2-type star (Houk, 1982) located at 122.7 pc away (van Leeuwen, 2007). Based on astrometric data made with ESA’s Hipparcos satellite, de Zeeuw et al. (1999) proposed the star to be a member of the 16 Myr old (Pecaut et al., 2012) Upper Centaurus Lupus (UCL) subgroup of the Sco-Cen association with a membership probability of 95%. According to our current knowledge HD 131835 has no stellar companion (Kouwenhoven et al., 2005; Wahhaj et al., 2013).
We used spectroscopic and photometric data to model the stellar photosphere and to estimate the fundamental stellar properties of HD 131835. Moreover, supplementing the Hipparcos astrometric data by our ground-based radial velocity measurement, its membership in UCL was also reconsidered.
Analysis of the FEROS spectrum.
In order to estimate the radial velocity and different stellar parameters of our target the measured FEROS spectrum was compared with templates taken from the spectral library of Munari et al. (2005). In this spectral library the continuum normalization was performed by dividing the absolute flux spectrum by its calculated continuum. Because of the applied method, in some spectral regions the continuum of the model spectra can significantly differ from a continuum that would be obtained using a regular normalization scheme of observational spectroscopy. Therefore first we used high order polynomials to flatten the model spectra, and then the same method was applied in the continuum normalization of our observed spectrum as well. We used an iterative method to estimate the stellar parameters. We first applied the cross-correlation technique to derive the radial velocity of the star by convolving the measured spectrum with a template taken from the spectral library. We selected a template spectrum with , , and K (corresponding to the A2 spectral type of the target quoted by the SIMBAD). The cross correlation function was calculated by the fxcor task in IRAF. After transforming the measured spectrum to the laboratory system we compared it with a grid of Munari synthetic spectra, using the 4000–6200Å wavelength range, excluding the region and Na D lines. The grid was compiled by varying the effective temperature, surface gravity, and projected rotational velocity of the model spectra, while the metallicity was fixed to . By finding the global minimum we used the derived parameters to repeat the radial velocity determination and then recompute the stellar parameters. This process yielded the following best-fit parameters: K, , kms-1. Based on dwarf spectral type vs. effective temperature scale presented in Pecaut & Mamajek (2013) the derived rather corresponds to a spectral type of A4. The radial velocity was found to be 1.61.4 km s-1, consistently with our previous measurement of 3.31.7 km s-1 (Moór et al., 2006). Taking the weighted average of the two radial velocity values we obtained km s-1.
Analysis of photometric and near-IR data.
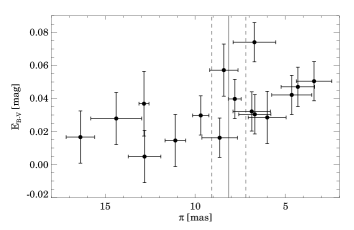
To provide an additional independent estimate for fundamental stellar properties and model the stellar photosphere we fitted an ATLAS9 atmosphere model (Castelli & Kurucz, 2003) to the optical and near-IR observations of the target. Photometric data were taken from the Tycho 2 (Høg et al., 2000), Hipparcos (Perryman, 1997), and Two Micron All Sky Survey catalogues (2MASS, Cutri et al., 2003). These data were further supplemented by Wide-field Infrared Survey Explorer (WISE) band photometry at 3.4µm from the WISE All-Sky Database (Wright et al., 2010) and Johnson B, V photometry from the catalogue of Slawson et al. (1992). With a distance of 123 pc, HD 131835 could be outside the Local Bubble, thus its reddening might not be negligible. In order to provide a rough estimate of the reddening at the distance of HD 131835, we collected those stars in its vicinity (with separations 3°) that have both Hipparcos-based trigonometric parallax and measured Strömgren colour indices and H index in the photometric catalogue of Hauck & Mermilliod (1998). For these stars we derived colour excesses (as ) from the Strömgren data by using the appropriate calibration processes (Crawford, 1975, 1979; Olsen, 1984). Figure 3 shows the derived values as a function of trigonometric parallaxes. At the distance of HD 131835 (marked by a vertical line) the reddening is between 0.015 and 0.075 mag. We note that consistent with our results, the extinction map of Schlafly & Finkbeiner (2011) shows a reddening of 0.083 mag in the direction of our target. This value gives the total reddening within the Milky Way for the line of sight, thus it can be considered as an upper limit. Therefore in the photosphere modelling we fitted both the effective temperature and the reddening, the latter was limited between 0.0 and 0.08 mag). By adopting solar metallicity and our minimization yielded = 8250 K and = 0.025. Considering these data and the -based trigonometric distance we derived a luminosity of = 9.22.6 L⊙ for HD 131835.
UCL membership.
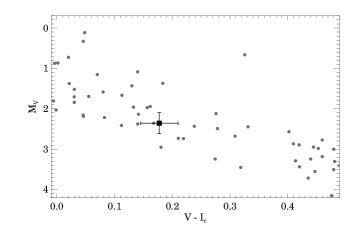
Using the new combined radial velocity and Hipparcos astrometric data of HD 131835 we computed a Galactic space motion of U = 5.81.3 kms-1, V = 18.42.1 kms-1, and W = 4.80.8 kms-1 with respect to the Sun. This space velocity is in perfect agreement with the charateristic space motion of UCL (U = 5.10.6 kms-1, V = 19.70.4 kms-1, W = 4.60.3 kms-1, Chen et al., 2011). The position of HD 131835 in the color-magnitude diagram (Fig. 4) matches well the locus defined by UCL members, indicating that its isochrone age is consistent with that of the cluster. Our results confirm the previously proposed membership of HD 131835 in UCL, therefore we adopted the age of the cluster, 16 Myr, for our star. With this age and our previous effective temperature and stellar luminosity estimates we derived a stellar mass of 1.770.08 M⊙ by using solar metallicity isochrones from Siess et al. (2000).
3.2. The dust disk around HD 131835
SED modelling.
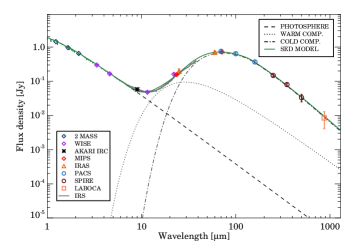
In order to construct the spectral energy distribution of HD 131835, the previously mentioned PACS, SPIRE, and IRS data were further supplemented by infrared and submillimeter photometry from the literature (Table 3). The compiled SED is plotted in Figure 5. HD 131835 exhibits strong excess at far-IR wavelengths, but as the IRS spectrum shows, the SED of the source already starts to departing from photospheric emission at 7µm, indicating the presence of warmer circumstellar dust as well. We used the ATLAS9 atmosphere model of HD 131835 (Sect. 3.1) to predict photospheric flux contribution at different mid- and far-IR wavelengths. The average accuracy of the predicted photospheric fluxes is around 5%.
The excess emission of debris disks is generally well fitted by a single (modified) blackbody or a combination of two different temperature blackbody components (Chen et al., 2014; Kennedy & Wyatt, 2014). This simple model can provide estimates of fundamental disk properties such as the characteristic dust temperature(s) and the fractional luminosity ( is the ratio of the luminosity of the dust emission to the bolometric luminosity of the host star).
We fitted the excess emission of HD 131835 by single- and two-temperature models. For the single-temperature fitting we used a modified blackbody:
| (1) |
where is the measured excess emission at , is the Planck function, is the dust temperature, is a scaling factor that is proportional to the solid angle of the emitting region, while if and if . In the two-temperature model we used a combination of a warmer simple blackbody (there is no sense to use a modified blackbody since the values of and cannot be constrained well from the SED) and a modified blackbody. We applied a Levenberg-Marquardt algorithm (Markwardt, 2009) to find the best-fitting model. An iterative way was used to compute and apply color corrections for the photometric data during the fitting process (see e.g. Moór et al., 2006). We found that only the two-temperature model (plotted in Figure 5) could reasonably fit both the mid- and far-IR/submm excess emission. This model provides dust temperatures of K and K for the warm and cold dust components, respectively. We obtained µm and for the cold belt. The warm component has a fractional luminosity of (8.21.9)10-4 , while the cold component has a fractional luminosity of (2.20.2)10-3.
We estimated the dust mass in the disk based on the submillimeter brightness using the standard formula:
where is the measured excess at 500 µm (we used this data point because the longest wavelength LABOCA measurement has very low signal-to-noise ratio), is the distance to the source, is the mass absorption coefficient, and is the Planck function. By adopting 2 cm2 g-1 at GHz (e.g. Nilsson et al., 2010), and taking and values from the previous SED modelling, we derived a dust mass of 0.470.18 M⊕ for the disk.
Spatial extent.
In order to evaluate whether the disk is spatially extended its profiles measured at 70, 100, and 160 µm were compared with appropriate PSFs of the PACS instrument. The PSF profiles were compiled using mini-scan map observations of four stars ( Boo, Tau, Cet, And) that do not exhibit infrared excesses and served as fiducial standards in the calibration of PACS photometry (Balog et al., 2014). For the data processing of these observations we used identical reduction steps as in the case of HD 131835, and finally the obtained PSFs were rotated to match the roll angle of the telescope at the time of observing our target. By fitting a two dimensional Gaussian function to the PSF profiles we derive averaged FWHMs of 570002559003 and 686004676003 at 70 and 100µm, respectively, while for the target we obtained 649020587019 and 774034719032, implying that the disk is slightly elongated and marginally extended along its major axis at these wavelengths. At the longest wavelength the target’s profile was consistent with that of the PSF measurements. In order to derive the characteristic size, inclination, and position angle of the disk, the 70 and 100 µm PACS images were fitted using a simple, non-physical disk model grid in the same way as described in Moór et al. (2015). In this model we assumed that the dust emitting at these wavelengths is located in a narrow outer ring around the central star. The model has three free parameters, the average radius (), the position angle () and the inclination () of the disk, while the width of the disk was fixed to 0.1 following Booth et al. (2013). We used a Bayesian analysis in the selection of the best fitting model. Our best solution has au, 8°, and ° at 70 µm and au, 12°, and 24° at 100 µm. The final disk parameters computed as a weighted average of those derived in the two bands are au, 7°, and °. It is worth noting that the measured profiles can also be fitted using a more extended disk model with a smaller inner radius and a larger outer radius. Such a model, would provide very similar and inclination parameters as above, and the average disk radius would also not change significantly.
The disk around HD 131835 has also been successfully resolved at 11.7 and 18.3 µm using the Gemini South telescope (Hung et al., 2015) deriving a of 61° and an inclination of 74°. These parameters are broadly consistent with our results. By modeling the SED and the mid-IR images simultaneously, Hung et al. (2015) proposed a combination of an extended continuous power-law disk between 35 and 310 au and two narrow rings at 1055 and 22040 au stellocentric distances as the best-fitting solution. The three disk components are made of three different grain populations. All of the emitting grains are proposed to be hotter than blackbodies. The radius of the outer narrow ring (22040 au), that is predominantly responsible for the disk emission at wavelengths 50µm, is broadly consistent with the characteristic disk radius derived from the marginally resolved PACS images.
3.3. The gas disk around HD 131835
3.3.1 Basic gas mass estimates
Observations of a single CO isotopologue (12CO in our case) cannot provide information on the optical depth of the radiation. Assuming that the measured CO emission of HD 131835 is optically thin, the mass of CO gas in the disk can be estimated as
| (2) |
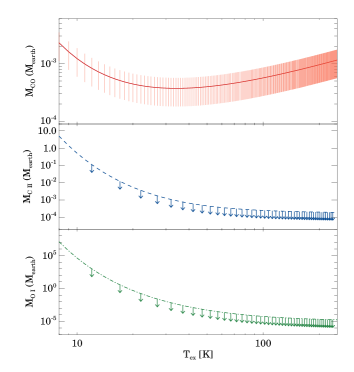
where is the mass of the CO molecule, is the distance of the object, is the Planck constant, and are the rest frequency and the Einstein coefficient for the given transition between the upper and lower levels, is the observed integrated line flux, while is the fractional population of the upper level. Apart from all of the parameters from the right side of the equation are known. In case of local thermodynamic equilibrium (LTE), the level populations are thermalised and governed by the Boltzmann equation, allowing the computation of if we know the gas temperature. In optically thin disks the gas kinetic temperature can significantly differ from the temperature of dust grains (see e.g. Kamp & van Zadelhoff, 2001) thus the dust emission does not constrain the gas temperature. Since in the 2–1 and 4–3 transitions we have upper limits for the CO emission (Fig. 1), from the line ratios we can provide only a poor constrains for the excitation temperature, yielding 8 K. Taking K, the value measured in Pic (Roberge et al., 2006) we derived a total CO gas mass of 4.42.210-4 M⊕ from our =3–2 line flux. In LTE and are equal. As Fig. 6 demonstrates the derived CO mass is not very sensitive to the excitation temperature. For a range between 8 and 250 K, varies between 3.710-4 and 2.310-3 M⊕. In principle using similar assumptions we can derive upper limits both for O I and C II masses, however for these constituents – especially for O I – the estimates have stronger dependency on the excitation temperature (see Fig. 6). Additionally, LTE excitation of O I 63µm line requires a dense medium, e.g. considering H2 molecules as collisional partners the critical density is typically 5105 cm-3 (Lequeux, 2005). In a lower density environment this line becomes subthermal with excitation temperatures far below what would be expected from LTE. Since these issues would make the mass estimate of O I unreliable we focused on C II, where the critical densities are lower (e.g. 3103 cm-3, assuming hydrogen molecules as collisional partners, Lequeux, 2005). For 8 K, we obtained M⊕ as an upper mass limit for C II.
3.3.2 Simple gas disk model
It is important to note, however, that our basic assumptions concerning the optically thin gas emission and the LTE could be questioned. For instance, in the disk around HD 21997 not only the 12CO but even the 13CO lines turned out to be optically thick (Kóspál et al., 2013), while in debris disks with low amount of gas, radiative excitation can dominate over collisional processes leading to subthermal non-LTE level populations (Matrà et al., 2015). To partly consider these caveats and to further constrain the gas disk fundamental properties the measured line profile was modeled with a simple disk geometry using the LIME radiation transfer code (Brinch & Hogerheijde, 2010).
We adopted a prescription for the structure of the disk which is frequently used to model passively irradiated protoplanetary disks. The radial surface density distribution was taken to be a powerlaw. We assumed that the disk is vertically isothermal and in hydrostatic equilibrium, resulting in a Gaussian vertical density distribution, with radially dependent pressure scale height. Assuming Keplerian rotation around a 1.77 M⊙ star and a radial temperature profile of r-0.5, the ratio of the pressure scale height to the radius has a profile of r-0.25. Using these approximations the disk can be described as:
| (3) |
| (4) |
| (5) |
where is the outer disk radius, is the gas surface density at the outer disk radius in the midplane and is the scale height. Further parameters are the inner radius (), the inclination () of the disk, and the gas temperature . In the modelling we always assumed that the gas disk is coplanar with the dust disk and therefore its inclination was fixed to 74° (Sect. 3.2). The origin of gas in this system is not clarified yet, it could either be primordial, or secondary. In the modelling therefore we used two different scenarios corresponding to these alternative hypotheses.
3.3.3 Primordial gas disk model
In our first model we assumed a primordial gas disk where the CO gas is accompanied with so much molecular hydrogen that the whole disk is in LTE, i.e. the density of H2 exceeds the critical density everywhere and the rotational excitation is dominated by collisions. Concerning the radial distribution first we examined whether a very narrow gas ring co-located with the inner or the outer narrow dust rings proposed by Hung et al. (2015) can reproduce the observed CO (3–2) spectrum. We found that none of these solutions are feasible because the obtained model spectra are significantly narrower than the measured one. Then we introduced a more extended gas disk model whose inner radius was fixed to 35 au (corresponding to the inner radius of the proposed continuous dust disk component in the model of Hung et al., 2015) while the outer radius was varied between 80 and 310 au. The radial distribution of gas temperature was described as the temperature at the disk’s inner edge, , was also a free parameter and varied between 10 and 100 K. We found that only models with between 80 and 150 au provide spectral profiles consistent with the measured 3–2 line spectrum. The CO (3–2) line emission turned out to be at least partly optically thick in all models. The gas temperature cannot be strongly constrained, only could be excluded, since with this low temperature the obtained model spectra always found to be too faint. The lowest CO mass, 10-4 M⊕ was obtained with au, cm-2 and K. CO spectra in the relevant transitions belong to this model were plotted in Figure 1. By adopting a canonical CO/H2 abundance ratio of 10-4 and using this minimum mass model we could check our original assumption on LTE a posteriori. We found that an overwhelming part (more than 95%) of CO gas is located in disk regions where the density of H2 exceeds the critical density of CO J=3–2 transition. Actually, by relaxing our assumption of LTE and repeating the LIME computations with the canonical CO/H2 abundance ratio for this disk model we obtained CO spectra consistent with the ones derived in the LTE assumption. These results support that LTE is a reasonable assumption in our models.
3.3.4 Secondary gas disk model
As an alternative scenario, we also examined a disk whose gas material is produced from icy grains and planetesimals. In this case, the gas would mainly contain and CO, similarly to comets in our solar system (Mumma & Charnley, 2011). Since the low dust content of the disk does not provide effective shielding against stellar and interstellar UV photons, the released molecules are quickly photodissociated. Photodissociation of water molecules most commonly produce OH radicals and H atoms, from which the former are then photodissociated into H and O atoms. By comparing the number of dissociating photons from the stellar photosphere model (Sect. 3.1) and from the interstellar radiation field (Draine, 1978), we concluded that the radiation field at the relevant wavelengths of 1900Å is dominated by stellar UV photons everywhere in the disk. Using photodissociation cross sections from Lee (1984) we found that water molecules are very rapidly photodissociated, their lifetime is lower than 3.4 days even at the outer edge of the disk (120 au). Photodissociation of CO molecules requires more energetic UV photons (1118Å, Visser et al., 2009). Within 45 au, stellar radiation is the dominant source of these photons, out of this region the contribution of the interstellar radiation field is more important. 12CO molecules can survive longer, their lifetime is estimated to be 40 yr in the disk (see Sect. 4.3). The photodissociation of CO results in O and C atoms. A fraction of carbon atoms then could be ionized by the stellar or interstellar UV photons, yielding carbon ions and electrons.
Following the above mentioned considerations, we constructed a disk model containing well mixed CO and C II gas. From the potential collisional partners we only took into account the electrons. Collisional rate coefficients for CO– were derived based on Dickinson & Richards (1975), while C II- coefficients were taken from Wilson & Bell (2002). No coefficients are available for CO–O, C II–O or CO–C I, C II–C I collisions. Based on coefficients for hydrogen atoms from Yang et al. (2013) and Barinovs et al. (2005), we found that for 200 the collisions with electrons dominate the excitation of both CO and C II. We adopted the same CO gas density distribution as in the primordial model, , and were fixed to 35 au, 120 au, and 74°. and the abundance ratio of C II ions to CO molecules () were free parameters. Since H and O are not ionized in regions not subject to extreme UV photons, and thereby carbon can be considered as the dominant source of free electrons, we adopted everywhere throughout the disk (see also Zuckerman & Song, 2012; Matrà et al., 2015).
The stellar parameters and the radial extent of the disk in the HD 131835 system resemble those of Pic (see Sect. 4.1). Therefore in our modelling we used the parameters of the Pic system as a benchmark. Based on recent observations with Herschel and ALMA, the disk around Pic contains 5.510-3 M⊕ of C II, 7.110-3 M⊕ of C I (Cataldi et al., 2014) and 2.8510-5 M⊕ of CO gas (Dent et al., 2014). This corresponds to a C II to CO abundance ratio of 450, and even if we take into account the uncertainites of the mass estimates, the ratio is above 150. Therefore we varied between 1 and 450 in our models. We performed non-LTE radiative transfer modelling. In the course of modelling first we determined the CO density that reproduces the observed CO (3–2) line for a certain gas temperature and C II to CO abundance ratio, and then we computed the C II model flux. The resulting electron densities in the disk always exceeded the critical electron density for C II, leading to LTE level populations. For abundance ratios of , only models with K were found to be consistent with the measured upper limit of C II. Because of the low gas temperatures, these models would require the presence of at least 510-3 M⊕ ( cm-2) of CO gas for the reproduction of the observed CO (3–2) line. Taking into account the C II ions and C I atoms, the total gas mass in these models is higher than 0.7 M⊕. The energy of the upper level for the C II line is K, thus, for a given amount of C II gas, the line emission becomes brighter in higher temperature models. We found that in models with inner gas temperatures higher than 30 K, the C II to CO abundance ratio must be for producing a C II line fainter than our upper limit. CO gas is excited subthermally in most of the disk in these cases, therefore the reproduction of the observed CO (3–2) line requires at least a CO mass of 110-3 M⊕ ( cm-2). In these models the total gas mass of CO, C I, and C II together is at the same level, or only slightly larger, than in the disk of Pic.
3.3.5 Search for accretional signatures
We investigated whether HD 131835 shows any signatures of active accretion. A possible excess in the Balmer discontinuity can be used to estimate the rate of accretion in disks around Herbig Ae stars (Muzerolle et al., 2004; Mendigutía et al., 2011). The excess parameter was calculated as where – the intrinsic color – was derived from the Kurucz photospheric model of the source using synthetic photometry, while for computation of , the dereddened measured color index, we used U, B photometry from the catalogue of Slawson et al. (1992). We obtained a mag, in the computation of uncertainty we took into account both the measurement errors and the uncertainties in the Kurucz photospheric model (the uncertainties in the stellar parameters). This calculation clearly shows that there is no excess in the Balmer discontinuity. By calculating a 3- upper limit of 0.1 for and following the outline described in Mendigutía et al. (2011) we derived an upper limit of 210-8 M⊙yr-1 for the accretion rate. By inspecting the high-resolution optical spectra we found that the possible accretional indicator lines of Hα, Hβ, Hγ, and He I 5876Å are in absorption and are consistent with our fitted spectral model. For the Hα line luminosity we derived an upper limit of 210-4 L⊙. Based on the calibration obtained for HAeBe stars by Mendigutía et al. (2011) this upper limit corresponds to an accretion luminosity of . Considering that , from the absence of Hα line excess we obtained an upper limit of M⊙ yr-1 for the mass accretion.
3.4. Gas mass upper limits for the other targets
For the non-detected sources CO mass upper limits were estimated assuming optically thin emission and local thermodynamic equilibrium (LTE). The excitation temperature was assumed to be 20 K, the line flux upper limits were taken from Table 1. In those cases where both CO (3–2) and (4–3) line observations were available we used the lower transition in the calculations. We note again that our basic assumptions might not be fulfilled for all of the studied systems. With the achieved sensitivity we cannot exclude that some of our targets harbor optically thick gas disks. In very tenuous gas disks the excitation could be subthermal even leading to a very low excitation temperature of 10 K (e.g. Matrà et al., 2015). In both of these cases our upper limits would underestimate the possible total CO mass in the disk.
4. Discussion
4.1. Gaseous debris disks around young A-type stars
With the discovery of CO gas in HD 131835 the number of known gaseous debris disks around A-type stars is increased to seven. Tables 4 and 5 present the main stellar and disk properties. All of these systems are likely younger than 50 Myr999Rodigas et al. (2014) estimated that the age of HD 32297 falls between 15 and 500 Myr, but, as they and Donaldson et al. (2013) noted, the kinematic properties of the star and the fractional luminosity of the disk imply an age close to the lower limit of this interval., thus they represent the very early phase of debris disk evolution. HD 131835 may be one of the youngest objects in this sample and based on their nearly identical stellar properties, it can be considered as a comparably young sibling of Pic.
Figure 7 shows the integrated CO(3–2) fluxes and upper limits for these seven sources, normalized to 100 pc, and plotted against fractional luminosities. Partly based on our two surveys, additional debris disks around main-sequence stars located within 125 pc, as well as HD 141569, a nearby transitional disk that may represent a very final phase of protoplanetary disk evolution (Wyatt et al., 2015), are also displayed. Although there is no clear trend with the fractional luminosity, apart from Tel all known gaseous debris disks have a fractional luminosity 510-4. Based on debris disk catalogues of Moór et al. (2006), Rhee et al. (2007), and Chen et al. (2014) we identified eleven A-type stars within 125 pc that harbor disks with / above 510-4. All of these systems are younger than 50 Myr and nearly all of them have already been observed in CO rotational transitions in different surveys (the two exceptions are HD 98363 and HD 143675). Among the observed nine disks, four harbor CO gas (49 Ceti, HD 21997, Pic and HD 131835), while in the case of HD 32297 and HD 172555 atomic gas tracers were detected. The gas component of HD 95086, HR 4796, and HD 110058 have remained undetected so far. It suggests that the most massive debris disks around young A-type stars quite commonly possess detectable amount of gas. It is important to note that among these disks only HD 21997 and Pic were observed with ALMA and the sensitivity of most of the other observations did not allow the detection of even a Pic-like gas disk. From the four CO bearing debris disks HD 131835 is the brightest, its normalized line flux is 17 times higher than that of the disk around Pic, but falls below the normalized line flux of HD 141569.
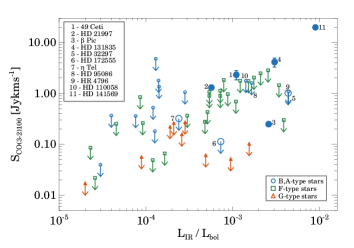
Within 125 pc there are many F-type stars with age of 50 Myr that possess debris disks with a fractional luminosity of 510-4 (Fig. 7), i.e. having similar properties than that of the abovementioned A-type sample. We observed 15 such systems in the framework of our two surveys but none of them were detected, thus based on the current data sets the presence of CO molecules may be the characteristic of debris disks around young A-type stars. Rigliaco et al. (2015) detected H I lines in mid-infrared spectrum of eight young debris disks around F-K type stars. The presence of these lines can be explained either by low rate gas accretion onto these stars or chromospheric activity. In the case of former scenario these findings would indicate that some disks around F-K type stars can also retain primordial gas for their debris phase.
4.2. Dust properties of the HD 131835 disk
Based on its infrared and submillimeter continuum data the dust disk properties of HD 131835 are similar to those of the other young debris disks. Although the disk has a high total fractional luminosity of 310-3 this value is still less than the usually invoked threshold value of 0.01, that divides protoplanetary and debris disks. Recently, Wyatt et al. (2015) introduced a new classification scheme to differentiate between Herbig Ae disks and debris disks with A-type host stars. This method is based on the ratios of the observed to the stellar photospheric fluxes at 12 and 70µm ( and ). For debris disks and have to be lower than 3 and 2000, respectively. Based on color-corrected WISE 12 and PACS 70µm data and predicted photospheric fluxes we derived and for HD 131835, i.e. it can be classified as a debris disk. The majority of Herbig Ae systems show PAH emission. The absence of PAH features in the IRS spectrum of HD 131835 is also in accordance with its classification as a debris disk. These arguments suggest that the observed excess emission is due to dust grains that are probably second generation, produced via erosion of larger unseen bodies.
4.3. The gas disk of HD 131835
According to the current paradigm the gas content of debris disks may also be second generation, derived from previously formed planetesimals. However, in young disks we cannot exclude the possibility that the evolution of dust and gas were not parallel and the observed gas is predominantly composed of residual primordial material (of course we never exclude that a part of the gas is produced from already emerged icy bodies). Indeed, though most known gaseous debris disks are proposed to be rather secondary, one of the oldest among them, HD 21997 may likely harbor a hybrid disk with a significant amount of primordial gas (Kóspál et al., 2013). In the following, we investigate the origin of gas in the HD 131835 system. In this analysis we considered the Pic and HD 21997 systems as references: the former may be the best established representantive of young debris disks with secondary gas (Fernández et al., 2006; Dent et al., 2014), while the latter is the sole known example for a hybrid disk. Furthermore, both systems have already been observed with ALMA (Dent et al., 2014; Kóspál et al., 2013) providing very detailed information on the spatial distribution of CO gas and dust, and their host stars – particularly Pic – is quite similar to HD 131835.
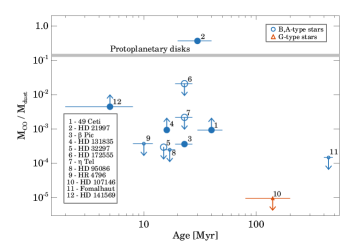
In the absence of significant H2 and dust content in a debris disk with secondary gas, only self-shielding can protect CO molecules againt the UV photons of stellar and interstellar radiation field. To judge the efficiency of self-shielding we took our secondary gas disk model with a CO mass of 1.010-3 M⊕ (i.e. the model with the minimum CO mass) and computed the shielding factors using the photodissociation model of Visser et al. (2009). The stellar UV flux found to be dominant at 45 au, were determined from the fitted ATLAS model (Sect. 3.1). The contribution of interstellar radiation field were computed from Draine (1978). Our calculations yielded a CO lifetime of 40 yr at the directly illuminated inner edge of the disk and of 500 yr in the most efficiently self-shielded mid-plane regions. Assuming that the gas is continuously replenished and taking the CO mass of 1.010-3 M⊕ we obtained a CO production rate of 210-6 M⊕yr-1 or 1.21019 kg yr-1. This is at least eight times higher than the gas production rate obtained for the Pic disk from its ALMA observation (Dent et al., 2014). Assuming a CO mass abundance of 10% in planetesimals, it would require destruction at least of 210-5 M⊕yr-1 of icy bodies. The CO gas can be released from icy grains/planetesimals in different processes. The temperature significantly exceeds the value needed for the sublimation of pure CO ice (20 K) everywhere in the disk. In such environment CO ice is thought to be mainly present in deeper layers of icy planetesimals and as admixture in the amorphous water ice on the surface of grains and larger bodies. Thus photodesorption or, in warmer regions ( 110 K), sublimation of surface water ices can produce CO gas as well. CO entrapped in water ice matrix can also be released via collisions between grains and planetesimals, moreover fragmentation of larger bodies can lead to the excavation of CO ices persisted in deeper layers. Figure 8 shows the ratio of CO mass to the dust mass as a function of age for debris disks with known gaseous component and for some selected disks (additional debris disks around A-type stars with ; Fomalhaut and HD 107146, two debris systems recently observed by ALMA; and HD 141569). Based on ALMA observations of Dent et al. (2014) the ratio measured for Pic disk is 3.6 (note that they used an assumption of LTE, and if it is not fulfilled the CO mass could be higher, see also in Matrà et al., 2015). The spatially resolved images also revealed a clump at 85 au from the star, in which an enhanced CO-to-dust mass ratio was measured. Sensitive ALMA observations are available only for a few debris disks. Upper limits for at Fomalhaut (Matrà et al., 2015) and at HD 107146 (Ricci et al., 2015), however, hint that the ratio measured at Pic is already quite high. Interestingly the other three debris disks with CO gas show even higher ratios. For HD 21997 we measured a 1000 times higher ratio (note that here we used the optically thin 12C18O line to estimate the CO mass) than for the Pic. This object clearly differs from the others and likely harbors a significant fraction of primordial gas. The lower limits of CO-to-dust mass ratios for HD 131835 (in calculation of its we used the minimum CO mass of 5.210-4 M⊕ that we obtained in our models) and 49 Ceti are 2.5 higher than that of Pic. In a secondary disk the ratio depends both on the dust and gas production rates and on the removal time of the two elements. The observed higher CO-to-dust mass ratios thus can be explained e.g. by a more effective self-shielding due to larger CO density which would result in higher CO lifetime or by higher fraction of volatile material in icy planetesimals/grains.
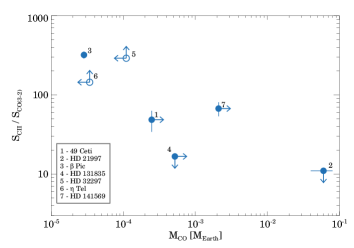
Stellar and interstellar UV photons can permeate debris disks without any hindrance and ionize carbon atoms formed via photodissociation of CO molecules. The fraction of neutral and ionized carbon depends on the strength of the local radiation field. Due to their longer lifetime in such environment, the amount of C I and C II can significantly exceed that of CO molecules, e.g. in the disk of Pic there is approximately 200 times more C II gas than CO gas in terms of mass (Cataldi et al., 2014; Dent et al., 2014). Figure 9 displays the / line flux ratios for debris disks where C II and/or CO gas has been detected. The ratio of Pic is about 30 times higher than the upper limit we obtained for HD 131835. This may reflect a real difference in the mass ratio, or – as our modelling showed (Sect. 3.3) – may be a consequence of the low gas temperature in HD 131835. In the latter models the total gas mass and the gas-to-dust mass ratio would be rather high.
In the secondary gas scenario, gas and dust are released at the same location from planetesimals, thus the two components are expected to be co-located, just as we see at Pic. Based on our current data and modelling (Sect. 3.3) we cannot determine the accurate location of gas, we just can say that the results do no exclude that the two components are co-located. It is worth noting, however that our gas disk model coincides with that part of the dust disk model of Hung et al. (2015), which is composed by very hot grains. These grains give only a low fraction of the dust disk mass and it is questionable whether they are accompanied with large amount planetesimals that could be the source of observed CO gas.
All in all, in the secondary scenario, HD 131835 could be considered as of comparable age and – in terms of its disk – more massive analogue of the Pic system. However, none of our current data exclude that HD 131835 in fact possess a hybrid disk. Our modelling in Sect. 3.3 shows that the CO (3–2) emission may be optically thick, thus we cannot exclude that the CO mass is significantly higher reaching even the same level as in the case of HD 21997. The low / flux ratio can be explained in the secondary scenario, but as Figure 9 shows, among the currently known gaseous debris disks only HD 21997, the sole hybrid disk, exhibits similarly low ratio.
For a better clarification of the origin of gas additional observations are necessary. By measuring the emission of less abundant 13CO and C18O isotopologues from the disk a more reliable CO gas mass estimate could be obtained. Moreover, by mapping and comparing the spatial distribution of gas and dust allow us to investigate whether the two components are co-located, which is a pre-requisite in a secondary gas scenario. These observations requires better sensitivity and spatial resolution than that of a single dish radio telescope but could definitely be carried out using the Atacama Large Millimeter/submillimeter Array.
5. Summary
By searching for CO gas in 20 debris disks using the APEX and IRAM 30m radiotelescopes we identified a new gas rich system around the 16 Myr old UCL member, HD 131835, where the 3–2 transition of CO was successfully detected. Based on spectroscopic and photometric data the stellar properties of HD 131835 resembles well those of Pic. By observing HD 131835 with the Herschel Space Observatory we found that the disk is spatially resolved both at 70 and 100µm and the disk characteristic radius is 170 au. Thanks to our observations at 250, 350, and 500µm the submillimeter SED of the source is now significantly better characterized. Based on its infrared and submillimeter continuum data the dust disk properties of HD 131835 are similar to those of the most massive young debris disks. With the detection of gas in HD 131835 the number of of known debris disks with CO component is increased to four (49 Ceti, HD 21997, Pic and HD 131835). All of these disks encircle young (40 Myr) A-type stars. Within 125 pc we know 11 A-type stars whose debris disks’ fractional luminosity exceed 10-4. Among these disks, 9 have already observed in CO rotational transitions. Four of them harbor CO gas, while in two other objects atomic gas tracers were detected. This detection rate of 4/9 (or 6/9 if atomic gas detection was also taken into account) suggests that the most massive debris disks around young A-type stars commonly possess detectable amount of gas. Based on our current data we cannot draw a secure conclusion on the origin of gas in HD 131835. If the gas is secondary then HD 131835 could be considered as a comparably young and – in terms of its disk – more massive analogue of the Pic system. However, we cannot exclude that this system – similarly to HD 21997 – possess a hybrid disk, where the gas material is predominantly primordial, while the dust grains are mostly derived from planetesimals.
References
- Alexander et al. (2014) Alexander, R., Pascucci, I., Andrews, S., Armitage, P., & Cieza, L. 2014, Protostars and Planets VI, 475
- Backman & Paresce (1993) Backman, D. E., & Paresce, F. 1993, in Protostars and Planets III, ed. E. H. Levy & J. I. Lunine, 1253–1304
- Ballering et al. (2013) Ballering, N. P., Rieke, G. H., Su, K. Y. L., & Montiel, E. 2013, ApJ, 775, 55
- Balog et al. (2014) Balog, Z., Müller, T., Nielbock, M., et al. 2014, Experimental Astronomy, 37, 129
- Barinovs et al. (2005) Barinovs, Ğ., van Hemert, M. C., Krems, R., & Dalgarno, A. 2005, ApJ, 620, 537
- Bendo et al. (2013) Bendo, G. J., Griffin, M. J., Bock, J. J., et al. 2013, MNRAS, 433, 3062
- Beust et al. (1994) Beust, H., Vidal-Madjar, A., Ferlet, R., & Lagrange-Henri, A. M. 1994, Ap&SS, 212, 147
- Booth et al. (2013) Booth, M., Kennedy, G., Sibthorpe, B., et al. 2013, MNRAS, 428, 1263
- Brinch & Hogerheijde (2010) Brinch, C., & Hogerheijde, M. R. 2010, A&A, 523, A25
- Carter et al. (2012) Carter, M., Lazareff, B., Maier, D., et al. 2012, A&A, 538, A89
- Castelli & Kurucz (2003) Castelli, F., & Kurucz, R. L. 2003, in IAU Symposium, Vol. 210, Modelling of Stellar Atmospheres, ed. N. Piskunov, W. W. Weiss, & D. F. Gray, 20P
- Cataldi et al. (2014) Cataldi, G., Brandeker, A., Olofsson, G., et al. 2014, A&A, 563, A66
- Chen et al. (2011) Chen, C. H., Mamajek, E. E., Bitner, M. A., et al. 2011, ApJ, 738, 122
- Chen et al. (2014) Chen, C. H., Mittal, T., Kuchner, M., et al. 2014, ApJS, 211, 25
- Chen et al. (2012) Chen, C. H., Pecaut, M., Mamajek, E. E., Su, K. Y. L., & Bitner, M. 2012, ApJ, 756, 133
- Chen et al. (2005) Chen, C. H., Patten, B. M., Werner, M. W., et al. 2005, ApJ, 634, 1372
- Crawford (1975) Crawford, D. L. 1975, AJ, 80, 955
- Crawford (1979) Crawford, D. L. 1979, AJ, 84, 1858
- Crifo et al. (1997) Crifo, F., Vidal-Madjar, A., Lallement, R., Ferlet, R., & Gerbaldi, M. 1997, A&A, 320, L29
- Cutri et al. (2003) Cutri, R. M., Skrutskie, M. F., van Dyk, S., et al. 2003, VizieR Online Data Catalog, 2246, 0
- Czechowski & Mann (2007) Czechowski, A., & Mann, I. 2007, ApJ, 660, 1541
- de Zeeuw et al. (1999) de Zeeuw, P. T., Hoogerwerf, R., de Bruijne, J. H. J., Brown, A. G. A., & Blaauw, A. 1999, AJ, 117, 354
- Dent et al. (2005) Dent, W. R. F., Greaves, J. S., & Coulson, I. M. 2005, MNRAS, 359, 663
- Dent et al. (2013) Dent, W. R. F., Thi, W. F., Kamp, I., et al. 2013, PASP, 125, 477
- Dent et al. (2014) Dent, W. R. F., Wyatt, M. C., Roberge, A., et al. 2014, Science, 343, 1490
- Dickinson & Richards (1975) Dickinson, A. S., & Richards, D. 1975, Journal of Physics B Atomic Molecular Physics, 8, 2846
- Donaldson et al. (2013) Donaldson, J. K., Lebreton, J., Roberge, A., Augereau, J.-C., & Krivov, A. V. 2013, ApJ, 772, 17
- Draine (1978) Draine, B. T. 1978, ApJS, 36, 595
- Fajardo-Acosta et al. (1998) Fajardo-Acosta, S. B., Stencel, R. E., & Backman, D. E. 1998, ApJ, 503, L193
- Ferlet et al. (1987) Ferlet, R., Vidal-Madjar, A., & Hobbs, L. M. 1987, A&A, 185, 267
- Fernández et al. (2006) Fernández, R., Brandeker, A., & Wu, Y. 2006, ApJ, 643, 509
- France et al. (2007) France, K., Roberge, A., Lupu, R. E., Redfield, S., & Feldman, P. D. 2007, ApJ, 668, 1174
- Gagné et al. (2014) Gagné, J., Faherty, J. K., Cruz, K., et al. 2014, ApJ, 785, L14
- Greaves et al. (2000) Greaves, J. S., Coulson, I. M., & Holland, W. S. 2000, MNRAS, 312, L1
- Griffin et al. (2010) Griffin, M. J., Abergel, A., Abreu, A., et al. 2010, A&A, 518, L3
- Grigorieva et al. (2007) Grigorieva, A., Thébault, P., Artymowicz, P., & Brandeker, A. 2007, A&A, 475, 755
- Güsten et al. (2006) Güsten, R., Nyman, L. Å., Schilke, P., et al. 2006, A&A, 454, L13
- Hales et al. (2014) Hales, A. S., De Gregorio-Monsalvo, I., Montesinos, B., et al. 2014, AJ, 148, 47
- Hauck & Mermilliod (1998) Hauck, B., & Mermilliod, M. 1998, A&AS, 129, 431
- Hobbs et al. (1985) Hobbs, L. M., Vidal-Madjar, A., Ferlet, R., Albert, C. E., & Gry, C. 1985, ApJ, 293, L29
- Høg et al. (2000) Høg, E., Fabricius, C., Makarov, V. V., et al. 2000, A&A, 357, 367
- Houck et al. (2004) Houck, J. R., Roellig, T. L., van Cleve, J., et al. 2004, ApJS, 154, 18
- Houk (1982) Houk, N. 1982, Michigan Catalogue of Two-dimensional Spectral Types for the HD stars. Volume_3. Declinations -400 to -260.
- Hung et al. (2015) Hung, L.-W., Fitzgerald, M. P., Chen, C. H., et al. 2015, ApJ, 802, 138
- Ishihara et al. (2010) Ishihara, D., Onaka, T., Kataza, H., et al. 2010, A&A, 514, A1
- Johnson et al. (2012) Johnson, B. C., Lisse, C. M., Chen, C. H., et al. 2012, ApJ, 761, 45
- Kamp & van Zadelhoff (2001) Kamp, I., & van Zadelhoff, G.-J. 2001, A&A, 373, 641
- Kastner et al. (2010) Kastner, J. H., Hily-Blant, P., Sacco, G. G., Forveille, T., & Zuckerman, B. 2010, ApJ, 723, L248
- Kaufer et al. (1999) Kaufer, A., Stahl, O., Tubbesing, S., et al. 1999, The Messenger, 95, 8
- Kennedy & Wyatt (2014) Kennedy, G. M., & Wyatt, M. C. 2014, MNRAS, 444, 3164
- Kiefer et al. (2014) Kiefer, F., Lecavelier des Etangs, A., Augereau, J.-C., et al. 2014, A&A, 561, L10
- Klein et al. (2012) Klein, B., Hochgürtel, S., Krämer, I., et al. 2012, A&A, 542, L3
- Klein et al. (2014) Klein, T., Ciechanowicz, M., Leinz, C., et al. 2014, IEEE Transactions on Terahertz Science and Technology, 4, 588
- Kóspál et al. (2013) Kóspál, Á., Moór, A., Juhász, A., et al. 2013, ApJ, 776, 77
- Kouwenhoven et al. (2005) Kouwenhoven, M. B. N., Brown, A. G. A., Zinnecker, H., Kaper, L., & Portegies Zwart, S. F. 2005, A&A, 430, 137
- Krivov (2010) Krivov, A. V. 2010, Research in Astronomy and Astrophysics, 10, 383
- Lebouteiller et al. (2011) Lebouteiller, V., Barry, D. J., Spoon, H. W. W., et al. 2011, ApJS, 196, 8
- Lee (1984) Lee, L. C. 1984, ApJ, 282, 172
- Lequeux (2005) Lequeux, J. 2005, The interstellar medium, Translation from the French language edition of: Le Milieu Interstellaire by James Lequeux, EDP Sciences, 2003 Edited by J. Lequeux. Astronomy and astrophysics library, Berlin: Springer, 2005
- Mamajek & Bell (2014) Mamajek, E. E., & Bell, C. P. M. 2014, MNRAS, 445, 2169
- Markwardt (2009) Markwardt, C. B. 2009, in Astronomical Society of the Pacific Conference Series, Vol. 411, Astronomical Data Analysis Software and Systems XVIII, ed. D. A. Bohlender, D. Durand, & P. Dowler, 251
- Matrà et al. (2015) Matrà, L., Panić, O., Wyatt, M. C., & Dent, W. R. F. 2015, MNRAS, 447, 3936
- Matthews et al. (2014) Matthews, B. C., Krivov, A. V., Wyatt, M. C., Bryden, G., & Eiroa, C. 2014, Protostars and Planets VI, 521
- Meeus et al. (2012) Meeus, G., Montesinos, B., Mendigutía, I., et al. 2012, A&A, 544, A78
- Melis et al. (2013) Melis, C., Zuckerman, B., Rhee, J. H., et al. 2013, ApJ, 778, 12
- Mendigutía et al. (2011) Mendigutía, I., Calvet, N., Montesinos, B., et al. 2011, A&A, 535, A99
- Montgomery & Welsh (2012) Montgomery, S. L., & Welsh, B. Y. 2012, PASP, 124, 1042
- Moór et al. (2006) Moór, A., Ábrahám, P., Derekas, A., et al. 2006, ApJ, 644, 525
- Moór et al. (2011a) Moór, A., Ábrahám, P., Juhász, A., et al. 2011a, ApJ, 740, L7
- Moór et al. (2011b) Moór, A., Pascucci, I., Kóspál, Á., et al. 2011b, ApJS, 193, 4
- Moór et al. (2013) Moór, A., Ábrahám, P., Kóspál, Á., et al. 2013, ApJ, 775, L51
- Moór et al. (2015) Moór, A., Kóspál, Á., Ábrahám, P., et al. 2015, MNRAS, 447, 577
- Morales et al. (2013) Morales, F. Y., Bryden, G., Werner, M. W., & Stapelfeldt, K. R. 2013, ApJ, 776, 111
- Moshir (1990) Moshir, M. et al. 1990, in IRAS Faint Source Catalogue, version 2.0 (1990), 0
- Mumma & Charnley (2011) Mumma, M. J., & Charnley, S. B. 2011, ARA&A, 49, 471
- Munari et al. (2005) Munari, U., Sordo, R., Castelli, F., & Zwitter, T. 2005, A&A, 442, 1127
- Muzerolle et al. (2004) Muzerolle, J., D’Alessio, P., Calvet, N., & Hartmann, L. 2004, ApJ, 617, 406
- Najita & Williams (2005) Najita, J., & Williams, J. P. 2005, ApJ, 635, 625
- Nielsen et al. (2013) Nielsen, E. L., Liu, M. C., Wahhaj, Z., et al. 2013, ApJ, 776, 4
- Nilsson et al. (2010) Nilsson, R., Liseau, R., Brandeker, A., et al. 2010, A&A, 518, A40
- Olsen (1984) Olsen, E. H. 1984, A&AS, 57, 443
- Ott (2010) Ott, S. 2010, in Astronomical Society of the Pacific Conference Series, Vol. 434, Astronomical Data Analysis Software and Systems XIX, ed. Y. Mizumoto, K.-I. Morita, & M. Ohishi, 139
- Pascucci et al. (2006) Pascucci, I., Gorti, U., Hollenbach, D., et al. 2006, ApJ, 651, 1177
- Patel et al. (2014) Patel, R. I., Metchev, S. A., & Heinze, A. 2014, ApJS, 212, 10
- Pawellek et al. (2014) Pawellek, N., Krivov, A. V., Marshall, J. P., et al. 2014, ApJ, 792, 65
- Pecaut et al. (2012) Pecaut, M. J., Mamajek, E. E., & Bubar, E. J. 2012, ApJ, 746, 154
- Pecaut & Mamajek (2013) Pecaut, M. J., & Mamajek, E. E. 2013, ApJS, 208, 9
- Perryman (1997) Perryman, M. A. C. 1997, in ESA Special Publication, Vol. 402, Hipparcos - Venice ’97, ed. R. M. Bonnet, E. Høg, P. L. Bernacca, L. Emiliani, A. Blaauw, C. Turon, J. Kovalevsky, L. Lindegren, H. Hassan, M. Bouffard, B. Strim, D. Heger, M. A. C. Perryman, & L. Woltjer, 1–4
- Pilbratt et al. (2010) Pilbratt, G. L., Riedinger, J. R., Passvogel, T., et al. 2010, A&A, 518, L1
- Poglitsch et al. (2010) Poglitsch, A., Waelkens, C., Geis, N., et al. 2010, A&A, 518, L2
- Redfield (2007) Redfield, S. 2007, ApJ, 656, L97
- Redfield et al. (2007) Redfield, S., Kessler-Silacci, J. E., & Cieza, L. A. 2007, ApJ, 661, 944
- Regibo (2012) Regibo, S. 2012, PhD Thesis, Data Reduction and Analysis Algorithms for the Herschel Space Observatory, KUL Leuven
- Rhee et al. (2007) Rhee, J. H., Song, I., Zuckerman, B., & McElwain, M. 2007, ApJ, 660, 1556
- Ricci et al. (2015) Ricci, L., Carpenter, J. M., Fu, B., et al. 2015, ApJ, 798, 124
- Rigliaco et al. (2015) Rigliaco, E., Pascucci, I., Duchene, G., et al. 2015, ApJ, 801, 31
- Riviere-Marichalar et al. (2012) Riviere-Marichalar, P., Barrado, D., Augereau, J.-C., et al. 2012, A&A, 546, L8
- Riviere-Marichalar et al. (2014) Riviere-Marichalar, P., Barrado, D., Montesinos, B., et al. 2014, A&A, 565, A68
- Roberge et al. (2006) Roberge, A., Feldman, P. D., Weinberger, A. J., Deleuil, M., & Bouret, J.-C. 2006, Nature, 441, 724
- Roberge et al. (2014) Roberge, A., Welsh, B. Y., Kamp, I., Weinberger, A. J., & Grady, C. A. 2014, ApJ, 796, L11
- Roberge et al. (2013) Roberge, A., Kamp, I., Montesinos, B., et al. 2013, ApJ, 771, 69
- Rodigas et al. (2014) Rodigas, T. J., Debes, J. H., Hinz, P. M., et al. 2014, ApJ, 783, 21
- Schlafly & Finkbeiner (2011) Schlafly, E. F., & Finkbeiner, D. P. 2011, ApJ, 737, 103
- Sheret et al. (2004) Sheret, I., Dent, W. R. F., & Wyatt, M. C. 2004, MNRAS, 348, 1282
- Siess et al. (2000) Siess, L., Dufour, E., & Forestini, M. 2000, A&A, 358, 593
- Slawson et al. (1992) Slawson, R. W., Hill, R. J., & Landstreet, J. D. 1992, ApJS, 82, 117
- Slettebak (1975) Slettebak, A. 1975, ApJ, 197, 137
- Torres et al. (2008) Torres, C. A. O., Quast, G. R., Melo, C. H. F., & Sterzik, M. F. 2008, Handbook of Star Forming Regions, Volume II: The Southern Sky ASP Monograph Publications, Vol. 5. Edited by Bo Reipurth, p.757
- van Leeuwen (2007) van Leeuwen, F., ed. 2007, Astrophysics and Space Science Library, Vol. 350, Hipparcos, the New Reduction of the Raw Data
- Vassilev et al. (2008) Vassilev, V., Meledin, D., Lapkin, I., et al. 2008, A&A, 490, 1157
- Vican & Schneider (2014) Vican, L., & Schneider, A. 2014, ApJ, 780, 154
- Visser et al. (2009) Visser, R., van Dishoeck, E. F., & Black, J. H. 2009, A&A, 503, 323
- Wahhaj et al. (2013) Wahhaj, Z., Liu, M. C., Nielsen, E. L., et al. 2013, ApJ, 773, 179
- Weinberger et al. (2000) Weinberger, A. J., Rich, R. M., Becklin, E. E., Zuckerman, B., & Matthews, K. 2000, ApJ, 544, 937
- Welsh & Montgomery (2013) Welsh, B. Y., & Montgomery, S. 2013, PASP, 125, 759
- Werner et al. (2004) Werner, M. W., Roellig, T. L., Low, F. J., et al. 2004, ApJS, 154, 1
- Williams & Cieza (2011) Williams, J. P., & Cieza, L. A. 2011, ARA&A, 49, 67
- Wilson & Bell (2002) Wilson, N. J., & Bell, K. L. 2002, MNRAS, 337, 1027
- Wright et al. (2010) Wright, E. L., Eisenhardt, P. R. M., Mainzer, A. K., et al. 2010, AJ, 140, 1868
- Wyatt (2008) Wyatt, M. C. 2008, ARA&A, 46, 339
- Wyatt et al. (2015) Wyatt, M. C., Panić, O., Kennedy, G. M., & Matrà, L. 2015, Ap&SS, 357, 103
- Yang et al. (2013) Yang, B., Stancil, P. C., Balakrishnan, N., Forrey, R. C., & Bowman, J. M. 2013, ApJ, 771, 49
- Zuckerman et al. (1995) Zuckerman, B., Forveille, T., & Kastner, J. H. 1995, Nature, 373, 494
- Zuckerman & Song (2012) Zuckerman, B., & Song, I. 2012, ApJ, 758, 77
| ID | SpT | Dist. | Age | Memb. | Prog. | |||||
|---|---|---|---|---|---|---|---|---|---|---|
| (pc) | (Myr) | (Jy km s-1) | (Jy km s-1) | (Jy km s-1) | () | |||||
| (1) | (2) | (3) | (4) | (5) | (6) | (7) | (8) | (9) | (10) | (11) |
| Young debris disks with | ||||||||||
| HD 16743 | F0/F2III | 58.9 | 30 (2) | - | 5.110-4 (3) | 2 | … | 1.24 | … | 4.6 |
| HD 38206bbHD 17848, HD 105, HD 377, HD 61005 and HD 181296 were also observed at the CO (3–2) transition by Hales et al. (2014) using the APEX and ASTE radio telescopes, for HD 377 observation at 2–1 transition is also available in Pascucci et al. (2006). HD 38206 and HD 131835 were searched for gas at 2–1 transition of CO (Kastner et al., 2010; Zuckerman & Song, 2012). All of these previous measurements produced non-detections for these targets. | A0V | 75.1 | 30 | COL | 1.410-4 (1) | 2 | … | 2.40 | … | 1.4 |
| HD 95086aaCO observational data regarding this object are already published in Moór et al. (2013). | A8III | 90.4 | 17 | LCC | 1.710-3 (3) | 2 | … | 1.95 | … | 1.7 |
| HD 121191 | A5IV/V | 130.0 | 17 | LCC | 4.910-3 (2) | 4 | … | 1.47 | … | 2.6 |
| HD 131488 | A1V | 150.0 | 16 | UCL | 6.010-3 (2) | 4 | … | 1.39 | … | 3.3 |
| HD 131835bbHD 17848, HD 105, HD 377, HD 61005 and HD 181296 were also observed at the CO (3–2) transition by Hales et al. (2014) using the APEX and ASTE radio telescopes, for HD 377 observation at 2–1 transition is also available in Pascucci et al. (2006). HD 38206 and HD 131835 were searched for gas at 2–1 transition of CO (Kastner et al., 2010; Zuckerman & Song, 2012). All of these previous measurements produced non-detections for these targets. | A2IVccThe effective temperature of this star estimated by us (see Sect. 3.1) is rather more consistent with a spectral type of A4. | 122.7 | 16 | UCL | 3.010-3 (5) | 1,2,3 | 1.600.78 | 2.740.55 | 4.462.99 | 5.2eeDerived from an LTE model (see Sect. 3.3). |
| HD 181296bbHD 17848, HD 105, HD 377, HD 61005 and HD 181296 were also observed at the CO (3–2) transition by Hales et al. (2014) using the APEX and ASTE radio telescopes, for HD 377 observation at 2–1 transition is also available in Pascucci et al. (2006). HD 38206 and HD 131835 were searched for gas at 2–1 transition of CO (Kastner et al., 2010; Zuckerman & Song, 2012). All of these previous measurements produced non-detections for these targets. | A0V | 48.2 | 23 | BPMG | 2.410-4 (1) | 4 | … | 1.38 | 5.36 | 3.4 |
| Older A-type stars with extended, cold debris disks | ||||||||||
| HD 10939 | A1V | 62.0 | 346 (4) | - | 1.210-4 (3) | 2 | … | 1.37 | … | 5.6 |
| HD 17848bbHD 17848, HD 105, HD 377, HD 61005 and HD 181296 were also observed at the CO (3–2) transition by Hales et al. (2014) using the APEX and ASTE radio telescopes, for HD 377 observation at 2–1 transition is also available in Pascucci et al. (2006). HD 38206 and HD 131835 were searched for gas at 2–1 transition of CO (Kastner et al., 2010; Zuckerman & Song, 2012). All of these previous measurements produced non-detections for these targets. | A2V | 50.5 | 372 (4) | - | 7.610-5 (3) | 2 | … | 1.42 | … | 3.8 |
| HD 161868 | A0V | 31.5 | 450 (3) | - | 1.310-4 (3) | 2 | … | 1.82 | … | 1.9 |
| HD 182681 | B8/B9V | 69.9 | 144 (4) | - | 2.810-4 (3) | 2 | … | 2.15 | … | 1.1 |
| Debris disks around G–K-type Sun-like stars | ||||||||||
| HD 105bbHD 17848, HD 105, HD 377, HD 61005 and HD 181296 were also observed at the CO (3–2) transition by Hales et al. (2014) using the APEX and ASTE radio telescopes, for HD 377 observation at 2–1 transition is also available in Pascucci et al. (2006). HD 38206 and HD 131835 were searched for gas at 2–1 transition of CO (Kastner et al., 2010; Zuckerman & Song, 2012). All of these previous measurements produced non-detections for these targets. | G0V | 39.4 | 30 | THA | 1.910-4 (1) | 3 | … | 1.42 | 6.08 | 2.4 |
| HD 377bbHD 17848, HD 105, HD 377, HD 61005 and HD 181296 were also observed at the CO (3–2) transition by Hales et al. (2014) using the APEX and ASTE radio telescopes, for HD 377 observation at 2–1 transition is also available in Pascucci et al. (2006). HD 38206 and HD 131835 were searched for gas at 2–1 transition of CO (Kastner et al., 2010; Zuckerman & Song, 2012). All of these previous measurements produced non-detections for these targets. | G2V | 39.1 | 183 (5)ddVican & Schneider (2014) provided two different age estimates for these targets. Here we quoted the average of the two values. | - | 2.610-4(1) | 3 | … | 1.03 | 2.41 | 1.7 |
| HD 61005bbHD 17848, HD 105, HD 377, HD 61005 and HD 181296 were also observed at the CO (3–2) transition by Hales et al. (2014) using the APEX and ASTE radio telescopes, for HD 377 observation at 2–1 transition is also available in Pascucci et al. (2006). HD 38206 and HD 131835 were searched for gas at 2–1 transition of CO (Kastner et al., 2010; Zuckerman & Song, 2012). All of these previous measurements produced non-detections for these targets. | G3/G5V | 35.3 | 40 | ARG | 1.610-3 (1) | 3 | … | 1.27 | 4.37 | 1.7 |
| HD 92945 | K1V | 21.4 | 211 (5)ddVican & Schneider (2014) provided two different age estimates for these targets. Here we quoted the average of the two values. | - | 4.910-4(1) | 3 | … | 1.33 | 3.86 | 0.7 |
| HD 160305 | F8/G0V | 72.5 | 23 | BPMG | 8.610-5 (4) | 3 | … | 1.61 | 5.54 | 9.0 |
| HD 202917 | G5V | 43.0 | 30 | THA | 2.810-4 (1) | 3 | … | 1.46 | 7.22 | 2.9 |
| A-type stars with debris disks and variable Ca absorption line | ||||||||||
| HD 110411 | A0V | 36.3 | 90 (4) | - | 5.910-5 (1) | 5 | 0.20 | … | … | 0.6 |
| HD 182919 | A0V | 72.9 | 198 (1) | - | 3.410-5 (1) | 5 | 0.16 | … | … | 2.0 |
| HD 183324 | A0V | 61.2 | 140 (1) | - | 2.210-5 (1) | 5 | 0.16 | … | … | 1.4 |
Note. — Col.(1): Identification. Col.(2): Spectral type. Col.(3): Distance. Based on Hipparcos trigonometric parallax when it is available. For HD 121191 and HD 131488 distances were taken from Melis et al. (2013). Col.(4): Stellar age. For members of young moving groups and associations we adopted the age of the corresponding group. For the other objects the age information were taken from the literature (references are in brackets): 1) Chen et al. (2014); 2) Moór et al. (2011b); 3) Moór et al. (2015); 4) Nielsen et al. (2013); 5) Vican & Schneider (2014). Col.(5): Membership status of the star. ARG: the Argus moving group; BPMG: the Pic moving group; COL: the Columba moving group; LCC: the Lower Centaurus Crux association; THA: the Tucana-Horologium association; UCL: the Upper Centaurus Lupus association. Col.(6): Fractional dust luminosity. Apart from HD 131835 the data were taken from the literature: 1) Chen et al. (2014); 2) Melis et al. (2013); 3) Moór et al. (2015); 4) Patel et al. (2014); 5) this work. Col.(7): Observation projects. 1) - E-083.C-0303; 2) - M-087.F-0001; 3) - M-092.F-0012; 4) - M-093.F-0010; 5) - IRAM-172-13. Col.(8–10): integrated line fluxes for CO =21, =32, =43 (see Sect. 2.2). Col.(11): estimated mass of the CO gas.
| project ID | telescope | receiver | backend | obs. period |
|---|---|---|---|---|
| E-083.C-0303 | APEX | SHeFI/APEX2 | FFTS | 2009-05-18 |
| M-087.F-0001-2011 | APEX | SHeFI/APEX2 | FFTS,XFFTS | 2011-04-14–2011-12-16 |
| APEX | SHeFI/APEX1 | XFFTS | ||
| M-092.F-0012-2013 | APEX | FLASH+ | XFFTS | 2013-09-29–2013-10-17 |
| M-093.F-0010-2014 | APEX | FLASH+ | XFFTS | 2014-04-23–2014-04-27 |
| IRAM-172-13 | IRAM | EMIR | FTS | 2014-01-08 |
| Meas. fluxa | Instr. | Pred. flux | Reference | |
|---|---|---|---|---|
| [µm] | [mJy] | [mJy] | ||
| 3.35 | 297.010.3 | WISE | 302.9 | Wright et al. (2010) |
| 4.60 | 165.25.5 | WISE | 168.1 | Wright et al. (2010) |
| 6.00 | 104.110.2 | IRS | 101.6 | this work |
| 7.00 | 80.27.0 | IRS | 75.5 | this work |
| 7.97 | 67.74.5 | IRS | 58.7 | this work |
| 9.00 | 58.63.6 | IRS | 46.4 | this work |
| 9.00 | 68.77.0 | IRC | 46.4 | Ishihara et al. (2010) |
| 10.00 | 52.83.4 | IRS | 37.8 | this work |
| 10.99 | 50.42.6 | IRS | 31.3 | this work |
| 11.56 | 49.12.3 | WISE | 28.4 | Wright et al. (2010) |
| 13.05 | 50.82.8 | IRS | 22.3 | this work |
| 14.83 | 56.24.9 | IRS | 17.3 | this work |
| 16.99 | 70.46.5 | IRS | 13.3 | this work |
| 19.02 | 88.57.7 | IRS | 10.6 | this work |
| 21.28 | 115.215.6 | IRS | 8.5 | this work |
| 22.09 | 161.59.7 | WISE | 7.9 | Wright et al. (2010) |
| 23.67 | 153.13.1 | MIPS | 6.8 | Chen et al. (2012) |
| 24.48 | 160.815.2 | IRS | 6.4 | this work |
| 25.00 | 186.033.5 | IRAS | 6.1 | Moshir (1990) |
| 27.45 | 207.519.7 | IRS | 5.1 | this work |
| 30.50 | 249.519.1 | IRS | 4.1 | this work |
| 33.55 | 309.723.4 | IRS | 3.4 | this work |
| 60.00 | 684.061.6 | IRAS | 1.1 | Moshir (1990) |
| 70.00b | 738.752.5 | PACS | 0.8 | this work |
| 71.42 | 659.233.4 | MIPS | 0.7 | Chen et al. (2012) |
| 100.00b | 637.045.5 | PACS | 0.37 | this work |
| 160.00 | 382.327.9 | PACS | 0.14 | this work |
| 250.00 | 156.411.5 | SPIRE | 0.06 | this work |
| 350.00 | 84.38.3 | SPIRE | 0.03 | this work |
| 500.00 | 35.48.9 | SPIRE | 0.01 | this work |
| 870.00 | 8.54.4 | LABOCA | 0.005 | Nilsson et al. (2010) |
| ID | D | Teff | L∗ | M∗ | Age | Group |
|---|---|---|---|---|---|---|
| (pc) | (K) | (L⊙) | (M⊙) | (Myr) | ||
| 49 Ceti | 59.4 | 8900 (5) | 16.4 (5) | 2.00 (5) | 40 (3,11) | ARG |
| HD 21997 | 71.9 | 8300 (5) | 11.2 (5) | 1.85 (5) | 30 (3,11) | COL |
| Pic | 19.44 | 8200 (2) | 8.7 (2) | 1.75 (2) | 23 (4) | BPMG |
| HD 131835 | 122.7 | 8250 (10) | 9.2 (10) | 1.77 (10) | 16 (7) | UCL |
| HD 32297 | 112.4 | 8000 (9) | 6.2 (9) | 1.65 (9) | 15–500 (9) | - |
| HD 172555 | 28.5 | 7800 (7) | 7.8 (7) | 1.68 (7) | 23 (4) | BPMG |
| Tel | 48.2 | 9500 (1) | 20.9 (1) | 2.20 (1) | 23 (4) | BPMG |
Note. — Col.(1): Identification. Col.(2): Distance. Based on Hipparcos trigonometric parallaxes. Col.(3): Effective temperature. Col.(4): Luminosity. Col.(5): Stellar mass. Col.(6): Stellar age. For members of young moving groups and associations we adopted the age of the corresponding group. Col.(7): Membership status of the star. For group names see Table 1 caption. References for the literature data used in this table: 1) Chen et al. (2014); 2) Crifo et al. (1997); 3) Gagné et al. (2014); 4) Mamajek & Bell (2014); 5) Moór et al. (2015); 6) Pecaut et al. (2012); 7) Riviere-Marichalar et al. (2012); 8) Roberge et al. (2013); 9) Rodigas et al. (2014); 10) this work; 11) Torres et al. (2008).
| ID | LIR/Lbol | Mdust | Gas detection | MCO | Variable | Proposed |
|---|---|---|---|---|---|---|
| CO/O I/C II/C I | abs. lines | origin | ||||
| (M⊕) | (M⊕) | |||||
| 49 Ceti | 1.110-3 (14) | 2.70.410-1 (14) | Y/Y/Y/Y (22,19,20) | 2.510-4 (4) | Y (12) | Secondary (19) |
| HD 21997 | 5.710-4 (14) | 1.60.510-1 (14) | Y/N/N/N (13) | 4–810-2 (10) | N | Primordial (10) |
| Pic | 2.610-3 (15) | 7.80.810-2 (5) | Y/Y/Y/Y (5,18,2) | 2.910-5 (5) | Y (1) | Secondary (7,5) |
| HD 131835 | 3.010-3 (21) | 4.71.610-1 (21) | Y/N/N/N (21) | 5.210-4 (21) | N | ? |
| HD 32297 | 4.410-3 (3) | 3.71.110-1 (11) | N/N/Y/N (6) | 2.210-4 (13) | N | Secondary (6) |
| HD 172555 | 7.310-4 (16) | 4.80.0610-4 (16) | N/N/N/Y (16) | 2.410-5 (13) | Y (9) | Secondary (8,16) |
| Tel | 2.410-4 (3) | 1.30.0810-2 (17) | N/N/Y/N (17) | 6.810-5 (21) | N | Secondary (17) |
Note. — Col.(1): Identification. Col.(2): Fractional luminosity of the disks. Col.(3): Dust mass. In the case of HD 32297 the mass was estimated from the 1.3 mm data published by Meeus et al. (2012), using the outline described in Sect. 3.2. Col. (4): Detection of CO, O I, C II, and C I gas. Col.(5): Mass of CO gas. For HD 21997 and Pic the mass estimates were taken from the literature or from Table 1. For the sake of homogeneity, in the case of 49 Ceti, HD 32297, and HD 172555 the previous mass estimates were recomputed using their CO (3–2) line flux data taken from the literature and assuming optically thin emission and K. Because of unknown 12CO optical depth the mass estimates for 49 Ceti and HD 131835 are lower limits. Col.(6): Detection of variable optical absorption lines. Col.(7): Proposed origin of the observed gas. References for the literature data used in this table: 1) Beust et al. (1994); 2) Cataldi et al. (2014); 3) Chen et al. (2014); 4) Dent et al. (2005); 5) Dent et al. (2014); 6) Donaldson et al. (2013); 7) Fernández et al. (2006); 8) Johnson et al. (2012); 9) Kiefer et al. (2014); 10) Kóspál et al. (2013); 11) Meeus et al. (2012); 12) Montgomery & Welsh (2012); 13) Moór et al. (2011a); 14) Moór et al. (2015); 15) Rhee et al. (2007); 16) Riviere-Marichalar et al. (2012); 17) Riviere-Marichalar et al. (2014); 18) Roberge et al. (2006); 19) Roberge et al. (2013); 20) Roberge et al. (2014); 21) this work; 22) Zuckerman et al. (1995).