Complex phase diagram of Ba1-xNaxFe2As2: a multitude of phases striving for the electronic entropy
Abstract
The low-temperature electronic phase diagram of Ba1-xNaxFe2As2, obtained using high-resolution thermal-expansion and specific-heat measurements, is shown to be considerably more complex than previously reported, containing nine different phases. Besides the magnetic and reentrant phases, we find evidence for an additional, presumably magnetic, phase below the usual SDW transition, as well as a possible incommensurate magnetic phase. All these phases coexist and compete with superconductivity, which is particularly strongly suppressed by the -magnetic phase due to a strong reduction of the electronic entropy available for pairing in this phase.
High-temperature superconductivity in Fe-based systems usually emerges when a stripe-type antiferromagnetic spin-density-wave (SDW) is suppressed by either doping or pressure (Paglione and Greene, 2010; Johnston, 2010; Ishida et al., 2009). The SDW transition is accompanied, or sometimes even slightly preceeded, by a structural phase transition from a high-temperature tetragonal () to a low-temperature orthorhombic () state, which has sparked the lively debate about electronic nematicity and the respective role of spin and orbital physics in these materials (Kontani et al., 2011; Fernandes and Schmalian, 2012; Fernandes et al., 2014; Böhmer et al., 2015a; Böhmer and Meingast, 2015). In the hole-doped compounds, Ba1-xNaxFe2As2, Ba1-xKxFe2As2, and Sr1-xNaxFe2As2, recent studies have shown that the symmetry is restored in a small pocket within the magnetic phase region (Avci et al., 2014; Böhmer et al., 2015b; Mallett et al., 2015; Allred et al., 2015). Mössbauer studies on Sr0.63Na0.37Fe2As2 find that only half of the Fe sites carry a magnetic moment in this phase (Allred et al., 2015), which is consistent with the double-Q magnetic structure predicted within the itinerant spin-nematic scenario (Fernandes et al., 2014; Avci et al., 2014; Allred et al., 2015; Gastiasoro and Andersen, 2015). Moreover, neutron studies have shown that the spins flip from in-plane in the phase to out of plane in the reentrant phase (Waßer et al., 2015), indicating that spin-orbit interactions cannot be neglected. In the Ba1-xKxFe2As2 system, the reentrant phase reverts back to the phase near the onset of superconductivity, due to a stronger competition of the phase with superconductivity (Böhmer et al., 2015b). The presence of this phase in the hole-doped systems presents strong evidence that the physics of these Fe-based systems can be treated in an itinerant picture, and recent theoretical studies based upon the spin-nematic scenario can reproduce phase diagrams very similar to the experimental ones (Kang et al., 2015), as well as the spin-reorientation in the phase if spin-orbit interactions are included (Christensen et al., 2015).
Here, we reinvestigate in greater detail the low-temperature electronic phase diagram of Ba1-xNaxFe2As2 using high-resolution thermal-expansion and specific- heat measurements and show that it is considerably more complex than previously reported, containing nine different phases. Besides the usual and reentrant magnetic phases, we find evidence for an additional, presumably magnetic, phase, in which the orthorhombic distortion is substantially reduced but still finite. These phases coexist and compete with superconductivity, which is particularly strongly suppressed by the reentrant phase. Further, we provide indications that the SDW transition becomes incommensurate above x = 0.22, which appears linked to the emergence of the phase at this composition. The surprising occurence of this multitude of phases near the onset of superconductivity suggests a highly degenerate free-energy landscape near optimal doping, which may be related to the occurence of superconductivity in the Fe-based systems.
Single crystals of Ba1-xNaxFe2As2 were grown in alumina crucibles using a self-flux method with (Ba,Na): FeAs ratios 1:4 - 1:5. The crucibles were sealed in iron cylinders filled with argon gas. After heating to 1150 - 1170 0 the furnace was cooled down slowly at rates between 0.3 - 0.5 0 /h to minimize the amount of flux inclusions. Near 940 - 1020 0 the furnace was turned upside down to separate the remaining liquid flux from the grown crystals and then cooled down to room temperature with intermediate holds to in-situ anneal the crystals. Thermal expansion was measured using a high-resolution home-made capacitance dilatometer (Meingast et al., 1990), which is several orders of magnitude more sensitive than traditional diffraction techniques. Heat capacity was measured using a Physical Property Measurement System from Quantum Design. The electronic specific heat was obtained by subtracting an appropriate phonon background (Hardy et al., 2010a, 2013; Böhmer et al., 2015b). Specifically, as demonstrated for Ba1-xKxFe2As2 (Böhmer et al., 2015b; Hardy, ), the phonon background can be approximated as the weighted sum of the individual lattice contributions of its ’constitutents’ (Qiu and White, 2001), which are BaFe2As2 and NaFe2As2 for the present case. Since there are no crystals of NaFe2As2, we determined the hypothetical NaFe2As2 phonon background by assuming that the electronic component at optimal doping of Na- and K-doped (Böhmer et al., 2015b) systems are identical. This is quite reasonable, since both and the heat capacity jumps at optimal doping are very similar in both systems. The Na content of seven single crystals (x = 0.093(4), 0.182(2), 0.221(2), 0.283(2), 0.320(2), 0.360(3), and 0.401(4)) used for the thermal-expansion and specific-heat measurements was accurately determined by 4-circle single crystal x-ray refinement of a small piece of the measured crystals. The Na content of the other crystals were interpolated between these fixed points using the SDW transition temperature as a reference. The values of the structural parameters from our x-ray refinement are in good agreement with previous results (Avci et al., 2013).
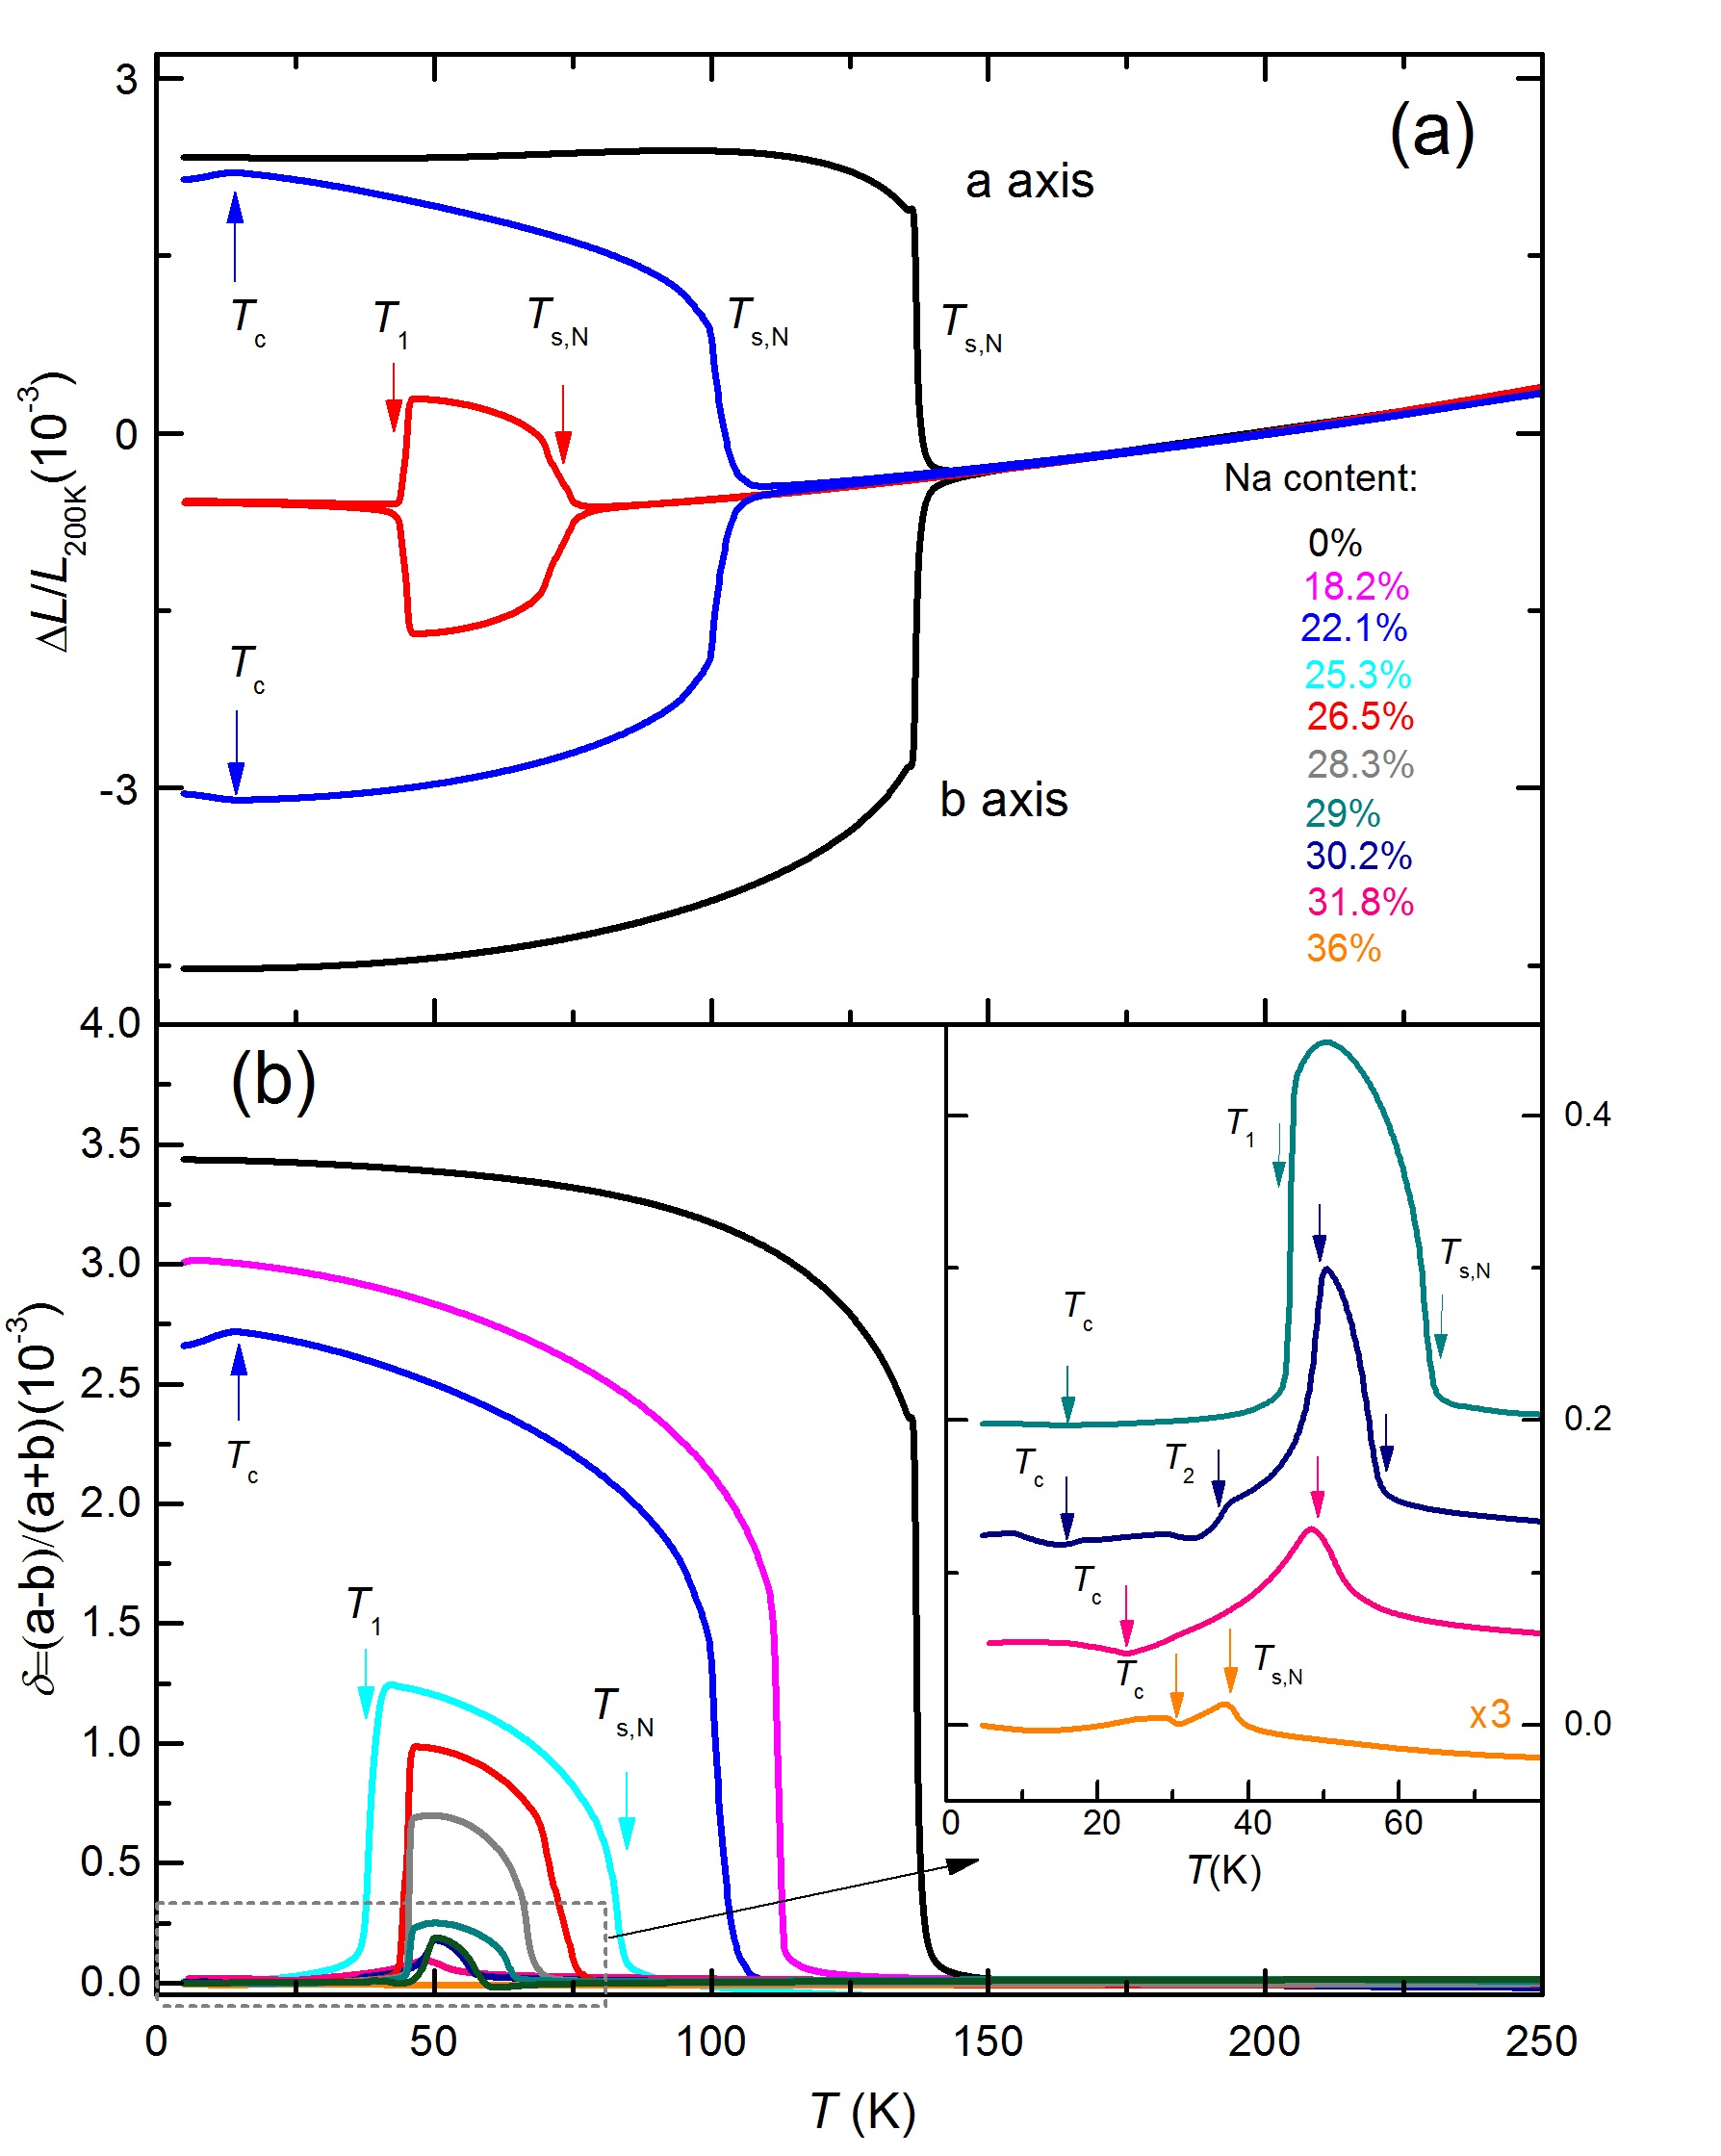
Fig. 1a presents the relative thermal expansion, , measured along the a- and b-axes for three representative Na doping levels. As we have demonstrated previously (Böhmer et al., 2012, 2015b), the shorter b-axis in the low-temperature orthorhombic phase can be obtained directly by measuring the expansion of the crystal along the [110]T direction of the original tetragonal cell, because in this configuration the small force from the dilatometer detwins the crystal. The larger a-axis, on the other hand, is obtained by combining a ’twinned’ measurement (along [100]T) with the ’detwinned’ data (Böhmer et al., 2012, 2015b). The expected orthorhombic splitting of the a- and b-lattice parameters at the SDW transition at is clearly observed for all three concentrations and reduces in magnitude with increasing Na content. For the x = 0.265 sample, this splitting suddenly disappears, within the accuracy of the measurements, at a first-order transition at = 45K, which we identify with the magnetic phase (Avci et al., 2014; Böhmer et al., 2015b).
In order to study the doping evolution of these transitions in greater detail, we present in Fig. 1b the orthorhombic distortion, , inferred from our thermal-expansion data for a number of compositions between x = 0 and x = 0.36. We detect clear signatures of the structural distortion associated with the SDW transition at all the way to x = 0.36, which is considerably higher than observed previously by neutron diffraction (Avci et al., 2014, 2013). We note, however, that the orthorhombic splitting becomes extremely small in this high-doping region (see inset of Fig. 1b), which is probably why it was missed previously. The presence of the reentrant phase is signaled by a sudden disappearance of at , which we observe for 0.22 x 0.29. The behavior of the lattice parameters changes dramatically for x = 0.302, where we observe a more gradual reduction of at , indicative of a second-order transition, followed by a previously unobserved transition at . Upon further doping, the transition at disappears and the transitions at and appear to merge together. The well-known reduction of at the superconducting transition in the SDW phase due to the competition between superconductivity and magnetism (Nandi et al., 2010; Böhmer et al., 2012; Meingast et al., 2012) is clearly observed for the crystal with x = 0.221, whereas the effect of superconductivity on the in-plane lattice parameters in the phase is too small to be seen in these curves.
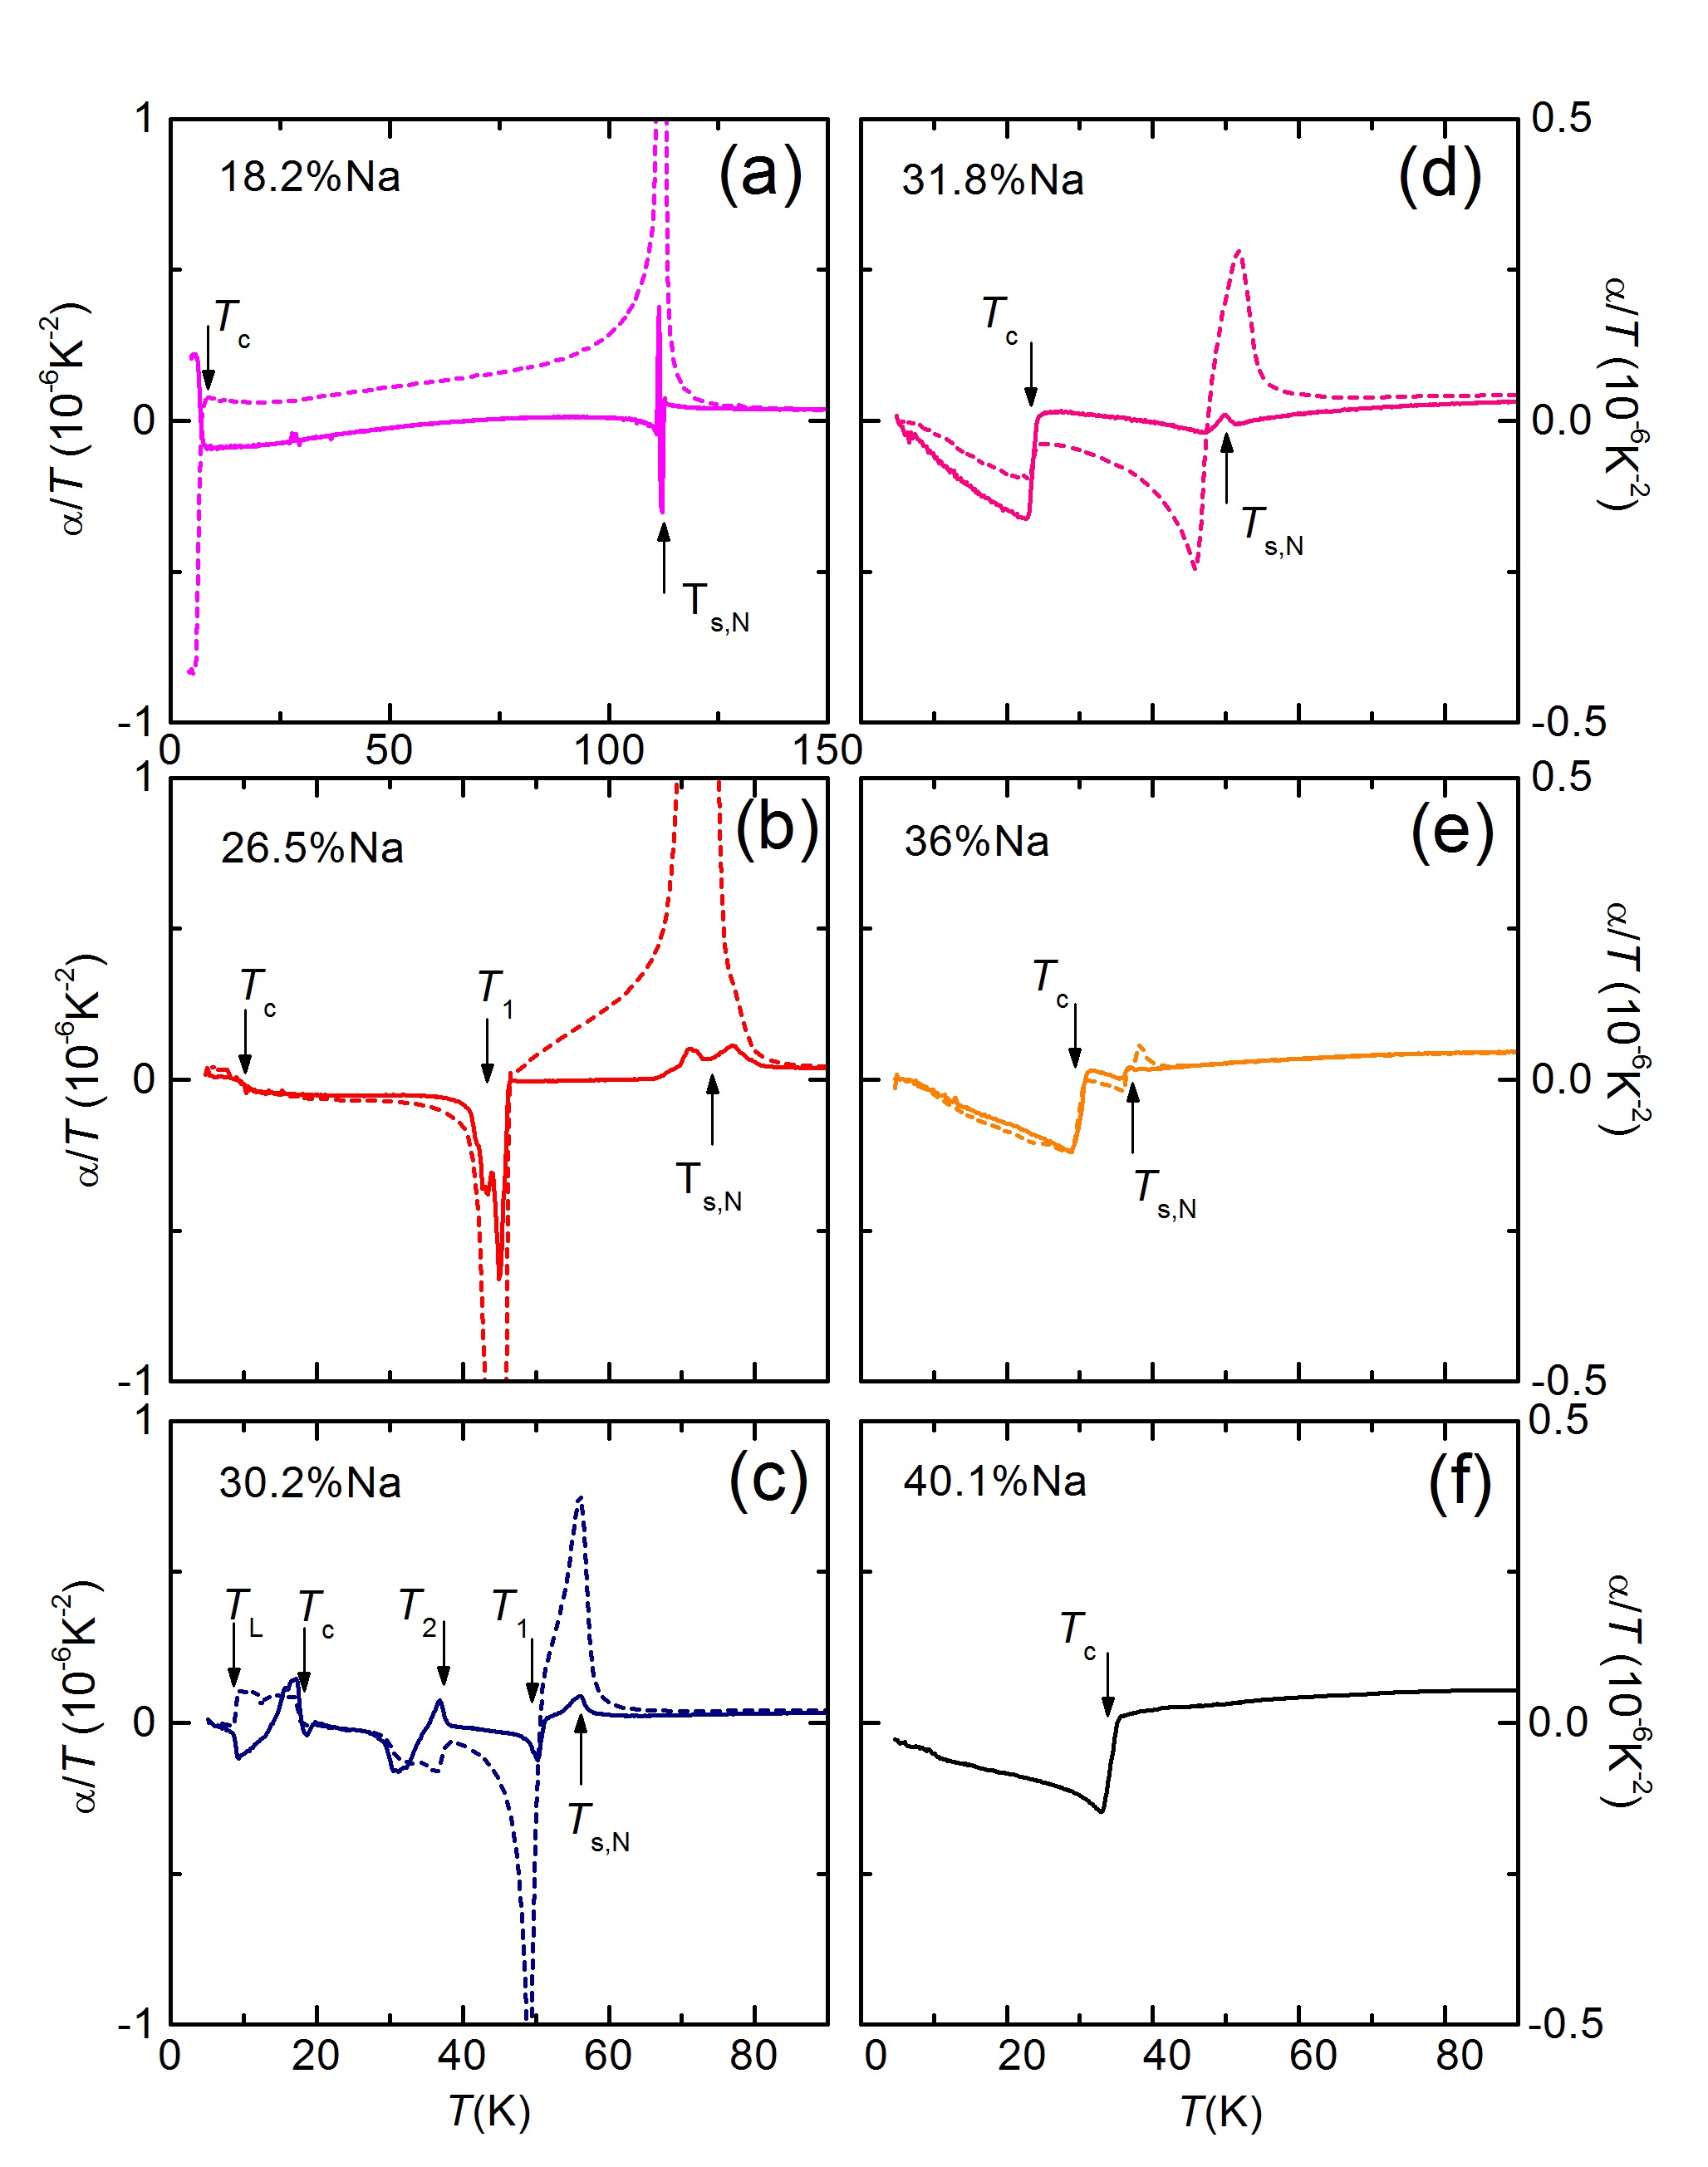
The small anomalies associated with the onset of , as well as the other phase transitions, are more clearly observed in the thermal-expansion coefficients, , for the ’twinned’ and ’detwinned’ directions, which are presented as versus T for representative Na contents in Fig.2. Fig.2a displays data for the crystal with x = 0.182, which becomes orthorhombic below = 112 K and superconducting below = 6.5 K. The clear anisotropy of the in-plane expansion below , as well as the anisotropic response at , are indicative of the expected orthorhombic state at this doping level. We note that the small anisotropic tail above results from the small, but finite, uniaxial pressure we apply in our dilatometer (Böhmer et al., 2015b). In contrast to the behavior for x = 0.182, the anisotropy of the expansivity vanishes nearly completely below the transition at for the x = 0.265 sample (see Fig.2b), indicating the reentrant tetragonal state below . As expected at the onset of superconductivity, small jump-like anomalies at are observed for both directions. The behavior of the x = 0.302 crystal is more complicated (see Fig.2c). Here the crystal clearly becomes orthorhombic at , then decreases gradually between and (see inset of Fig.1b), but remains orthorhombic. The expansivities for both orientations are equal below , suggesting that the system again enters a tetragonal state. The curves below , however, again exhibit an anisotropic response, suggesting that the phase reverts back to the ’ phase below , in analogy to what has been observed in K-doped BaFe2As2 (Böhmer et al., 2015b). There is an additional sharp anomaly at =10 K for both orientations, which is however observed only upon heating, possibly indicating another phase transition with a large thermal hysteresis. Nearly identical behavior was observed in another crystal with a similar composition. Our expansion data thus clearly show that the reentrant phase exists only in a limited temperature range between and for x = 0.302. The transitions at and both disappear for the next higher Na content (see Fig.2d), and this sample also clearly displays strongly anisotropic thermal expansivities below , which is incompatible with a symmetry. The x = 0.36 crystal (Fig. 2e) exhibits only very small effects at and . Finally, any signature of the anomaly at has disappeared in the crystal with x = 0.401, which only has a clear anomaly at = 35 K.
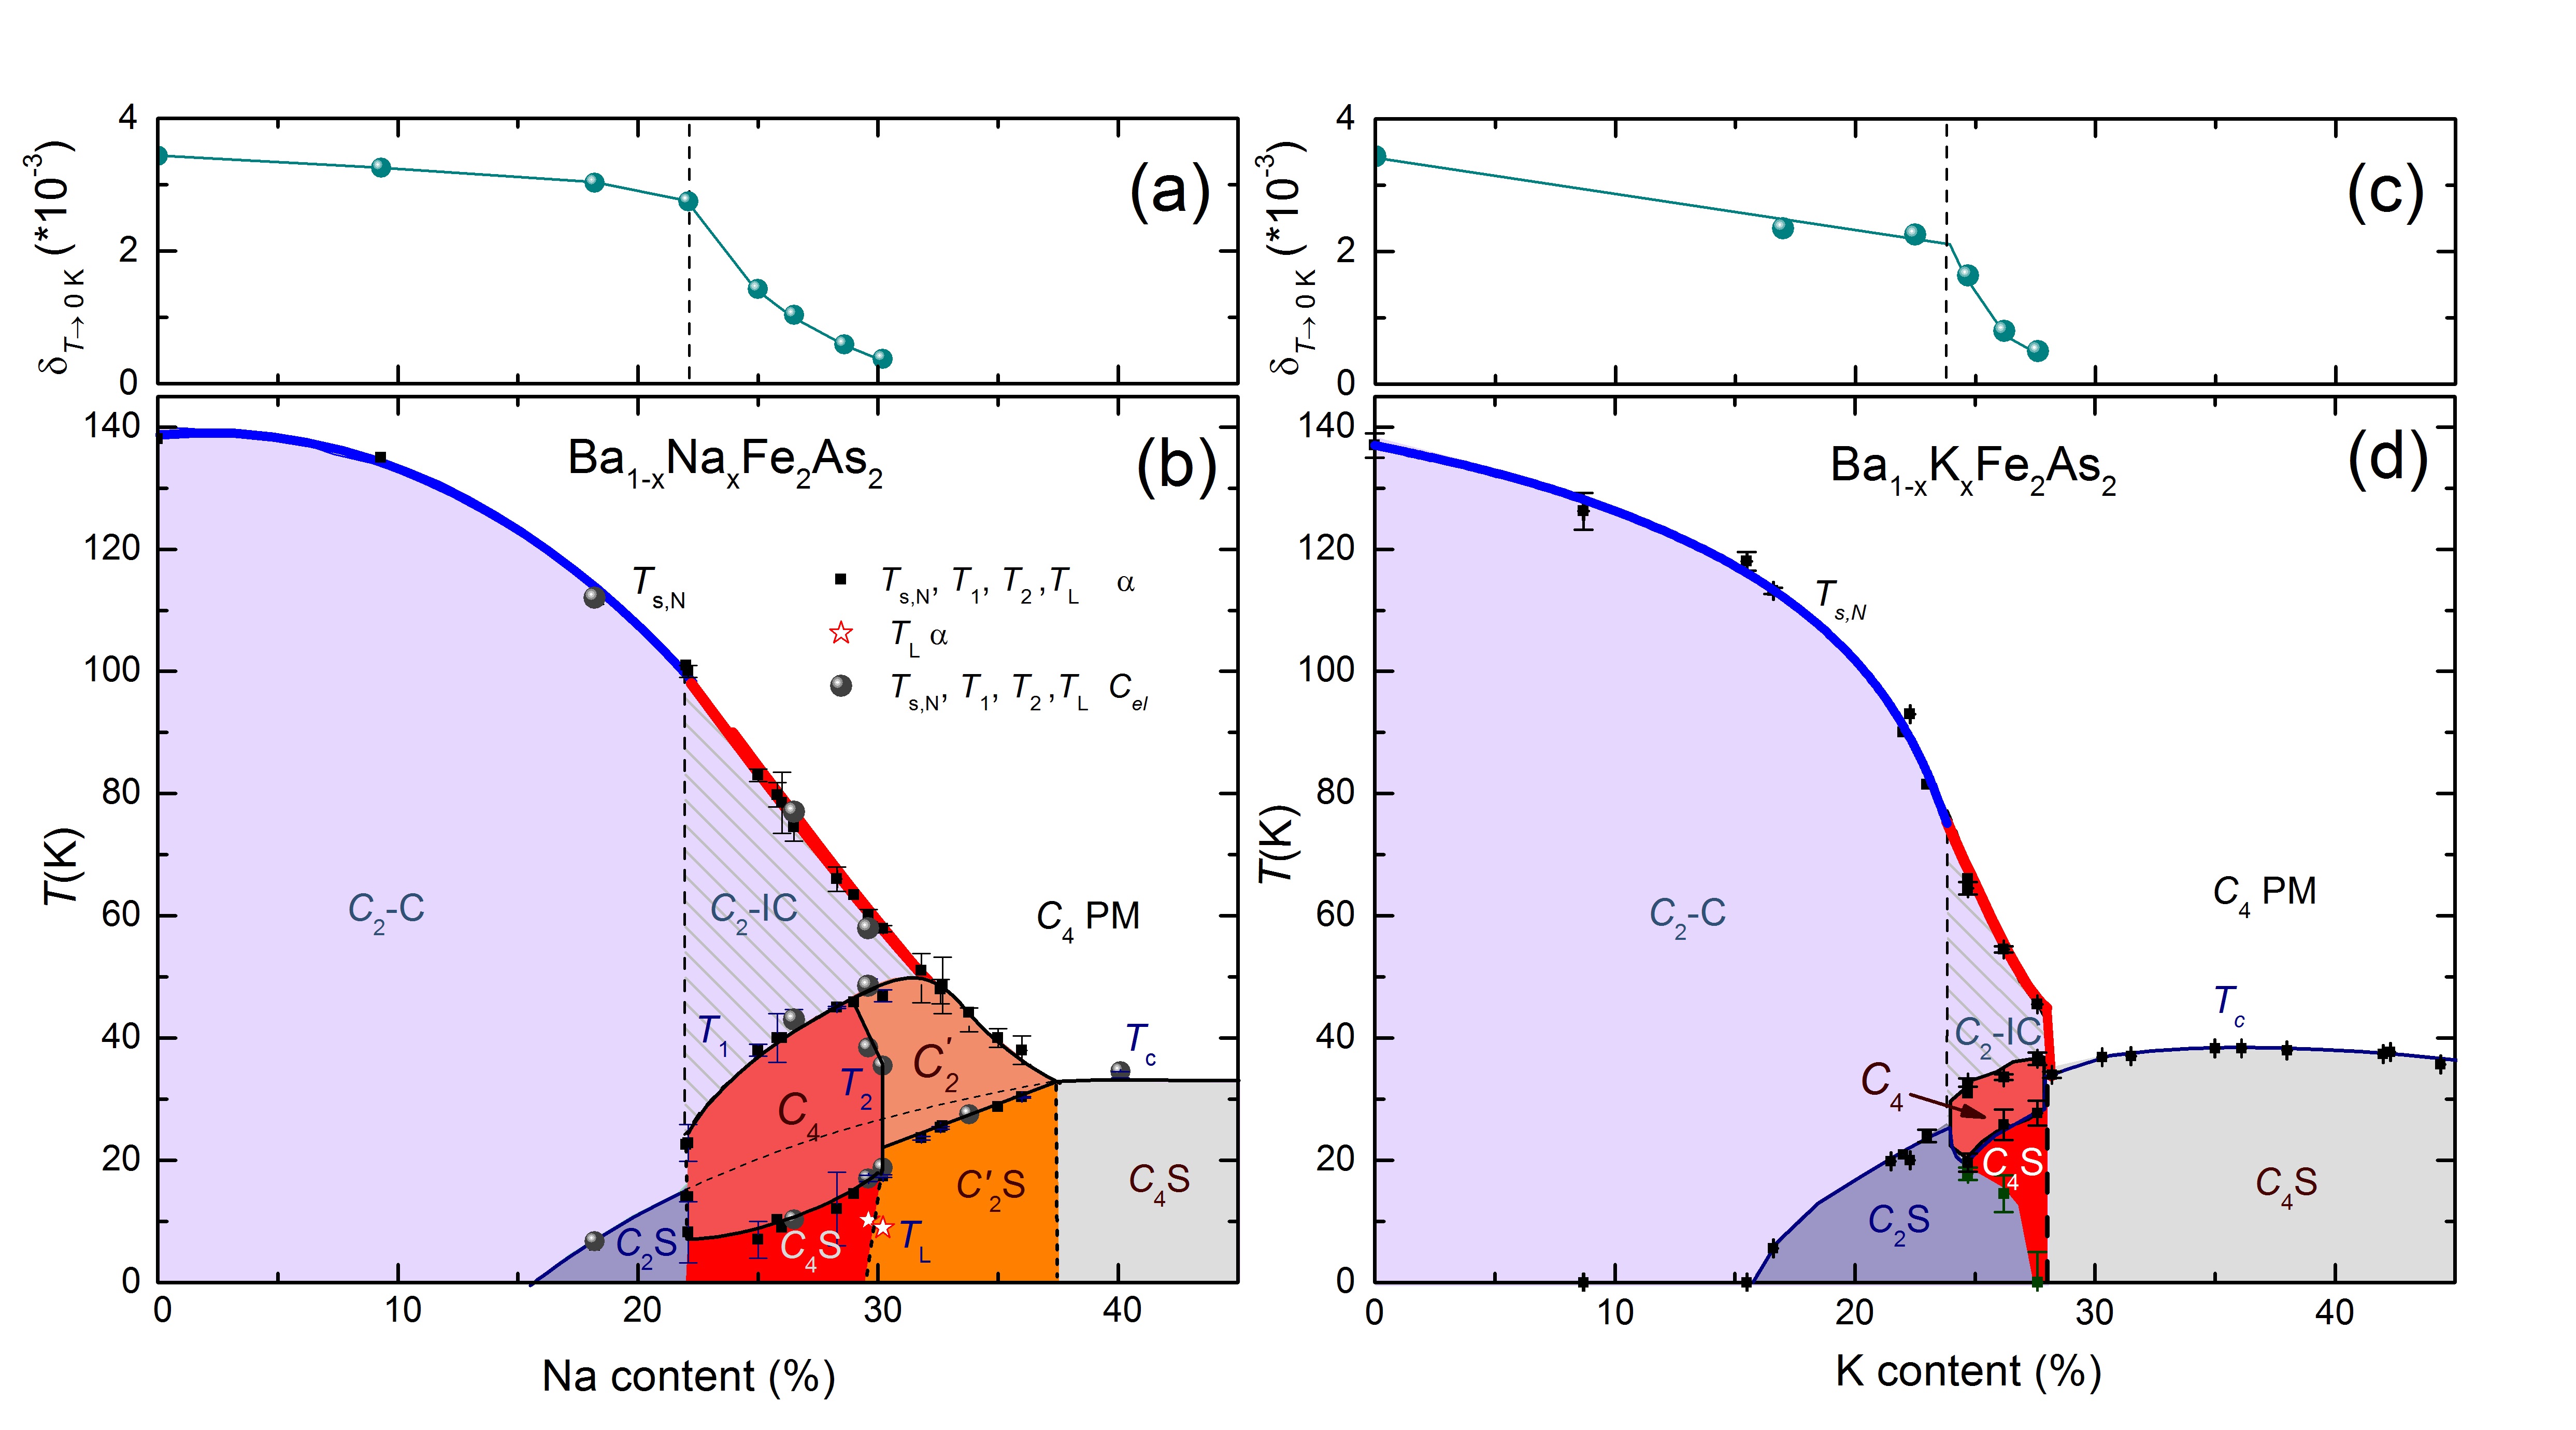
The transition temperatures , , , and obtained by the thermal -expansion data shown in Figs. 1 and 2 allow us to construct a detailed phase diagram (see Fig.3b). Here, we have also included the transition temperatures extracted from the heat-capacity data (see Fig.4). The phase diagram exhibits a remarkable degree of complexity, with a surprising number of additional (other than the usual -magnetic and superconductivity) phases emerging as magnetism is suppressed by Na doping. We note that these phases appear to emerge at the point where changes curvature from concave to convex near x = 0.22. This change is indicated by the changing color of the line from blue to red. The doping dependence of the extrapolated zero-temperature orthorhombic distortion of the phase (see Fig. 3a) illustrates this change even more clearly, with a very distinct kink near x = 0.22. We interpret the inflection point of (x) as a sign for a commensurate-to-incommensurate transition as expected in a simple mean-field SDW picture (Vorontsov et al., 2010; Rice, 1970; Kulikov and Tugushev, 1984). Previously, clear evidence for incommensurability has only been reported in electron doped BaFe2As2 (Pratt et al., 2011; Bonville et al., 2010; Luo et al., 2012). Since we do not observe a splitting of the line into two transitions above x = 0.22, we postulate the vertical dashed line to indicate the proposed commensurate-to-incommensurate transition. Such a vertical line implies a first-order transition, evidence of which is provided by the jumps of both and at x = 0.22. In Fig. 3c and d we compare the present results to those of K-doped BaFe2As2 (Böhmer et al., 2015b). Similar to the Na-doped system, we also find an inflection point in its phase diagram (see Fig. 3 d), as well as a kink in the T = 0 orthorhombic distortion (see Fig. 3c), at a K content at which the phase emerges (see Fig. 3c and d). This strongly suggests that these are both common features in hole doped BaFe2As2. In Ba1-xNaxFe2As2we observe, in addition to the magnetic phase, a previously unobserved phase (labeled ’ in Fig. 3 b), which has a reduced, but finite, orthorhombic distortion. A similar phase in not observed in the K-doped system. Although we can not examine the microscopic order in this phase using our macroscopic probes, the smooth doping variations of both and , suggest that this phase is probably also of magnetic origin, although some kind of charge (Gastiasoro and Andersen, 2015) order cannot be excluded. Preliminary μSR measurements on a crystal with x=0.33 provide evidence for a magnetic ’ phase (Mallet and Bernhard, ). Detailed investigations of the magnetic structure using e.g. neutron scattering are highly desirable once large enough crystals become available.
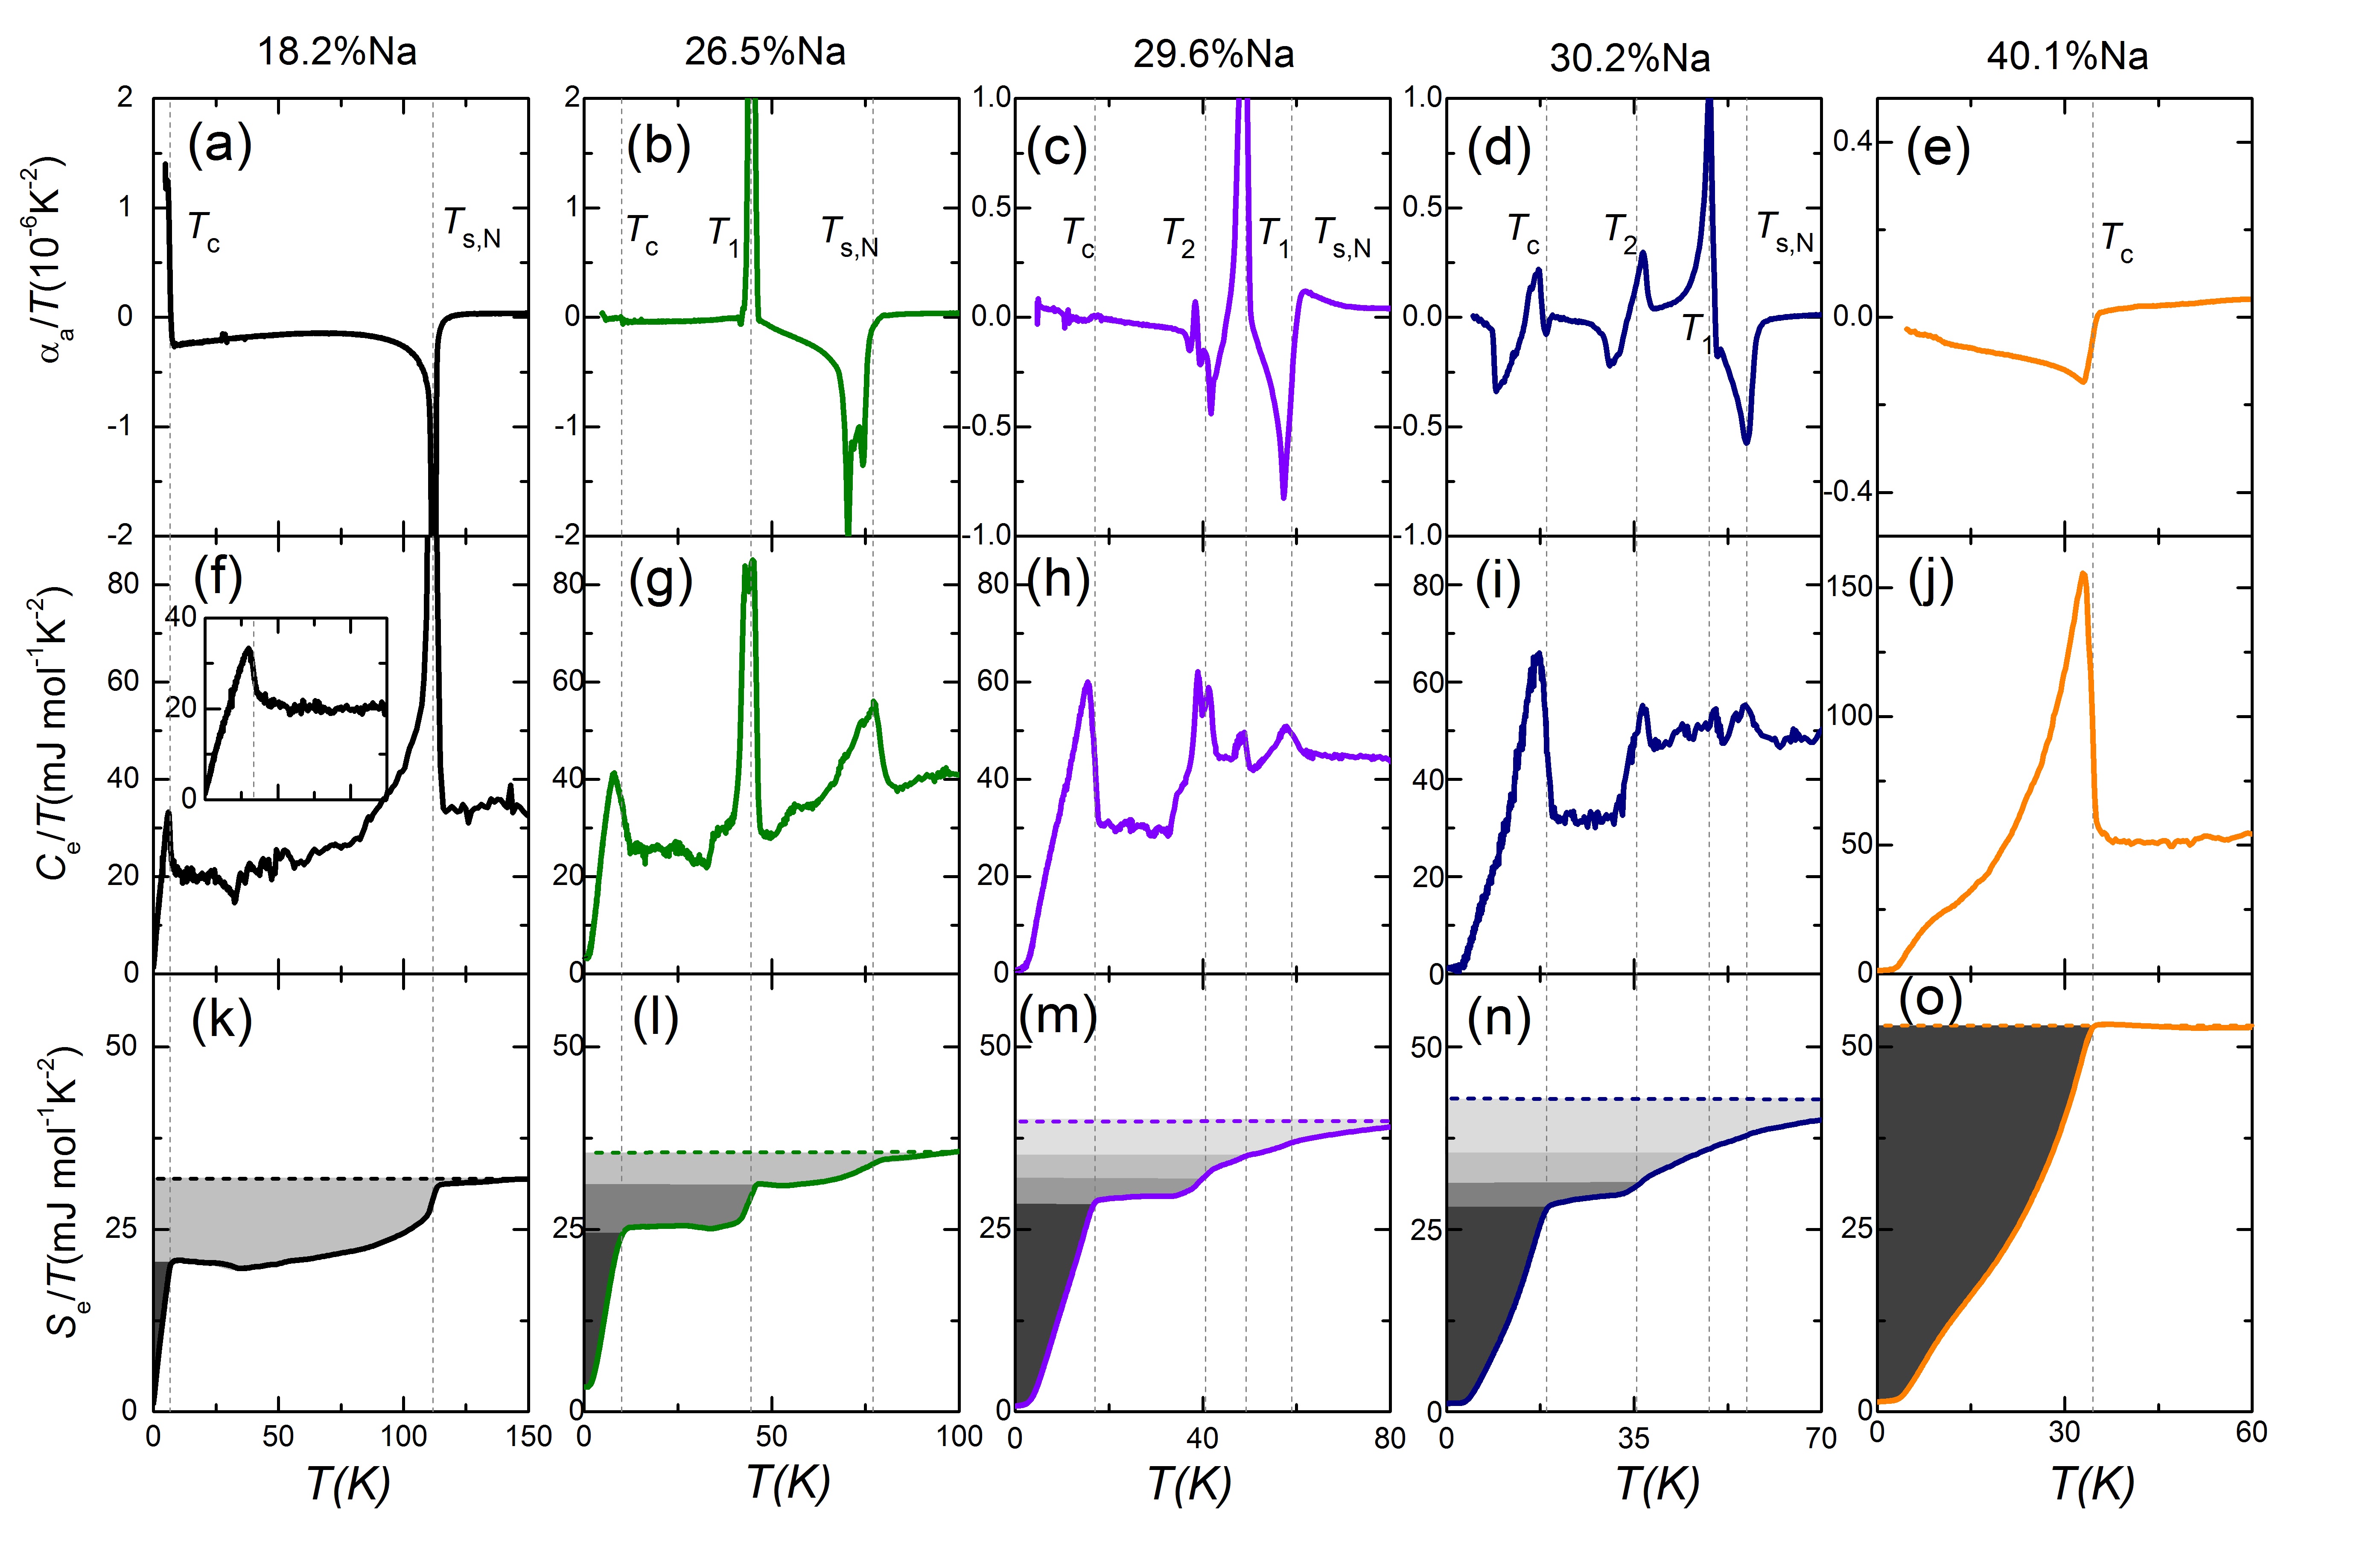
In order to gain more insight into the different phases, we present the electronic heat capacity for several Na concentrations in Fig.4 together with thermal expansion of the a-axis for comparison. As demonstrated in Fig. 3 and 4, the transition temperatures from the heat capacity (solid gray circles in Fig.3) closely match those from the thermal expansion. With increasing Na-doping the step-like anomalies in associated with superconductivity generally increase in size, whereas the anomalies associated with the magnetic transitions weaken, indicating the well-known competition between magnetism and superconductivity in the Fe-based systems (Nandi et al., 2010; Meingast et al., 2012; Böhmer et al., 2012, 2015b). This trend is made even more transparent in Fig.4 k-o, where we plot , i.e. the electronic entropy divided by T, which for a Fermi liquid is expected to be constant. Upon entering the phase at 45 K for the x = 0.265 Na sample we observe a particularly large additional reduction of at , which is more prominent than the anomaly at , and apparently results in a large suppression of and the condensation energy (equal to the black shaded area in Fig. 4 k)-o)) in the phase. This highlights the much stronger competition of superconductivity with the double-Q magnetic phase than with the usual magnetic phase, which was also observed in Ba1-xKxFe2As2 (Böhmer et al., 2015b). However, in contrast to Ba1-xKxFe2As2 (Böhmer et al., 2015b), we find no evidence for a reemergence of the usual stripe-type phase below . For the crystals with x = 0.296 and 0.302, the largest (non superconducting) anomalies in and occur not at , but rather upon entering the phase at . Interestingly, the plot for both these samples (Fig. 4 m and n) provide evidence for a pseudogap-like behavior above - i.e. a gradual loss of density-of-states as the temperature is lowered. The competition of superconductivity with the ’ phase appears to be much weaker than with the -magnetic phase, as evidenced by the increase of the superconducting condensation energy , as well as the rise of seen in Fig. 3 within the ’ phase. Finally, we note that the negligible residual values of all of our samples (except for x = 0.265) demonstrate that our samples are of high quality and that doping away from the FeAs layer does not introduce pair breaking, as it does in Co-doped BaFe2As2 (Hardy et al., 2010b).
In summary, our detailed thermodynamic studies of Ba1-xNaxFe2As2 show that the phase diagram of this system exhibits a surprising degree of complexity. As stripe-type magnetism is suppressed by Na-doping, two additional magnetic phases emerge, which coexist and compete with superconductivity. The emergence of these additional phases is shown to be possibly triggered by a doping-induced commensurate-incommensurate transition near x = 0.22, which would provide further evidence for electronic itinerancy in these systems. There are many similarities between the phase diagrams of K- and Na-doped BaFe2As2, and the differences are likely related to chemical pressure, since our previous studies on the K-doped system have shown that the phase boundaries are extremely pressure dependent (Böhmer et al., 2015b). Importantly, the presently observed complexity of these phase diagram suggests a high degree of degeneracy of several energy scales as the optimally-doped state is approached, which may also be related to the superconducting pairing mechanism.
We acknowledge fruitful discussions with Christian Bernhard, Markus Braden, Rafael Fernandes, Maria Gastiasoro, Benjamin Mallett, Jörg Schmalian, and Florian Waßer.
References
- Paglione and Greene (2010) J. Paglione and R. L. Greene, Nat. Phys. 6, 645 (2010).
- Johnston (2010) D. C. Johnston, Adv. Phys. 59, 803 (2010).
- Ishida et al. (2009) K. Ishida, Y. Nakai, and H. Hosono, J. Phys. Soc. Jpn. 78, 062001 (2009).
- Kontani et al. (2011) H. Kontani, T. Saito, and S. Onari, Phys. Rev. B 84, 024528 (2011).
- Fernandes and Schmalian (2012) R. M. Fernandes and J. Schmalian, Superconductor Science and Technology 25, 084005 (2012).
- Fernandes et al. (2014) R. M. Fernandes, A. V. Chubukov, and J. Schmalian, Nat. Phys. 10, 97 (2014).
- Böhmer et al. (2015a) A. E. Böhmer, T. Arai, F. Hardy, T. Hattori, T. Iye, T. Wolf, H. v Löhneysen, K. Ishida, and C. Meingast, Phys. Rev. Lett. 114, 027001 (2015a).
- Böhmer and Meingast (2015) A. E. Böhmer and C. Meingast, Comptes Rendus Physique (http://dx.doi.org/10.1016/j.crhy.2015.07.001) , (2015).
- Avci et al. (2014) S. Avci, O. Chmaissem, J. Allred, S. Rosenkranz, I. Eremin, A. Chubukov, D. Bugaris, D. Chung, M. Kanatzidis, J.-P. Castellan, J. Schlueter, H. Claus, D. Khalyavin, P. Manuel, A. Daoud-Aladine, and R. Osborn, Nat Commun 5, 3845 (2014).
- Böhmer et al. (2015b) A. E. Böhmer, F. Hardy, L. Wang, T. Wolf, P. Schweiss, and C. Meingast, Nat. Commun. 6, 7911 (2015b).
- Mallett et al. (2015) B. P. P. Mallett, P. Marsik, M. Yazdi-Rizi, T. Wolf, A. E. Böhmer, F. Hardy, C. Meingast, D. Munzar, and C. Bernhard, Phys. Rev. Lett. 115, 027003 (2015).
- Allred et al. (2015) J. M. Allred, K. M. Taddei, D. E. Bugaris, M. J. Krogstad, S. H. Lapidus, D. Y. Chung, H. Claus, M. G. Kanatzidis, D. E. Brown, J. Kang, R. M. Fernandes, I. Eremin, S. Rosenkranz, O. Chmaissem, and R. Osborn, ArXiv e-prints (2015), arXiv:1505.06175 [cond-mat.str-el] .
- Gastiasoro and Andersen (2015) M. N. Gastiasoro and B. M. Andersen, Phys. Rev. B 92, 140506 (2015).
- Waßer et al. (2015) F. Waßer, A. Schneidewind, Y. Sidis, S. Wurmehl, S. Aswartham, B. Büchner, and M. Braden, Phys. Rev. B 91, 060505 (2015).
- Kang et al. (2015) J. Kang, X. Wang, A. V. Chubukov, and R. M. Fernandes, Phys. Rev. B 91, 121104 (2015).
- Christensen et al. (2015) M. H. Christensen, J. Kang, B. M. Andersen, I. Eremin, and R. M. Fernandes, ArXiv e-prints (2015), arXiv:1508.01763 [cond-mat.supr-con] .
- Meingast et al. (1990) C. Meingast, B. Blank, H. Bürkle, B. Obst, T. Wolf, H. Wühl, V. Selvamanickam, and K. Salama, Phys. Rev. B 41, 11299 (1990).
- Hardy et al. (2010a) F. Hardy, T. Wolf, R. A. Fisher, R. Eder, P. Schweiss, P. Adelmann, H. v. Löhneysen, and C. Meingast, Phys. Rev. B 81, 060501 (2010a).
- Hardy et al. (2013) F. Hardy, R. Eder, M. Jackson, D. Aoki, C. Paulsen, T. Wolf, P. Burger, A. Boehmer, P. Schweiss, P. Adelmann, R. A. Fisher, and C. Meingast, J. Phys. Soc. Jpn. 83, 014711 (2013).
- (20) F. Hardy, (unpublished) .
- Qiu and White (2001) L. Y. Qiu and M. A. White, J. Chem. Edu. 78, 1076 (2001).
- Avci et al. (2013) S. Avci, J. M. Allred, O. Chmaissem, D. Y. Chung, S. Rosenkranz, J. A. Schlueter, H. Claus, A. Daoud-Aladine, D. D. Khalyavin, P. Manuel, A. Llobet, M. R. Suchomel, M. G. Kanatzidis, and R. Osborn, Phys. Rev. B 88, 094510 (2013).
- Böhmer et al. (2012) A. E. Böhmer, P. Burger, F. Hardy, T. Wolf, P. Schweiss, R. Fromknecht, H. v. Löhneysen, C. Meingast, H. K. Mak, R. Lortz, S. Kasahara, T. Terashima, T. Shibauchi, and Y. Matsuda, Phys. Rev. B 86, 094521 (2012).
- Nandi et al. (2010) S. Nandi, M. G. Kim, A. Kreyssig, R. M. Fernandes, D. K. Pratt, A. Thaler, N. Ni, S. L. Bud’ko, P. C. Canfield, J. Schmalian, R. J. McQueeney, and A. I. Goldman, Phys. Rev. Lett. 104, 057006 (2010).
- Meingast et al. (2012) C. Meingast, F. Hardy, R. Heid, P. Adelmann, A. Böhmer, P. Burger, D. Ernst, R. Fromknecht, P. Schweiss, and T. Wolf, Phys. Rev. Lett. 108, 177004 (2012).
- Vorontsov et al. (2010) A. B. Vorontsov, M. G. Vavilov, and A. V. Chubukov, Phys. Rev. B 81, 174538 (2010).
- Rice (1970) T. M. Rice, Phys. Rev. B 2, 3619 (1970).
- Kulikov and Tugushev (1984) N. I. Kulikov and V. V. Tugushev, Soviet Physics Uspekhi 27, 954 (1984).
- Pratt et al. (2011) D. K. Pratt, M. G. Kim, A. Kreyssig, Y. B. Lee, G. S. Tucker, A. Thaler, W. Tian, J. L. Zarestky, S. L. Bud’ko, P. C. Canfield, B. N. Harmon, A. I. Goldman, and R. J. McQueeney, Phys. Rev. Lett. 106, 257001 (2011).
- Bonville et al. (2010) P. Bonville, F. Rullier-Albenque, D. Colson, and A. Forget, Europhys. Lett. 89, 67008 (2010).
- Luo et al. (2012) H. Luo, R. Zhang, M. Laver, Z. Yamani, M. Wang, X. Lu, M. Wang, Y. Chen, S. Li, S. Chang, J. W. Lynn, and P. Dai, Phys. Rev. Lett. 108, 247002 (2012).
- (32) B. Mallet and C. Bernhard, (unpublished) .
- Hardy et al. (2010b) F. Hardy, P. Burger, T. Wolf, R. A. Fisher, P. Schweiss, P. Adelmann, R. Heid, R. Fromknecht, R. Eder, D. Ernst, H. v. Löhneysen, and C. Meingast, Europhys. Lett. 91, 47008 (2010b).