Large Magellanic Cloud Near-Infrared Synoptic Survey. II.
The Wesenheit relations and their application to the Distance scale
Abstract
We present new near-infrared Cepheid Period-Wesenheit relations in the LMC using time-series observations from the Large Magellanic Cloud Near-Infrared Synoptic Survey. We also derive opticalnear-infrared P-W relations using and magnitudes from OGLE-III. We employ our new data to determine an independent distance to the LMC of mag, using an absolute calibration of the Galactic relations based on several distance determination methods and accounting for the intrinsic scatter of each technique. We also derive new near-infrared Period-Luminosity and Wesenheit relations for Cepheids in M31 using observations from the PHAT survey. We use the absolute calibrations of the Galactic and LMC relations to determine the distance modulus of M31, mag. We apply a simultaneous fit to Cepheids in several Local Group galaxies covering a range of metallicities ( dex) to determine a global slope of - mag/dex for the relation and obtain robust distance estimates. Our distances are in good agreement with recent TRGB based distance estimates and we do not find any evidence for a metallicity dependence in the near-infrared P-W relations.
Subject headings:
stars: variables: Cepheids; galaxies: Magellanic Clouds; galaxies: Local Group; cosmology: distance scale1. Introduction
Studies of Cepheid variables are of considerable interest in determining distances to star-forming galaxies out to Mpc because these pulsating stars obey the well known Period-Luminosity relation or Leavitt Law (Leavitt & Pickering, 1912) and hence can be used as standard candles. In the era of precision cosmology, Cepheids play an important role in the cosmic distance scale and are vital in establishing an increasingly more accurate and precise value of the Hubble constant (Riess et al., 2009, 2011). In the recent past, many studies have used classical Cepheids as standard candles for cosmic distance scale work through the Period-Luminosity (P-L) and Period-Luminosity-Color (PLC) relations (Bono et al., 1999; Tammann et al., 2003; Kanbur et al., 2003; Sandage et al., 2004a; Persson et al., 2004; Benedict et al., 2007; Sandage et al., 2009). Most of these studies involve the calibration of P-L relations for the Galaxy and LMC at optical wavelengths. Some authors assume that the Galactic and LMC P-L relations have similar slopes (Fouqué et al., 2007; Monson et al., 2012). However, the universality of Cepheid P-L relation is a subject of intense debate as the metallicity and extinction effects might change the slope as well as the intercept of the P-L relation (Gieren et al., 2006b; Storm et al., 2011) and therefore lead to biases in distance determinations.
Near-infrared (NIR) Cepheid P-L relations acquire a greater significance because these are less susceptible to reddening and metallicity differences between target and calibrating galaxies (Storm et al., 2011; Monson et al., 2012). Another possible reason for discrepancy in Cepheid-based distance estimates is the significant non-linearities at various periods during the different phases of pulsation at optical wavelengths (Ngeow & Kanbur, 2006b; Bhardwaj et al., 2014). These non-linearities are also observed for mean light P-L relations at optical bands but are expected to be less significant at NIR wavelengths (Bono et al., 1999; Madore & Freedman, 2009).
The calibration of Galactic Cepheid P-L relations at optical and NIR bands has been carried out using parallaxes for small samples of variables (Tammann et al., 2003; Ngeow & Kanbur, 2004; Benedict et al., 2007; Fouqué et al., 2007; Turner, 2010; Storm et al., 2011). For example, Benedict et al. (2007) used highly accurate trigonometric parallaxes from the Hubble Space Telescope (HST) for 10 Cepheids. The major problem in obtaining solid calibrations within our Galaxy is that accurate distance determinations are only possible for nearby objects ( pc with HST/FGS, recently extended to kpc with a “spatial scanning technique” by Riess et al., 2014). The most important fundamental distance measurements come from trigonometric parallaxes. The Hipparcos/Tycho catalogues of parallaxes for Classical Cepheids gave a strong impetus to this field (Perryman, 1997; Van Leeuwen et al., 2007). Cepheid distances have also been measured to high precision by the Infrared Surface Brightness technique and Baade-Wesselink methods, where Cepheid pulsation is directly measured with a long-baseline interferometer (Gieren et al., 1998; Storm et al., 2011; Groenewegen, 2013).
Recently, a detailed study on Period-Wesenheit (P-W) relations in the NIR bands was carried out to determine distances to the Magellanic Clouds by Inno et al. (2013). The reddening-free Wesenheit function (Madore, 1982) in the optical bands was also used to derive distances to individual Galactic Cepheids (Ngeow, 2012). The author calibrated the P-L relations at both optical and infrared wavelengths and used these to determine a distance modulus to the LMC. At NIR wavelengths, Persson et al. (2004) derived the P-L relations for Cepheids in the LMC having full phased light curve data and determined the distance modulus to the LMC using Galactic calibrations from the literature.
Determining a robust distance to the LMC is an important step in the cosmic distance scale. Recently, Pietrzyński et al. (2013) used a sample of 8 eclipsing binaries to obtain a 2.2% accurate distance to the LMC of (equivalent to mag). One of the motivations for our work is to provide an independent determination of the LMC distance modulus by applying a Galactic calibration to data from the Large Magellanic Cloud NIR Synoptic Survey (LMCNISS) (Macri et al., 2015, hereafter Paper I). We also extend the distance determination to M31 using recent observations for Cepheids from the PHAT survey (Wagner-Kaiser et al., 2015). Our work also provides a test for the metallicity dependence of Cepheid based distance estimates, considering the fact that Local Group galaxies have a large metallicity range ( dex). Further, this work will be especially important in light of the impending launch of the James Webb Space Telescope (JWST) in a few years, when space-based observations of Cepheids will be exclusively available in the infrared bands. A robust absolute calibration of the NIR P-L relations for Cepheids in the Milky Way and LMC will play an important role in the cosmic distance scale.
This paper, the second in a series, is structured as follows. In Section 2, we present the absolute P-W relations for Cepheids in the LMC using data from Paper I. We determine the robust distance to the LMC using absolute calibration of the Galactic Cepheid P-L and P-W relations (§3). We also derive the P-L and P-W relations for M31 using the observations from the PHAT survey (Dalcanton et al., 2012; Williams et al., 2014) in Section 4. Finally, we use Galactic and LMC calibrations to determine metal-independent robust distances to Local Group galaxies (§5). Further discussion of the results and important conclusions of our study are presented in Section 6.
2. NIR Period-Wesenheit Relations for the LMC Cepheids
2.1. Photometric mean magnitudes
We make use of NIR mean magnitudes for 789 fundamental-mode and 475 first-overtone Cepheids in the LMC from Paper I. These magnitudes are based on observations from a synoptic survey (average of 16 epochs) of the central region of the LMC using the CPAPIR camera at the Cerro Tololo Interamerican Observatory (CTIO) 1.5-m telescope between 2006 and 2007. Most of these Cepheid variables were previously studied in the optical and bands by the third phase of Optical Gravitational Lensing Experiment (OGLE-III) survey (Soszynski et al., 2008; Ulaczyk et al., 2013). The and band mean magnitudes are also compiled in Paper I. The calibration into the 2MASS photometric system, extinction corrections and the adopted reddening law are discussed in detail in Paper I.
2.2. Absolute Calibration of NIR P-W Relations
We derive new NIR and optical+NIR P-W relations for fundamental and first-overtone mode Cepheids using LMCNISS and OGLE data. We note that Paper I presents only the P-L relations; therefore, it is important to derive P-W relations for their application to the distance scale. Moreover, we also emphasize that this large homogeneous data set in the bands for Cepheids in the LMC are based on time-series observations as opposed to single-phase as in earlier studies. We modify the definition of the Wesenheit function relative to Inno et al. (2013) as:
| (1) | |||||
where represents the mean magnitude at wavelength and . For simplicity, the superscript is dropped from when . We adopt the reddening law given in Cardelli et al. (1989) and assume a value of to obtain selective absorption ratios AI/AV = 0.610, AJ/AV = 0.292, AH/AV = 0.181, & A/AV = 0.119 (Fouqué et al., 2007; Inno et al., 2013). The resulting Wesenheit relations studied in this work are listed in Table 1.
| Label | |||
|---|---|---|---|
| WJ,H | H | 1.63 | J-H |
| W | Ks | 0.69 | J-Ks |
| W | Ks | 1.92 | H-Ks |
| WV,J | J | 0.41 | V-J |
| WV,H | H | 0.22 | V-H |
| W | Ks | 0.13 | V-Ks |
| WI,J | J | 0.92 | I-J |
| WI,H | H | 0.42 | I-H |
| W | Ks | 0.24 | I-Ks |
| W | H | 0.41 | V-I |
| Star ID | Type | |||||||||||
|---|---|---|---|---|---|---|---|---|---|---|---|---|
| 0477 | FO | 0.292 | 13.922 | 14.238 | 14.471 | 14.732 | 14.820 | 14.407 | 14.853 | 14.351 | 14.403 | 14.397 |
| 0.132 | 0.085 | 0.173 | 0.058 | 0.053 | 0.065 | 0.082 | 0.062 | 0.067 | 0.061 | |||
| 0478 | FU | 0.442 | 14.124 | 14.354 | 14.523 | 14.497 | 14.649 | 14.408 | 14.533 | 14.314 | 14.404 | 14.371 |
| 0.167 | 0.102 | 0.219 | 0.064 | 0.059 | 0.079 | 0.089 | 0.082 | 0.081 | 0.079 | |||
| 0482 | FU | 0.873 | 12.520 | 12.820 | 13.042 | 13.296 | 13.494 | 12.988 | 13.386 | 12.921 | 12.974 | 13.006 |
| 0.142 | 0.066 | 0.088 | 0.088 | 0.080 | 0.031 | 0.117 | 0.040 | 0.033 | 0.042 | |||
| 0487 | FU | 0.493 | 13.930 | 14.093 | 14.215 | 14.528 | 14.663 | 14.244 | 14.590 | 14.235 | 14.228 | 14.305 |
| 0.212 | 0.139 | 0.212 | 0.132 | 0.122 | 0.092 | 0.171 | 0.049 | 0.094 | 0.050 | |||
| 0488 | FU | 0.562 | 13.805 | 14.088 | 14.296 | 14.271 | 14.484 | 14.158 | 14.349 | 14.057 | 14.160 | 14.102 |
| 0.104 | 0.085 | 0.169 | 0.044 | 0.039 | 0.068 | 0.067 | 0.053 | 0.070 | 0.054 |
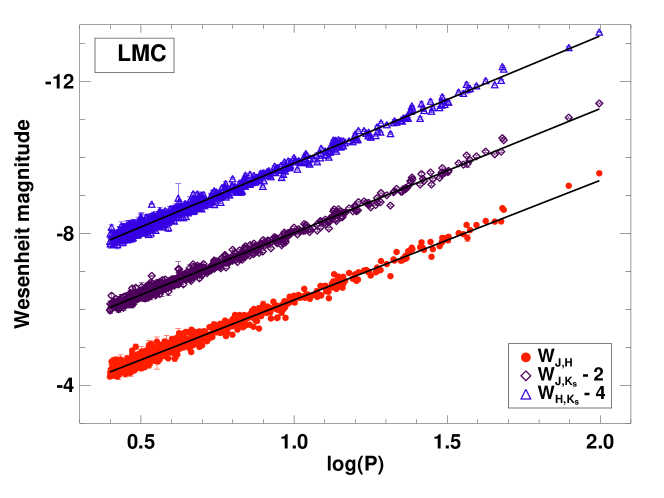
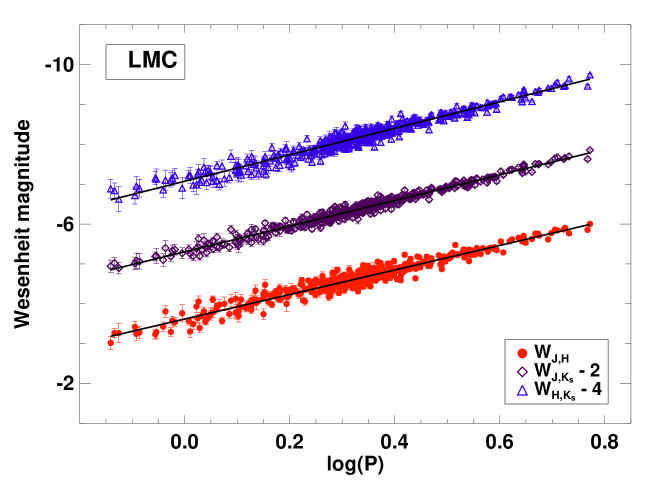
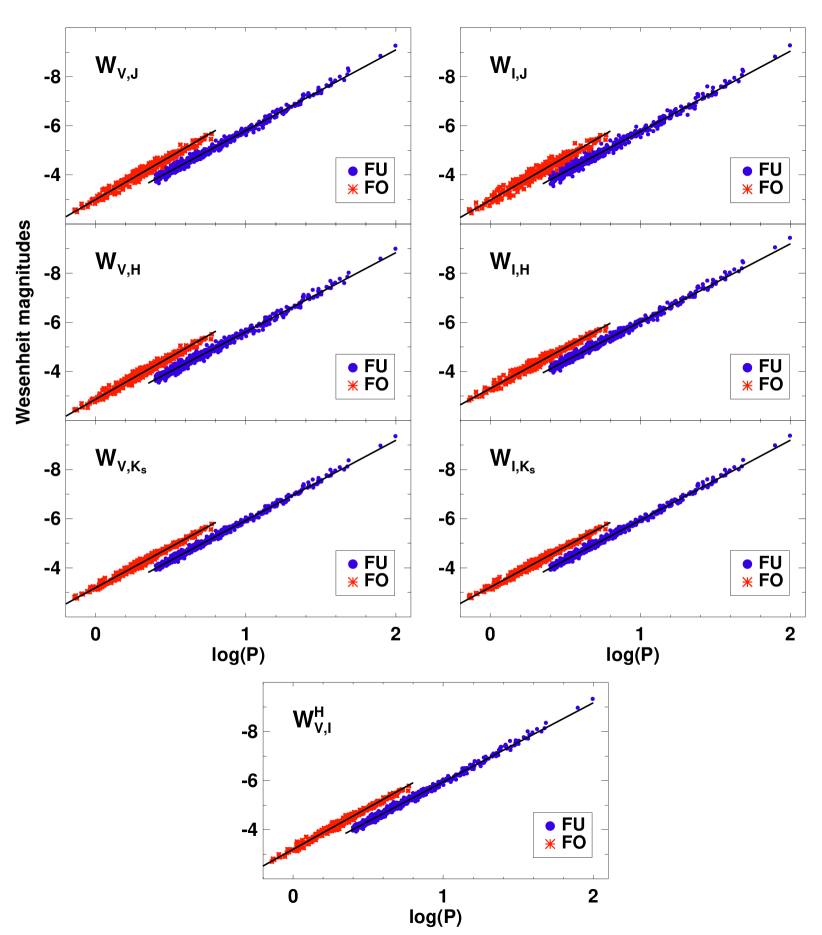
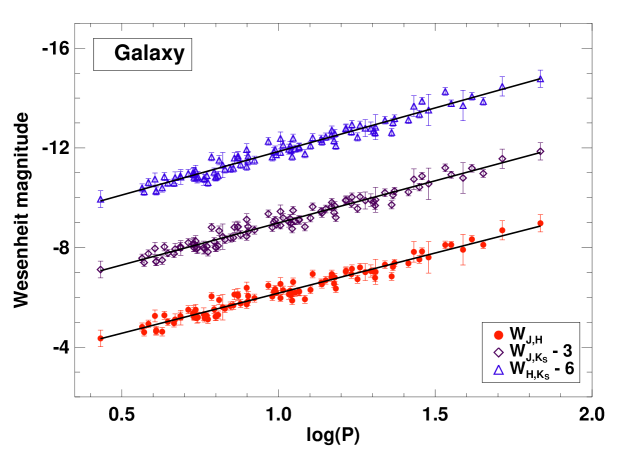
The Wesenheit magnitudes are given in Table 2, together with their propagated uncertainties. For the NIR relations, we use the final sample of Cepheids from Paper I, since sigma-clipping was already applied in that work. Following Paper I, we calibrate these Wesenheit magnitudes using the highly accurate LMC distance from Pietrzyński et al. (2013). The calibrated Wesenheit magnitudes for fundamental and first-overtone mode Cepheids are plotted separately against to fit a P-W relation in the form of . The results for the fundamental and first-overtone mode Cepheids in the LMC are shown in Figs. 1 and 2, respectively. In the case of optical+NIR Wesenheit relations, we apply clipping to the magnitudes before fitting a P-W relation. The optical+NIR P-W relations for fundamental and first-overtone Cepheids are shown in Fig. 3, with the derived parameters given in Table 3. We also include a calibration of the relation, which is the primary method used by the SH0ES project (Riess et al., 2009, 2011) to determine Cepheid distances to SNe Ia hosts and ultimately estimate the Hubble constant.
We also provide the P-L relations from Paper I in Table 3 for relative comparison with the P-W relations and the Galactic P-L relations in the next sections. Previously, the largest set of full phased light curve data used in the calibration of the NIR P-L and P-W relations consisted of a sample of only 92 stars from Persson et al. (2004). However, this data set includes a larger number of stars with periods between days which were used in the Paper I and this analysis for the determination of the NIR P-L and P-W relations, respectively. We also list in Table 3 the LMC P-L relation and the P-W relation derived by Ripepi et al. (2012) based on data from the VISTA survey of the Magellanic Clouds System (VMC).
The reddening-free Wesenheit relations are expected to have a smaller dispersion than the corresponding P-L relations. We note from Table 3 that the P-L relations for fundamental-mode Cepheids in and show a dispersion (0.125 and 0.103 mag) slightly greater than Ks (0.09 mag). For Wesenheit relations, this dispersion reduces significantly in and as compared to and . In the case of , the dispersion increases relatively as compared to the Ks, presumably due to an insignificant contribution from the colour () term. For first-overtone Cepheids, relation has the smallest dispersion as compared to dispersion in , and (0.134, 0.100 and 0.086) P-L relations. Similarly, the and Wesenheit also show smaller dispersions similar to fundamental mode P-L relations. These P-W relations play a vital role in determining reddening independent accurate distances (Inno et al., 2013).
| Slope | Intercept | N | Src | Slope | Intercept | ||||
|---|---|---|---|---|---|---|---|---|---|
| fundamental-mode | |||||||||
| -3.1400.004 | -5.3080.051 | 0.125 | 789 | M15 | — | — | — | — | |
| -3.1690.004 | -5.6740.053 | 0.103 | 789 | M15 | — | — | — | — | |
| -3.2280.004 | -5.7370.048 | 0.090 | 789 | M15 | — | — | — | — | |
| -3.2950.018 | -5.7180.051 | 0.102 | 256 | R12 | 3.96 | 0.00 | 0.28 | 0.78 | |
| -3.1540.014 | -6.2480.049 | 0.108 | 789 | TW | — | — | — | — | |
| -3.3730.008 | -6.2360.048 | 0.080 | 1701 | I13 | 14.89 | 0.00 | 0.18 | 0.86 | |
| -3.2720.011 | -6.0200.049 | 0.078 | 789 | TW | — | — | — | — | |
| -3.3650.008 | -5.9820.048 | 0.080 | 1708 | I13 | 6.78 | 0.00 | 0.55 | 0.58 | |
| -3.3580.013 | -5.8510.049 | 0.101 | 789 | TW | — | — | — | — | |
| -3.3600.010 | -5.7950.048 | 0.100 | 1709 | I13 | 0.12 | 0.90 | 0.81 | 0.42 | |
| -3.3030.012 | -5.8150.049 | 0.092 | 708 | TW | — | — | — | — | |
| -3.2720.009 | -5.7870.048 | 0.080 | 1732 | I13 | 2.15 | 0.03 | 0.42 | 0.68 | |
| -3.2390.013 | -5.6180.049 | 0.095 | 711 | TW | — | — | — | — | |
| -3.3150.008 | -5.9920.048 | 0.070 | 1730 | I13 | 5.46 | 0.00 | 5.56 | 0.00 | |
| -3.2840.010 | -5.9430.049 | 0.073 | 709 | TW | — | — | — | — | |
| -3.3260.008 | -5.9180.048 | 0.070 | 1737 | I13 | 3.32 | 0.00 | 0.37 | 0.71 | |
| -3.3250.014 | -5.9480.050 | 0.078 | 256 | R12 | 2.44 | 0.01 | 0.07 | 0.94 | |
| -3.2900.016 | -5.7740.049 | 0.115 | 715 | TW | — | — | — | — | |
| -3.2430.011 | -5.7340.049 | 0.100 | 1735 | I13 | 2.53 | 0.01 | 0.59 | 0.56 | |
| -3.2260.012 | -6.0270.049 | 0.088 | 711 | TW | — | — | — | — | |
| -3.3170.008 | -6.0090.048 | 0.080 | 1734 | I13 | 6.53 | 0.00 | 0.27 | 0.79 | |
| -3.2810.010 | -5.9520.049 | 0.076 | 710 | TW | — | — | — | — | |
| -3.3250.008 | -5.9160.048 | 0.070 | 1737 | I13 | 3.52 | 0.00 | 0.53 | 0.59 | |
| W | -3.2490.010 | -5.9580.048 | 0.076 | 710 | TW | — | — | — | — |
| first-overtone mode | |||||||||
| -3.2970.020 | -6.9860.050 | 0.134 | 475 | M15 | — | — | — | — | |
| -3.2150.020 | -6.2520.050 | 0.100 | 475 | M15 | — | — | — | — | |
| -3.2450.023 | -6.3040.050 | 0.086 | 475 | M15 | — | — | — | — | |
| -3.4710.035 | -6.3840.049 | 0.099 | 256 | R12 | 5.62 | 0.00 | 1.15 | 0.25 | |
| -3.0750.035 | -6.6920.050 | 0.118 | 475 | TW | — | — | — | — | |
| -3.5070.015 | -6.7930.048 | 0.090 | 1064 | I13 | 12.76 | 0.00 | 1.49 | 0.14 | |
| -3.2160.024 | -6.5200.049 | 0.082 | 475 | TW | — | — | — | — | |
| -3.4710.013 | -6.5940.048 | 0.080 | 1057 | I13 | 9.45 | 0.00 | 1.08 | 0.28 | |
| -3.3190.035 | -6.3930.050 | 0.119 | 475 | TW | — | — | — | — | |
| -3.4250.017 | -6.4350.049 | 0.100 | 1063 | I13 | 2.94 | 0.00 | 0.62 | 0.54 | |
| -3.4360.029 | -6.4570.049 | 0.095 | 422 | TW | — | — | — | — | |
| -3.4340.014 | -6.4520.048 | 0.100 | 1086 | I13 | 0.06 | 0.95 | 0.07 | 0.94 | |
| -3.3900.028 | -6.2750.049 | 0.093 | 421 | TW | — | — | — | — | |
| -3.4850.011 | -6.6210.048 | 0.080 | 1071 | I13 | 3.42 | 0.00 | 5.16 | 0.00 | |
| -3.2930.021 | -6.4930.049 | 0.071 | 421 | TW | — | — | — | — | |
| -3.4560.013 | -6.5390.048 | 0.070 | 1061 | I13 | 6.64 | 0.00 | 0.67 | 0.50 | |
| -3.5300.025 | -6.6230.049 | 0.070 | 256 | R12 | 7.24 | 0.00 | 1.89 | 0.06 | |
| -3.4330.036 | -6.4250.050 | 0.118 | 420 | TW | — | — | — | — | |
| -3.4230.020 | -6.4170.048 | 0.130 | 1100 | I13 | 0.23 | 0.82 | 0.11 | 0.91 | |
| -3.2540.026 | -6.5730.049 | 0.086 | 422 | TW | — | — | — | — | |
| -3.4890.012 | -6.6310.048 | 0.080 | 1072 | I13 | 8.52 | 0.00 | 0.86 | 0.39 | |
| -3.2790.021 | -6.4930.049 | 0.074 | 420 | TW | — | — | — | — | |
| -3.4480.013 | -6.5390.048 | 0.080 | 1059 | I13 | 6.60 | 0.00 | 0.66 | 0.51 | |
| W | -3.3130.021 | -6.5330.050 | 0.070 | 421 | TW | — | — | — | — |
| Star | Source | Magnitudes () | |||||||
|---|---|---|---|---|---|---|---|---|---|
| ID | (days) | ||||||||
| AK CEP | MP | 7.233 | 8.408 | 7.888 | 7.741 | 0.022 | 0.024 | 0.025 | 0.635 |
| AN AUR | MP | 10.291 | 7.934 | 7.436 | 7.275 | 0.022 | 0.024 | 0.026 | 0.600 |
| AQ PUP | LS | 30.104 | 6.001 | 5.491 | 5.308 | 0.023 | 0.021 | 0.022 | 0.531 |
| AW PER | MP | 6.464 | 5.229 | 4.822 | 4.697 | 0.022 | 0.024 | 0.025 | 0.487 |
| BB SGR | LS | 6.637 | 5.053 | 4.641 | 4.512 | 0.045 | 0.021 | 0.022 | 0.276 |
2.3. Comparison with published LMC P-L and P-W relations
We also compare our P-W relations in the LMC with Ripepi et al. (2012) and Inno et al. (2013). We use a standard -test to check the consistency of the slopes and intercepts of our P-L and P-W relations with published work. Under the null hypothesis that the two slopes are equivalent, the T-values are calculated by incorporating errors on the slopes and the standard deviation. The theoretical values are evaluated from the -distribution, where we adopt the significance level of and with and being the number of Cepheids in the two samples. The probability () of the observed t-statistic () under the null hypothesis is listed in Table 3. The theoretical t-value, at a fixed , varies marginally (1.96 - 1.98) for a wide range of (100 - 3000) used in our calculations and therefore, is not tabulated. The null hypothesis is rejected if or i.e. the slopes or zero-points are not equal.
We find that the slope of our -band P-L relation for fundamental and first-overtone mode Cepheids is not consistent with the slope of the P-L relation from the VMC survey (Ripepi et al., 2012). However, the intercepts are statistically consistent between these two studies. Our slopes for the fundamental-mode NIR P-W relations are statistically different from those of Inno et al. (2013) in and , while being consistent in . Similarly, the slopes for all optical+NIR P-W relations are not consistent with the results of Inno et al. (2013). In the case of the first-overtone mode Cepheids, the slope of the NIR P-W relations from this study are significantly different from the results of Inno et al. (2013), while for the optical+NIR P-W relations, only the and P-W relations have similar slopes. However, the intercepts of most P-W relations for both fundamental and first-overtone mode Cepheids are in good agreement, given their uncertainties. The t-test also suggests that the zero-points of our relations are statistically consistent with previously published results, except in case of . The possible reason for inconsistency in slopes may be due to significantly different sample sizes and different photometric calibrations. Moreover, the mean magnitudes in Inno et al. (2013) are obtained from a template fit to single-epoch magnitudes for fundamental-mode Cepheids, while random-phase magnitudes are used for first-overtone Cepheids. Therefore, we emphasize that all our results are based on mean magnitudes from well-sampled light curves.
3. An Independent Distance to the LMC using Galactic P-L and P-W Relations
A precise determination of the distance to the LMC is essential to estimate a value of Hubble constant with a total uncertainty below 2% (Riess et al., 2009, 2011). We aim to determine an independent and robust distance to the LMC using Cepheids as standard candles, following the work of Pietrzyński et al. (2013) based on long-period, late-type eclipsing binaries. The Wesenheit and magnitudes from this work and Paper I, respectively, can also be used to obtain an independent estimate of distance to the LMC. An additional feature of this approach is the use of mean magnitudes based on full phased NIR light curves in the target galaxy (the LMC) as opposed to corrected single-epoch observations. However, this requires an absolute calibration of the P-L and P-W relations in the Galaxy. Previous Galactic P-L relations vary significantly in slope and zeropoint, leading to differences of more than in the inferred LMC distance. A detailed comparison of distance estimates to the LMC using published Galactic P-L relations is provided in appendix A. Therefore, we re-analysed the available data in the literature to provide a new robust absolute calibration of the Galactic relations, as explained in the following subsections.
3.1. Absolute Calibration of NIR Galactic Relations
We make use of light curve data for 113 Galactic Cepheids in the bands from the literature (Welch et al., 1984; Laney & Stobie, 1992; Barnes et al., 1997; Monson & Pierce, 2011) for which independent distances are available. The light curve data for these Cepheids along with their Fourier analysis is discussed in detail in Bhardwaj et al. (2015). The mean magnitudes obtained using the optimum-order Fourier fit (Baart, 1982; Bhardwaj et al., 2015) along with their errors are listed in Table 4. We compare the Fourier-fitted mean magnitudes with values from the literature and the difference between two sets do not exceed mag. Since the NIR light curve data compiled from various sources are in different photometric systems, we converted these mean magnitudes to the 2MASS photometric system using the standard colour transformations111$http://www.ipac.caltech.edu/2mass/releases/allsky/doc/sec6_4b.html$. This transformation led to an average change in color of mag. In order to obtain reddening-corrected mean magnitudes in all the three bands, colour excess for Galactic Cepheids are adopted from Tammann et al. (2003). We adopt the Cardelli et al. (1989) reddening law as discussed previously and use the absorption ratios to determine RJ = 0.94, RH = 0.58 and RK = 0.38. We adopt an uncertainty in the color excess equal to the difference between two independent determinations of for all of these Cepheids, mag (Fernie et al., 1995), and propagate this uncertainty into the errors in mean magnitudes using equations given in Tammann et al. (2003).
| Star ID | IRSB | (IRSB) | MS | (MS) | BW | (BW) | HST- | (HST-) | W.M. () | |
|---|---|---|---|---|---|---|---|---|---|---|
| AK CEP | — | — | — | — | 13.03 | 0.20 | — | — | 13.03 | 0.20 |
| AN AUR | — | — | — | — | 13.62 | 0.22 | — | — | 13.62 | 0.22 |
| AQ PUP | 12.53 | 0.04 | 11.78 | 0.10 | 12.38 | 0.06 | — | — | 12.40 | 0.63 |
| AW PER | — | — | — | — | 9.94 | 0.18 | — | — | 9.94 | 0.18 |
| BB SGR | 9.69 | 0.03 | 9.08 | 0.08 | 9.55 | 0.07 | — | — | 9.58 | 0.51 |

| Star | Absolute magnitudes | (Absolute mag.) | F1 | Wesenheit magnitudes | (Wesenheit mag.) | F2 | |||||||||
|---|---|---|---|---|---|---|---|---|---|---|---|---|---|---|---|
| ID | - | MJ | MH | MK | MJ | MH | MK | - | - | ||||||
| AK CEP | 0.859 | -5.223 | -5.561 | -5.573 | 0.201 | 0.201 | 0.201 | Y | -6.112 | -5.814 | -5.596 | 0.208 | 0.202 | 0.210 | Y |
| AN AUR | 1.012 | -6.254 | -6.529 | -6.615 | 0.221 | 0.222 | 0.221 | N | -6.978 | -6.864 | -6.780 | 0.229 | 0.222 | 0.231 | N |
| AQ PUP | 1.479 | -6.955 | -7.201 | -7.312 | 0.630 | 0.630 | 0.630 | Y | -7.604 | -7.558 | -7.524 | 0.631 | 0.630 | 0.631 | Y |
| AW PER | 0.810 | -5.181 | -5.452 | -5.471 | 0.181 | 0.181 | 0.181 | Y | -5.893 | -5.671 | -5.508 | 0.189 | 0.183 | 0.191 | Y |
| BB SGR | 0.822 | -4.837 | -5.128 | -5.190 | 0.510 | 0.510 | 0.510 | Y | -5.603 | -5.434 | -5.310 | 0.511 | 0.510 | 0.512 | Y |
We compiled distances from various distance determination methods to calibrate the P-L and P-W relations for Galactic Cepheids: Hubble Space Telescope parallaxes (HST-), Infrared Surface Brightness (IRSB), Baade-Wesselink (BW) and main-sequence (MS) fitting to candidate clusters. Highly accurate HST parallaxes for 11 Galactic Cepheids are available in the literature (Benedict et al., 2007; Monson et al., 2012; Riess et al., 2014). We use the updated values of HST- for BETA DOR and W SGR from Table 5 of Monson et al. (2012), which differ slightly from those tabulated in Benedict et al. (2007). The Galactic P-L relations based on IRSB, BW, MS distances are discussed in (Fouqué et al., 2007; Turner, 2010; Storm et al., 2011; Monson et al., 2012; Groenewegen, 2013). We note that the principle of distance determination using IRSB and BW methods is similar but with different treatment of algorithms. Groenewegen (2013) essentially used the same data as Storm et al. (2011) and hence they are not totally independent of each other. Both these studies found a similar dependence of the p-factor on period, but the zero point implied a shorter distance scale. The LMC distance modulus found by Groenewegen (2013) was shorter as compared to recent studies. Therefore, we only make use of BW distances when the corresponding IRSB distance is not available. The distance moduli from all available methods for a given Cepheid are listed in Table 5.
| Slope | Intercept | N | Src | Slope | Intercept | ||||
| -3.1270.076 | -5.3200.023 | 0.223 | 99 | TW | — | — | — | — | |
| -3.1940.068 | -5.2580.020 | 0.155 | 59 | F07 | 0.60 | 0.55 | 1.87 | 0.06 | |
| -3.1800.090 | -5.2200.030 | 0.220 | 70 | S11 | 0.45 | 0.65 | 2.64 | 0.01 | |
| -3.0580.021 | -5.3400.019 | 0.073 | 203 | N12 | 1.11 | 0.27 | 0.52 | 0.61 | |
| -3.1640.074 | -5.6430.022 | 0.219 | 99 | TW | |||||
| -3.3280.060 | -5.5430.020 | 0.146 | 56 | F07 | 1.57 | 0.12 | 3.00 | 0.00 | |
| -3.3000.080 | -5.5900.030 | 0.220 | 70 | S11 | 1.25 | 0.21 | 1.43 | 0.16 | |
| -3.1810.022 | -5.6480.020 | 0.077 | 203 | N12 | 0.27 | 0.78 | 0.13 | 0.90 | |
| -3.2780.073 | -5.7160.022 | 0.219 | 99 | TW | — | — | — | — | |
| -3.3650.062 | -5.6470.019 | 0.144 | 58 | F07 | 0.82 | 0.41 | 2.13 | 0.03 | |
| -3.3300.090 | -5.6600.030 | 0.220 | 70 | S11 | 0.45 | 0.65 | 1.51 | 0.13 | |
| -3.2310.021 | -5.7320.020 | 0.075 | 203 | N12 | 0.78 | 0.44 | 0.40 | 0.69 | |
| -3.2230.076 | -6.1680.023 | 0.228 | 99 | TW | — | — | — | — | |
| -3.3830.074 | -5.9890.022 | 0.223 | 99 | TW | — | — | — | — | |
| -3.4150.074 | -6.0370.071 | 0.230 | 70 | S11 | 0.31 | 0.76 | 0.66 | 0.51 | |
| -3.4990.075 | -5.8560.023 | 0.225 | 99 | TW | — | — | — | — | |
Fig. 4 shows comparisons of distance moduli obtained using different techniques. We consider HST parallaxes to be highly precise measurements that include realistic estimates of statistical and systematic sources of uncertainty (median error of 0.14 mag). In contrast, we note that the values listed in Table 5 for the uncertainties in BW, IRSB & MS distance moduli, as reported in the original publications, are not consistent with the observed dispersions seen in Fig. 4. Therefore, we use the latter to estimate a minimum uncertainty for each of these three techniques. Initially, we homogenize the sample by correcting each distance from methods other than HST- for average shifts to match HST- distances. The average shifts between any two methods are ((HST- - IRSB)=0.06, (HST- - BW)=0.10, (IRSB - BW)=-0.06, (IRSB - MS)=0.05). The BW and IRSB methods are very similar and have the highest number of Cepheids in common and also have equal dispersion () with HST-. We consider an equal contribution from each to the variance in the middle panel (Fig. 4) and determine their minimum uncertainty as 0.15 mag. We subtract the contribution of IRSB from the observed variance in the bottom panel (Fig. 4) to determine a minimum error of 0.33 mag for MS distances. We adopt these values as the minimum allowed uncertainty for a given technique when calculating the mean error-weighted distances and uncertainties listed in the last column of Table 5. For these uncertainties, we adopt a conservative approach and use the greater of the standard deviation of the data and the uncertainty on the mean.
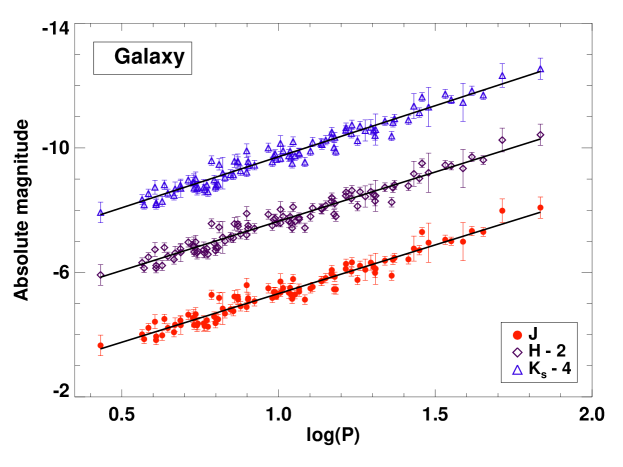
We use extinction-corrected 2MASS mean magnitudes and the adopted mean distance modulus given in Table 5 to calibrate our Galactic P-L and P-W relations. The calculated absolute magnitude for each fundamental mode Cepheid is presented in Table 6. The uncertainty in the absolute magnitude is mostly driven by the large uncertainties on distance and also to a lesser extent, on reddening correction errors. Since our sample included 10 first-overtone stars (DT CYG, FF AQL, FN AQL, EV SCT, QZ NOR, SU CAS, SZ TAU, V496 AQL, X LAC, Y OPH) as identified from Ngeow (2012), we did not consider these stars in calibrating the P-L relations. We also restricted our sample to include only those stars that have periods greater than 2.5 days. Further, we remove 3 outliers in each NIR band to fit a P-L relation, for a final sample of 99 stars. Absolute magnitudes are plotted against and we fit a P-L relation in the form, , where is the slope and is the intercept at . The P-L relations for Galactic Cepheids in each NIR band are shown in Fig. 5 and the slopes and intercepts are given in Table 7.
We make use of these calibrated absolute magnitudes to derive P-W relations for the Galaxy. These Wesenheit magnitudes are estimated using equation 1 and given in Table 6 together with the absolute magnitudes. We again remove 3 outliers when fitting each P-W relation. These calibrated P-W relations for the Galaxy are shown in Fig. 6 and the results are presented in Table 7. We compare our Galactic NIR P-L relations with those published by Fouqué et al. (2007), Storm et al. (2011) and Ngeow (2012). The results from these studies are also listed in Table 7 and the detailed comparison is discussed in appendix A.
3.2. Distance to the LMC
Once the Galactic P-L relation is calibrated we can use it to derive the distance moduli of LMC Cepheids. Assuming the P-L relations to have universal slopes and intercepts, we calculate the absolute magnitude in all bands for individual LMC Cepheids having period . We have the mean apparent magnitudes from Paper I for all Cepheids in the LMC, and using the calibrated absolute magnitudes, we estimate individual distance moduli for all LMC Cepheids. We remove the outliers in the calculated distance moduli and adopt the average value to be the distance modulus in each NIR band. In Section A, we have provided evidence that the P-L and P-W relations are universal for the Galaxy and the LMC. Hence, we do not observe any significant trend as a function of period in the distance moduli for LMC Cepheids.
The values of mean distance moduli for LMC Cepheids are provided in Table 8. These results are in excellent agreement with the result from Pietrzyński et al. (2013), given their uncertainties. This further suggests that the metallicity correction is not needed in and and the zero point of the P-L relation in these bands is metallicity independent. The reason for the small variations in these distance moduli could be due to the slight difference in the slopes and intercepts of the two galaxies and also the errors in the transformations of Galactic mean magnitudes to the 2MASS system. The LMC distance moduli obtained using the calibration of Galactic P-W relations are also presented in Table 8. Again, these distance moduli are in excellent agreement with the Pietrzyński et al. (2013) result.
The errors in the P-L based distance estimates are only 3%, while those based on P-W are 4%. We expect that with the larger number of Cepheids having high quality light curve data in the LMC OGLE-IV survey, the errors can be reduced further. The Galactic calibrations in our work are based on distances obtained by four independent methods, which have different sources of systematic errors. At present, it is difficult to provide an absolute calibration of Galactic relations with a well-determined systematic uncertainty, which can be propagated to Cepheid based distance estimates. Therefore, we only provide the total statistical uncertainty and the systematic errors are expected to be of the order of, or even larger than the quoted uncertainties. A robust calibration of Galactic relations will only be possible with accurate parallaxes from GAIA and then the LMCNISS data can be used to obtain a more precise distance to the LMC. However, our results do provide a useful check on the distance to the LMC, which is consistent and independent to the distance obtained by Pietrzyński et al. (2013).
| 18.520.06 | 18.470.06 | 18.470.06 | |
| 18.400.08 | 18.440.09 | 18.460.09 | |
| Fixed Galactic P-L slopes | |||
| 18.510.06 | 18.460.06 | 18.480.06 | |
| Average value = 18.470.07 | |||
Alternatively, we also calculate the LMC distance moduli using the slopes and zero points at from the LMC P-L relations, given in Table 7. Since the LMC relations exhibit a smaller dispersion, we use these slopes to determine the zero point of the Galactic relations at . Following Monson et al. (2012), the apparent distance moduli are determined by differencing the LMC and the Galactic zero points. These distance moduli, presented in Table 8, are found to be consistent with the recent studies on distance determination (Fouqué et al., 2007; Monson et al., 2012; Pietrzyński et al., 2013). All these results provide an average value of the LMC distance modulus mag, which is in excellent agreement with the “concordance” distance modulus of mag estimated by de Grijs et al. (2014).
We note that the LMC distance moduli estimated using the -band P-L and the relations show the largest deviations from the other estimates and the Pietrzyński et al. (2013) value. Since the slope and intercepts are nearly equal for both Galaxy and LMC, we investigate the possible reasons for the difference. We find that the Galactic -band P-L relation and Wesenheit show a break around 10 days. We use the F-test (Bhardwaj et al., 2014) to determine the significance of these breaks and find that the Wesenheit is significantly non-linear. The LMC P-L and P-W relations were previously found to be non-linear at 10 days (Sandage et al., 2004b; Ngeow et al., 2005; Ngeow & Kanbur, 2006a; García-Varela et al., 2013). A detailed statistical analysis of the non-linearity in our LMC relations and its impact on the distance scale will be presented in a subsequent study.
4. A Distance to the Andromeda Galaxy (M31)
We make use of Cepheid observations in M31 from the Panchromatic Hubble Andromeda Treasury (PHAT) survey (Dalcanton et al., 2012; Williams et al., 2014) to estimate the distance to this galaxy. The observations were carried out using the Hubble Space Telescope Advanced Camera for Surveys (HST/ACS) and Wide Field Camera 3 (WFC3). There are 477 fundamental-mode Cepheids observed with the HST filters F110W and F160W in M31. Since full light curves are not available, random-phase observations must be used. However, the high resolving power of HST allows random-phase observations to be comparable or better than ground-based observations. The improved photometric accuracy reduces the dispersion in P-L relations even with random-phase magnitudes.
4.1. NIR P-L and P-W relations
We note that no robust observational transformation from HST F110W and F160W filters to ground-based and is available in the literature. Therefore, we make use of theoretical transformations derived from isochrones (Girardi et al., 2002)222http://stev.oapd.inaf.it/cgi-bin/cmd_2.5. We take Girardi isochrones over a range of ages (1-12 Gyr) and metallicities (Z=0.0001 to 0.03) at and (Bonatto et al., 2004; Girardi et al., 2008). We compare the 2MASS and filters to the HST WFC3-IR F110W and F160W filters and derive the following transformations over the range of observed F110-F160W colors:
| (3) | |||||
| (4) | |||||
with rms errors of mag and mag in and , respectively. We added the rms error in quadrature to the observed photometric error to estimate the associated error for transformed magnitudes. This theoretical transformation led to an average offset of mag and mag between & F110W and & F160W, respectively.
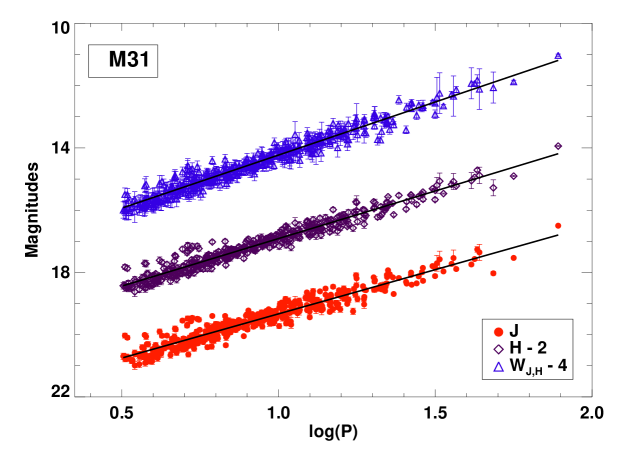
The random-phase magnitudes are corrected for reddening using the extinction law of Cardelli et al. (1989) using = 3.1 and a foreground reddening to M31 of mag (Schlafly & Finkbeiner, 2011). We derive the P-L relations in and and the P-W relation in using the transformed magnitudes. We calculate Wesenheit magnitudes using equation 1 and remove outliers and fit the remaining sample of 440 stars to derive P-L relations and a P-W relation. These relations are plotted in Fig. 7, while their intercepts and slopes are given in Table 9. Our P-L relations in - and -band are consistent with P-L relations in HST filters derived by Kodric et al. (2015), with slight differences in slopes presumably due to HST filters to 2MASS transformations. A more detailed comparison of long period P-L relations in HST filters with Kodric et al. (2015) results is provided in Wagner-Kaiser et al. (2015).
We also compare the slope of M31 P-L and P-W relations with the Galaxy and LMC. The results of the t-statistical test are given in Table 10. The slope of the M31 -band P-L relation is statistically different to the Galactic and LMC P-L relations, while the M31 -band P-L relation shows a slope consistent with the Galactic relation (within the large uncertainty in the latter). On the other hand, the M31 slope is not consistent with our results for the Milky Way or the LMC, yet it is in agreement with the results from Inno et al. (2013). The possible reason for this discrepancy may be the random-phase observations in M31 and Inno et al. (2013) as opposed to magnitudes based on full-phase light curves for our work. Moreover, the derived theoretical transformations may also contribute to the difference in P-W relations.
| Band | Slope | Intercept | N | |
|---|---|---|---|---|
| -2.8390.040 | 19.3310.011 | 0.214 | 440 | |
| -3.0560.033 | 18.9130.009 | 0.173 | 440 | |
| -3.4090.035 | 18.2310.010 | 0.183 | 440 |
| galaxy | slope | Src | |||
|---|---|---|---|---|---|
| M31 | -2.8390.040 | TW | — | — | |
| MW | -3.1270.076 | TW | 3.44 | 0.00 | |
| LMC | -3.1400.004 | M15 | 9.77 | 0.00 | |
| M31 | -3.0560.033 | TW | — | — | |
| MW | -3.1640.074 | TW | 1.53 | 0.13 | |
| LMC | -3.1690.004 | M15 | 4.39 | 0.00 | |
| M31 | -3.4090.035 | TW | — | — | |
| MW | -3.2230.076 | TW | 2.52 | 0.01 | |
| LMC | -3.1540.014 | TW | 7.85 | 0.00 | |
| LMC | -3.3730.008 | I13 | 1.53 | 0.13 |
4.2. The Distance to M31
We use the magnitudes for the M31 Cepheids to determine the distance to this galaxy. Since we have calibrated P-W relations for Galactic Cepheids, we can calibrate the absolute Wesenheit magnitudes in for individual M31 Cepheids. We use these calibrated absolute magnitudes together with the Wesenheit magnitudes for M31 to find the distance modulus for each M31 Cepheid independently. We remove the outliers in the calculated distance moduli and take the mean value to be the distance modulus to M31. However, we note that the P-W relation in for the Cepheids in M31 is steeper as compared to the Galaxy and the LMC. Therefore, we observe a trend as a function of period in the distance moduli for Cepheids in M31. The mean distance modulus to M31 Cepheids using the Galactic calibration is found to be mag. Similarly, we also make use of the calibrated P-W relation in for the LMC Cepheids to determine distance moduli of Cepheids in M31. We consider an error-weighted mean to find a true distance modulus to M31 of mag, using the LMC calibration.
| Calibrator | Published | Source | |
|---|---|---|---|
| Galaxy | 24.420.20 | 24.440.12 | R05 |
| 24.360.08 | V10 | ||
| LMC | 24.500.19 | 24.380.06 | R12 |
| 24.460.10 | D14 | ||
| Average value = 24.460.20 | |||
| Met. | Calibrator | Published | |||||||
| — | — | Galaxy | LMC | Galaxy+LMC | TRGB | Ref. | Cepheid | Ref. | |
| WLM | 29 | 7.74 | 24.850.11 | 24.880.08 | 24.920.07 | 25.120.15 | G11 | 24.920.04 | G08 |
| IC 1613 | 23 | 7.86 | 24.200.10 | 24.220.07 | 24.260.07 | 24.240.10 | G11 | 24.290.04 | P06 |
| SMC | 602 | 7.98 | 18.960.08 | 19.000.05 | 19.030.05 | 18.98 | R07 | 18.960.02 | D15 |
| NGC 55 | 36 | 8.05 | 26.340.09 | 26.350.06 | 26.370.06 | — | — | 26.430.04 | GI8 |
| NGC 3109 | 69 | 8.06 | 25.450.09 | 25.470.06 | 25.490.06 | 25.420.13 | G11 | 25.570.02 | S06 |
| NGC 6822 | 20 | 8.14 | 23.390.08 | 23.410.06 | 23.430.06 | 23.260.10 | G11 | 24.380.02 | R14 |
| NGC 300 | 15 | 8.35 | 26.260.10 | 26.280.07 | 26.290.07 | 26.480.04 | R07 | 26.370.05 | G05 |
| NGC 247 | 10 | — | 27.570.12 | 27.580.09 | 27.600.09 | — | — | 27.640.04 | G09 |
| M33 | 24 | 8.55 | 24.600.08 | 24.610.06 | 24.620.06 | 24.710.04 | R07 | 24.620.07 | G13 |
| -5.9800.072 | -6.0090.050 | -6.0100.049 | |||||||
| -3.2380.027 | -3.2490.019 | -3.2440.016 | |||||||
These results are again consistent with previous studies (Stanek & Garnavich, 1998; Ribas et al., 2005; Vilardell et al., 2006, 2010; Riess et al., 2012; Valls-Gabaud, 2013). The values of mean distance modulus for M31 Cepheids obtained using both Galaxy and LMC as calibrators are given in Table 11. The larger error in distance moduli for M31 can be attributed to a greater scatter in the random-phase P-L relation obtained from the single epoch observations from the PHAT survey. However, our results are still in excellent agreement with the “concordance” distance modulus of mag from de Grijs & Bono (2014). We also note that Wagner-Kaiser et al. (2015) determined a distance of mag to M31 using long-period (d) Cepheids and the P-W relation in HST filters.
5. Distances to Local Group Galaxies
We compiled published NIR mean magnitudes for Cepheids in other Local Group galaxies. Recently, Ngeow et al. (2015) derived the P-L relations for Cepheids in SMC at multiple wavelengths. They used the 2MASS counterparts of OGLE-III SMC fundamental-mode Cepheids and applied random phase corrections to obtain mean magnitudes. Also, Rich et al. (2014) determined the distance to NGC 6822 using previously-published and newly-obtained data in multiple bands. The band photometry was calibrated to the 2MASS system. We make use of NIR and mean magnitudes from these studies in our analysis. The Cepheids in IC 1613 were observed by Scowcroft et al. (2013) using the FourStar NIR camera at Las Campanas and the mean magnitudes are available in bands. We also use & observations from the Araucaria project for Cepheids in IC 1613, M33, WLM, NGC 3109, NGC 300, NGC 55, NGC 247 (Pietrzyński et al., 2006; Gieren et al., 2013, 2008b; Soszyński et al., 2006; Gieren et al., 2005, 2008a, 2009). All these mean magnitudes are transformed to the 2MASS system using color transformations as discussed in previous sections.
We determine the distance moduli to these Local Group galaxies using the P-W relation. We prefer the P-W relations as they are independent of extinction corrections. We use a global fit to all Cepheids in the Local Group galaxies having Wesenheit magnitudes. Therefore, the Wesenheit magnitude for the Cepheid in target galaxy is defined as:
| (5) |
where is the distance moduli to the target galaxy, and is the Wesenheit magnitude of a Cepheid with d in the calibrator galaxy (LMC and/or Milky Way). The parameter is to be determined using the global fit and represents the slope for all Cepheids in the sample. We solve the matrix equation using the minimization of as discussed in Riess et al. (2009). We use magnitudes for the Galaxy and LMC separately in the above equation to determine distances to other galaxies. We also use a combined calibration based on Galactic and LMC data. The metallicity gradients of Local Group galaxies are based on the scale and adopted from Sakai et al. (2004); Bono et al. (2010); Fiorentino et al. (2012). We apply the metallicity corrections for calibrations based on the Galaxy and LMC such that , where is the difference in mean metallicity between the target and the calibrator galaxy and mag dex-1 is adopted from Bono et al. (2010) for . The mean metallicity values in this scale for the Galactic and LMC Cepheids are and dex, respectively. However, we do not apply a metallicity correction when we use the combined Galactic+LMC calibration in the global fit. The estimated values of the distance moduli are presented in Table 12. The uncertainties in the distance moduli obtained from the global fit are only statistical; we also add in quadrature the systematic uncertainty in the zeropoint of the calibrator relations to arrive at the final values.

We note that the distance moduli obtained for IC 1613 are in good agreement with the results based on P-L relations by Pietrzyński et al. (2006) and Scowcroft et al. (2013). However, there is a large offset ( mag) in the magnitudes for Cepheids in common between these two studies. Using the Pietrzyński et al. (2006) data for our P-W analysis yields a distance modulus consistent with previous work, indicating a problem with the calibration of the Scowcroft et al. (2013) data. We compare our results with recent TRGB and Cepheid distances available in the literature and find a good agreement. The difference in Cepheid and TRGB based distance estimates as a function of metallicity is shown in Fig. 8. We do not observe any significant trend in estimated distances as a function of metallicity. Further, the metallicity correction leads to a difference of mag in distance modulus for metal poor galaxies (WLM, IC 1613, SMC), while the mean difference is mag with or without metallicity correction for other Local Group galaxies. The global fit results in a universal slope of - for the Wesenheit relation for Cepheids in Local Group galaxies. We also note that our distance estimates are consistent for a large metallicity range dex and therefore, our calibrator relations can be applied to future observations of Cepheids in more distant galaxies.
6. Conclusions
In the present analysis, we analysed Period-Luminosity and Period-Wesenheit relations for Cepheids in the LMC, the Galaxy, and M31 at wavelengths. We also determine the distances to LMC, M31 and other Local Group galaxies. We summarize our conclusions arising from this study -
-
1.
We use data for Cepheids from LMCNISS (Macri et al., 2015) to derive new Period-Wesenheit relations at these wavelengths. The relations for fundamental-mode Cepheids are based on a sample size 9 times larger than the previously-published time-series results. The first-overtone Period-Wesenheit relation is calibrated for the first time with phased light curve data, as opposed to random single-phase observations.
-
2.
We obtain a new calibration of Galactic Cepheid Period-Luminosity and Period-Wesenheit relations based on distances from various methods, taking into account the intrinsic scatter of each technique. Our results bridge the inconsistency between Galactic P-L relations based on independent distances and P-L relations derived using Wesenheit distances. We find our results are consistent with most of the previously-published work, considering the large intrinsic scatter in Galactic relations.
-
3.
We use the new LMCNISS data to provide an independent estimate of the distance to the LMC. Using Galactic calibrations, we determine , with a total statistical uncertainty of mag, which is in excellent agreement with the value from Pietrzyński et al. (2013) based on late-type eclipsing binaries. However, our error estimates do not include the unknown systematic uncertainties.
-
4.
We derive new P-L and P-W relations for Cepheids in M31, based on the observations from the PHAT survey. We develop theoretical transformations from HST filters F110W and F160W to 2MASS and -bands. Although the relations are based on random-phase observations, the highly accurate HST observations help to reduce the observed dispersion in Period-Luminosity and Period-Wesenheit relations.
- 5.
-
6.
We apply a simultaneous fit to Cepheids in Local Group galaxies, using the Galaxy and LMC as calibrators, to obtain a global slope of - mag/dex in and estimate robust distances, which are found to be consistent with previous results based on TRGB and Cepheids. We do not find a significant metallicity effect at these wavelengths.
-
7.
Our absolute calibration of the Galactic and LMC relations provides accurate distances for Local Group galaxies with a wide metallicity range () dex. In combination with higher-quality NIR light curves for Cepheids at greater distances, they can be used for further improvements in the precision and accuracy of the distance scale.
An upcoming study based on LMCNISS data (Bhardwaj et al. in preparation) will include a statistical analysis of non-linearities in the Leavitt law at wavelengths and its impact on the distance scale and in constraining theoretical pulsation models.
Acknowledgments
AB acknowledges the Senior Research Fellowship grant 09/045(1296)/2013-EMR-I from Human Resource Development Group (HRDG), which is a division of Council of Scientific and Industrial Research (CSIR), India. This work is supported by the grant for the Joint Center for Analysis of Variable Star Data provided by Indo-U.S. Science and Technology Forum. LMM acknowledges support by the United States National Science Foundation through AST grant number 1211603 and by Texas A&M University through a faculty start-up fund and the Mitchell-Heep-Munnerlyn Endowed Career Enhancement Professorship in Physics or Astronomy. CCN thanks the funding from Ministry of Science and Technology (Taiwan) under the contract NSC101-2112-M-008-017-MY3. This work also makes use of data products from the 2MASS survey, which is a joint project of the University of Massachusetts and the Infrared Processing and Analysis Center/California Institute of Technology, funded by the National Aeronautics and Space Administration and the National Science Foundation. In addition, this study also makes use of NASA’s Astrophysics Data System, the VizieR catalogue and the McMaster Cepheid Photometry data base.
Appendix A A Comparison of Period-Luminosity and Period-Wesenheit relations
We use our LMCNISS mean magnitudes to determine a distance to the LMC with published NIR Galactic P-L relations listed in Table 7. We present the LMC distance moduli obtained using these P-L relations in Table 13. We note that the distances in and bands are considerably smaller using P-L relations from Fouqué et al. (2007) and Storm et al. (2011). Similarly, the band P-L from Ngeow (2012) leads to a relatively greater value of LMC distance as compared to Pietrzyński et al. (2013). We explore the reasons of possible discrepancy among these relations and compare with our Galactic P-L relations derived in the present study.
Ngeow (2012) used a method involving the Wesenheit function to derive distance moduli for a large number of Galactic Cepheids and found a marginal average difference (-0.061 to 0.009) with published distances. This method was also calibrated against HST parallaxes but the uncertainties listed in that work are only statistical errors. It is important to note that even though the Wesenheit distances are consistent with other methods, there is a significant change in the slope and intercepts of P-L relations from Ngeow (2012) with Fouqué et al. (2007) and Storm et al. (2011). Interestingly, our results based on various distances are very consistent with Ngeow (2012).
We find that our slopes for P-L relations are consistent with Fouqué et al. (2007), Storm et al. (2011) and Ngeow (2012) as , in all the bands. However, the intercepts of P-L relations show mixed results with most of them being consistent with published work. The intercepts of P-L relations are in excellent agreement with Ngeow (2012) but relatively smaller than Fouqué et al. (2007) and Storm et al. (2011). The t-test suggests that the zero-points of our P-L relations are statistically different to Fouqué et al. (2007) but the zero-point of the and -band P-L relations are statistically similar to Storm et al. (2011), with -band zero-point again being significantly different. We also note that the dispersion in our P-L relations is similar to those by Storm et al. (2011) whereas we have increased the sample size nearly 1.5 times. The discrepancy in results with Fouqué et al. (2007) is mainly due to significantly different sample sizes.
We test the difference in zero-points with Fouqué et al. (2007) and Storm et al. (2011) by comparing the properties of P-L relations derived using only Cepheids common to these samples. We find that the difference in zero-points of the two set of P-L relations is reduced on an average by mag. Therefore, the slope and intercepts of our P-L relations are not significantly different from published work. A small contribution to this difference in intercepts may be due to the inclusion of few first overtone stars (for example, FN AQL, V496 AQL and Y OPH) in Fouqué et al. (2007) and Storm et al. (2011). These stars are not considered in our sample following Ngeow (2012). Our results for the P-W relation in are also consistent with the findings of Storm et al. (2011).
| Source | |||
|---|---|---|---|
| F07 | 18.44 0.05 | 18.32 0.05 | 18.37 0.06 |
| S11 | 18.40 0.06 | 18.38 0.06 | 18.40 0.07 |
| N12 | 18.56 0.05 | 18.47 0.05 | 18.50 0.05 |
| Slope | 0.27 | 0.12 | 0.18 | 1.59 | 3.03 | 3.35 | |
|---|---|---|---|---|---|---|---|
| 0.79 | 0.90 | 0.86 | 0.11 | 0.00 | 0.00 | ||
| Intercept | 0.20 | 0.49 | 0.20 | 1.24 | 0.44 | 0.09 | |
| 0.84 | 0.63 | 0.84 | 0.21 | 0.66 | 0.92 |
We also compare the slopes and intercepts of Milky Way and LMC Cepheid P-L and P-W relations. From Table 3 and 7, we find that the intercepts of both P-L and P-W relations for the Galaxy and the LMC are essentially similar in all the bands. The t-test results, given in Table 14, also provide evidence of statistically equal zero-points under a confidence level. Further, the slopes of the P-L and P-W relations for both the Galaxy and LMC are also very similar except in and . This difference in the slopes of the Wesenheit relations is mainly due to insignificant contribution of color terms in Galactic Wesenheits, which leads to greater dispersion than P-L relations. This provides further empirical evidence that at NIR wavelengths, P-L and P-W relations for Cepheids are universal and the zero-points are independent of metallicity effects (Gieren et al., 2006c; Fouqué et al., 2007; Monson et al., 2012).
References
- Baart (1982) Baart, M. L. 1982, IMA J. Num. Analysis, 2, 241
- Barnes et al. (1997) Barnes, III, T. G., Fernley, J. A., Frueh, M. L., et al. 1997, PASP, 109, 645
- Benedict et al. (2007) Benedict, G. F., McArthur, B. E., Feast, M. W., et al. 2007, AJ, 133, 1810
- Bhardwaj et al. (2015) Bhardwaj, A., Kanbur, S. M., Singh, H. P., Macri, L. M., & Ngeow, C.-C. 2015, MNRAS, 447, 3342
- Bhardwaj et al. (2014) Bhardwaj, A., Kanbur, S. M., Singh, H. P., & Ngeow, C.-C. 2014, MNRAS, 445, 2655
- Bonatto et al. (2004) Bonatto, C., Bica, E., & Girardi, L. 2004, A&A, 415, 571
- Bono et al. (1999) Bono, G., Caputo, F., Castellani, V., & Marconi, M. 1999, ApJ, 512, 711
- Bono et al. (2010) Bono, G., Caputo, F., Marconi, M., & Musella, I. 2010, ApJ, 715, 277
- Cardelli et al. (1989) Cardelli, J. A., Clayton, G. C., & Mathis, J. S. 1989, ApJ, 345, 245
- Dalcanton et al. (2012) Dalcanton, J. J., Williams, B. F., Lang, D., et al. 2012, ApJs, 200, 18
- de Grijs & Bono (2014) de Grijs, R., & Bono, G. 2014, AJ, 148, 17
- de Grijs & Bono (2015) —. 2015, AJ, 149, 179
- de Grijs et al. (2014) de Grijs, R., Wicker, J. E., & Bono, G. 2014, AJ, 147, 122
- Feast et al. (2012) Feast, M. W., Whitelock, P. A., Menzies, J. W., & Matsunaga, N. 2012, MNRAS, 421, 2998
- Fernie et al. (1995) Fernie, J. D., Evans, N. R., Beattie, B., & Seager, S. 1995, Information Bulletin on Variable Stars, 4148, 1
- Fiorentino et al. (2012) Fiorentino, G., Clementini, G., Marconi, M., et al. 2012, Ap&SS, 341, 143
- Fouqué et al. (2007) Fouqué, P., Arriagada, P., Storm, J., et al. 2007, A&A, 476, 73
- García-Varela et al. (2013) García-Varela, A., Sabogal, B. E., & Ramírez-Tannus, M. C. 2013, MNRAS, 431, 2278
- Gieren et al. (2006a) Gieren, W., Pietrzyński, G., Nalewajko, K., et al. 2006a, ApJ, 647, 1056
- Gieren et al. (2005) Gieren, W., Pietrzyński, G., Soszyński, I., et al. 2005, ApJ, 628, 695
- Gieren et al. (2008a) —. 2008a, ApJ, 672, 266
- Gieren et al. (2006b) Gieren, W., Storm, J., Barnes, III, T. G., et al. 2006b, MEMSAI, 77, 198
- Gieren et al. (2006c) —. 2006c, MEMSAI, 77, 198
- Gieren et al. (2008b) Gieren, W., Pietrzyński, G., Szewczyk, O., et al. 2008b, ApJ, 683, 611
- Gieren et al. (2009) Gieren, W., Pietrzyński, G., Soszyński, I., et al. 2009, ApJ, 700, 1141
- Gieren et al. (2013) Gieren, W., Górski, M., Pietrzyński, G., et al. 2013, ApJ, 773, 69
- Gieren et al. (1998) Gieren, W. P., Fouque, P., & Gomez, M. 1998, ApJ, 496, 17
- Girardi et al. (2002) Girardi, L., Bertelli, G., Bressan, A., et al. 2002, A&A, 391, 195
- Girardi et al. (2008) Girardi, L., Dalcanton, J., Williams, B., et al. 2008, PASP, 120, 583
- Górski et al. (2011) Górski, M., Pietrzyński, G., & Gieren, W. 2011, AJ, 141, 194
- Groenewegen (2013) Groenewegen, M. A. T. 2013, A&A, 550, A70
- Inno et al. (2013) Inno, L., Matsunaga, N., Bono, G., et al. 2013, ApJ, 764, 84
- Kanbur et al. (2003) Kanbur, S. M., Ngeow, C.-C., Nikolaev, S., Tanvir, N. R., & Hendry, M. A. 2003, A&A, 411, 361
- Kodric et al. (2015) Kodric, M., Riffeser, A., Seitz, S., et al. 2015, ApJ, 799, 144
- Laney & Stobie (1992) Laney, C. D., & Stobie, R. S. 1992, A&AS, 93, 93
- Leavitt & Pickering (1912) Leavitt, H. S., & Pickering, E. C. 1912, Harvard College Observatory Circular, 173, 1
- Macri et al. (2015) Macri, L. M., Ngeow, C.-C., Kanbur, S. M., Mahzooni, S., & Smitka, M. T. 2015, AJ, 149, 117
- Madore (1982) Madore, B. F. 1982, ApJ, 253, 575
- Madore & Freedman (2009) Madore, B. F., & Freedman, W. L. 2009, ApJ, 696, 1498
- Monson et al. (2012) Monson, A. J., Freedman, W. L., Madore, B. F., et al. 2012, ApJ, 759, 146
- Monson & Pierce (2011) Monson, A. J., & Pierce, M. J. 2011, ApJ, 193, 12
- Ngeow (2012) Ngeow, C.-C. 2012, ApJ, 747, 50
- Ngeow & Kanbur (2004) Ngeow, C.-C., & Kanbur, S. M. 2004, MNRAS, 349, 1130
- Ngeow & Kanbur (2006a) —. 2006a, ApJ, 650, 180
- Ngeow & Kanbur (2006b) —. 2006b, MNRAS, 369, 723
- Ngeow et al. (2015) Ngeow, C.-C., Kanbur, S. M., Bhardwaj, A., & Singh, H. P. 2015, ApJ, 808, 67
- Ngeow et al. (2005) Ngeow, C.-C., Kanbur, S. M., Nikolaev, S., et al. 2005, MNRAS, 363, 831
- Perryman (1997) Perryman, M. A. C. 1997, in ESA Special Publication, Vol. 402, Hipparcos - Venice ’97, 1–4
- Persson et al. (2004) Persson, S. E., Madore, B. F., Krzemiński, W., et al. 2004, AJ, 128, 2239
- Pietrzyński et al. (2006) Pietrzyński, G., Gieren, W., Soszyński, I., et al. 2006, ApJ, 642, 216
- Pietrzyński et al. (2013) Pietrzyński, G., Graczyk, D., Gieren, W., et al. 2013, Nature, 495, 76
- Ribas et al. (2005) Ribas, I., Jordi, C., Vilardell, F., et al. 2005, ApJL, 635, L37
- Rich et al. (2014) Rich, J. A., Persson, S. E., Freedman, W. L., et al. 2014, ApJ, 794, 107
- Riess et al. (2014) Riess, A. G., Casertano, S., Anderson, J., MacKenty, J., & Filippenko, A. V. 2014, ApJ, 785, 161
- Riess et al. (2012) Riess, A. G., Fliri, J., & Valls-Gabaud, D. 2012, ApJ, 745, 156
- Riess et al. (2009) Riess, A. G., Macri, L., Casertano, S., et al. 2009, ApJ, 699, 539
- Riess et al. (2011) —. 2011, ApJ, 730, 119
- Ripepi et al. (2012) Ripepi, V., Moretti, M. I., Marconi, M., et al. 2012, MNRAS, 424, 1807
- Rizzi et al. (2007) Rizzi, L., Tully, R. B., Makarov, D., et al. 2007, ApJ, 661, 815
- Sakai et al. (2004) Sakai, S., Ferrarese, L., Kennicutt, Jr., R. C., & Saha, A. 2004, ApJ, 608, 42
- Sandage et al. (2004a) Sandage, A., Tammann, G. A., & Reindl, B. 2004a, A&A, 424, 43
- Sandage et al. (2004b) —. 2004b, A&A, 424, 43
- Sandage et al. (2009) —. 2009, A&A, 493, 471
- Schlafly & Finkbeiner (2011) Schlafly, E. F., & Finkbeiner, D. P. 2011, ApJ, 737, 103
- Scowcroft et al. (2013) Scowcroft, V., Freedman, W. L., Madore, B. F., et al. 2013, ApJ, 773, 106
- Soszyński et al. (2006) Soszyński, I., Gieren, W., Pietrzyński, G., et al. 2006, ApJ, 648, 375
- Soszynski et al. (2008) Soszynski, I., Poleski, R., Udalski, A., et al. 2008, ACTAA, 58, 163
- Stanek & Garnavich (1998) Stanek, K. Z., & Garnavich, P. M. 1998, ApJL, 503, L131
- Storm et al. (2011) Storm, J., Gieren, W., Fouqué, P., et al. 2011, A&A, 534, A95
- Tammann et al. (2003) Tammann, G. A., Sandage, A., & Reindl, B. 2003, A&A, 404, 423
- Turner (2010) Turner, D. G. 2010, AP & SS, 326, 219
- Ulaczyk et al. (2013) Ulaczyk, K., Szymański, M. K., Udalski, A., et al. 2013, Acta Astronomica, 63, 159
- Valls-Gabaud (2013) Valls-Gabaud, D. 2013, in IAU Symposium, Vol. 289, IAU Symposium, ed. R. de Grijs, 235–235
- Van Leeuwen et al. (2007) Van Leeuwen, F., Feast, M. W., Whitelock, P. A., & Laney, C. D. 2007, MNRAS, 379, 723
- Vilardell et al. (2006) Vilardell, F., Ribas, I., & Jordi, C. 2006, A&A, 459, 321
- Vilardell et al. (2010) Vilardell, F., Ribas, I., Jordi, C., Fitzpatrick, E. L., & Guinan, E. F. 2010, A&A, 509, A70
- Wagner-Kaiser et al. (2015) Wagner-Kaiser, R., Sarajedini, A., Dalcanton, J. J., Williams, B. F., & Dolphin, A. 2015, MNRAS, 451, 5243
- Welch et al. (1984) Welch, D. L., Wieland, F., McAlary, C. W., et al. 1984, ApJs, 54, 547
- Williams et al. (2014) Williams, B. F., Lang, D., Dalcanton, J. J., et al. 2014, ApJs, 215, 9