FIRST INTEGRAL111Based on observations with INTEGRAL, an ESA project with instruments and science data centre funded by ESA member states (especially the PI countries: Denmark, France, Germany, Italy, Spain, and Switzerland), Czech Republic and Poland with participation of Russia and USA. OBSERVATIONS OF V404 CYGNI DURING THE 2015 OUTBURST: SPECTRAL BEHAVIOR IN THE 20 - 650 KEV ENERGY RANGE
Abstract
In June 2015, the source V404 Cygni (= GS2023+38) underwent an extraordinary outburst. We present the results obtained during the first revolution dedicated to this target by the INTEGRAL mission, and focus on the spectral behavior in the hard X-ray domain, using both SPI and IBIS instruments. The source exhibits extreme variability, and reaches fluxes of several tens of Crab. However, the emission between 20 and 650 keV can be understood in terms of two main components, varying on all the observable timescales, similar to what is observed in the persistent black hole system Cyg X-1. The low energy component (up to 200 keV) presents a rather unusual shape, probably due to the intrinsic source variability. Nonetheless, a satisfactory description is obtained with a Comptonization model, if an unusually hot population of seed photons ( 7 keV) is introduced. Above this first component, a clear excess extending up to 400-600 keV leads us to investigate a scenario where an additional (cutoff) power law could correspond to the contribution of the jet synchrotron emission, as proposed in Cyg X-1. A search for an annihilation feature did not provide any firm detection, with an upper limit of ph cm-2 s-1 ( for a narrow line centered at 511 keV, on the averaged obtained spectrum.
Subject headings:
Gamma-rays: individual (V404 Cygni = GS2023+338) — radiation mechanisms: general — black hole physics — X-rays: binaries1. Introduction
The 2015 outburst of V404 Cyg will probably remain a unique event in astrophysical history. Identified as a nova in 1938, when only optical observations were available, V404 Cyg came back to the forefront in 1989 when another nova episode was observed simultaneously in optical and in the soft X-rays and hard X-rays domains by the GINGA satellite (from where its second name comes GS2023+338, Makino et al. 1989) and the Roentgen instruments onboard the Kvant module (Syunyaev et al., 1991). It presented huge variability, and reached several Crab flux levels, in soft X-rays as well as in hard X-rays, becoming the brightest source ever observed in these energy ranges. The parameters have been determined, with the system located at 2.39 0.14 kpc (Miller-Jones et al., 2009) and containing a 10 black hole, with an orbital period around 6.5 days (Casares et al., 1992). The 2015 episode started with similar burst-like activity that was first detected by Swift/BAT (Barthelmy et al., 2015) and Fermi/GBM (Younes et al., 2015), and soon after was observed at all wavelengths from radio (Mooley et al., 2015) to hard X-rays and reached exceptional levels of luminosity, exceeding all expectations (up to 50 Crab in hard X-rays, Rodriguez et al. 2015).
Among the global monitoring of the source, INTEGRAL, with its two main instruments SPI and IBIS, played a major role in the hard X-ray/soft -ray studies.
2. Instrument, observations and data analysis
We analyzed the first public observation from 2015 June 17 to June 20 (revolution 1554) for a total
useful duration of 150 ks. The SPI analysis is based on consolidated data
and algorithms developed at IRAP
111An open SPI Data Analysis Interface (SPIDAI)
allows one to perform the SPI data analysis with the same
tools as those used in this paper. See the dedicated webpage http://sigma-2.cesr.fr/INTEGRAL/spidai.
Considering the source exceptional flux level and variability, it is worth mentioning that the SPI
data are not affected by pile-up or TM saturation.
Only a limited number of data packets are missing corresponding to a few seconds of data, with an energy independent effect.
The IBIS data for this observation are
near real-time data processed using the latest release of
the INTEGRAL Offline Scientific Analysis (OSA version 10.1).
The IBIS and SPI results have been compared, and show that the source
fluxes are in good agreement, even if, at high flux
levels, IBIS/ISGRI spectra appear systematically harder than the SPI ones
(See analysis by Natalucci et al. 2015). The
reason for this is under investigation, and probably related to a
combination of source variability and telemetry saturation.
The description of the instruments and performance can
be found in Vedrenne et al. (2003) and Roques et al. (2003) for SPI,
and Ubertini et al. (2003) for IBIS.
3. Broad band and spectral evolution
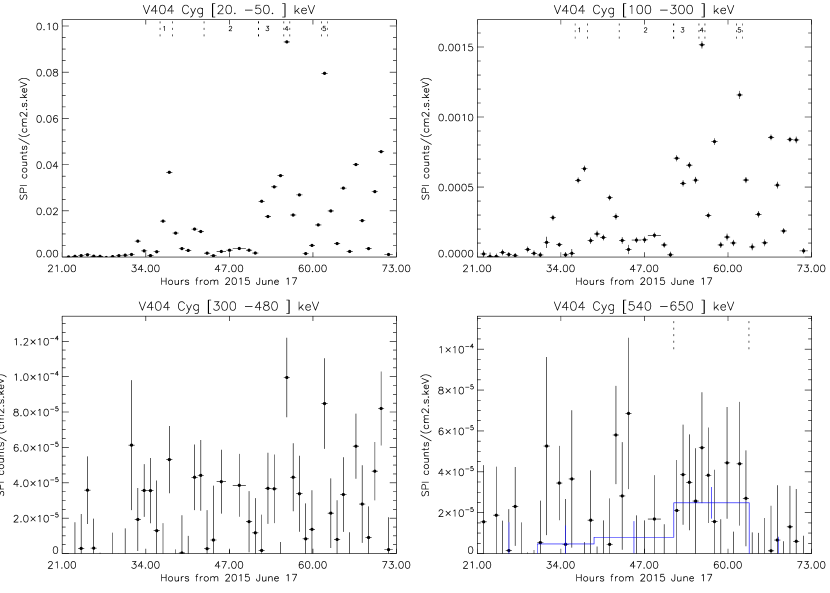
The source variability at all wavelengths and on all timescales is striking. However, the emission above 200 keV contains key information about the population(s) present and energy transfer but requires longer integration time. The present analysis is based on the science window (scw) timescale, a time interval lasting approximatively 3.4 ks, and corresponding to a stable pointing direction. Fig. 1 displays the source evolution over 4 broad bands covering the 20-650 keV domain, and demonstrates that, on this hour timescale, the source variability is significant up to 500 keV, and appears energy dependent.
In order to quantify the spectral evolution, the observed emission
is described with a common model, both physically reasonable and as simple as possible.
An averaged spectrum has been built
and fitted with the xspec v12.8.2 tools (Arnaud et al., 1996). Starting from a Comptonization model , we
note the emergence of a high energy component around 100 keV. This component is reminiscent of the hard tail observed in several X-ray binary systems, transient sources (e. g. Nova Persei=GROJ0422+32, Roques et al. 1994) or persistent sources (e. g. Cyg X-1).
Continuing the analogy with the well-studied source Cyg X-1, we add to our model the same second component (cutoff powerlaw )
used to account for the high energy tail in the hard state.
This simple model failed to take into account the actual curvature in the low energy part, and we have tested a scenario with
a reflecting and/or absorbing medium. The required values imply very specific geometry or a strong absorption of photons at lower energy. As a second option, we relaxed the constraint on the temperature of seed photons (). Surprisingly, a temperature around 6-7 keV
perfectly reproduces the data.
Finally, we have chosen to describe the spectral emission of V404 Cyg with the following model: a Comptonization component (Comptt), with two free parameters (kT and , temperature and optical depth of the Comptonizing electron population, with
fixed to 6.5 or 7 keV, see Table 1) and a cutoff power law, to account for the high energy part. We fix its photon index to 1.6 and start with a cutoff energy default value of 300 keV.
From Fig. 1, a few periods have ben chosen to illustrate the spectral evolution of V404 Cyg:
(1)First small peak (June 18, 12:11-14:07 UT; 6 ks)
(2)’Off-flare’ state (June 18, 19:02-June 19, 03:29 UT; 25 ks)
(3)Plateau (June 19, 03:31-07:25 UT; 11.5 ks)
(4)First maximum peak (June 19, 07:26-08:23 UT; 3 ks)
(5)Second maximum peak (June 19, 13:19-14:15 UT; 3 ks)
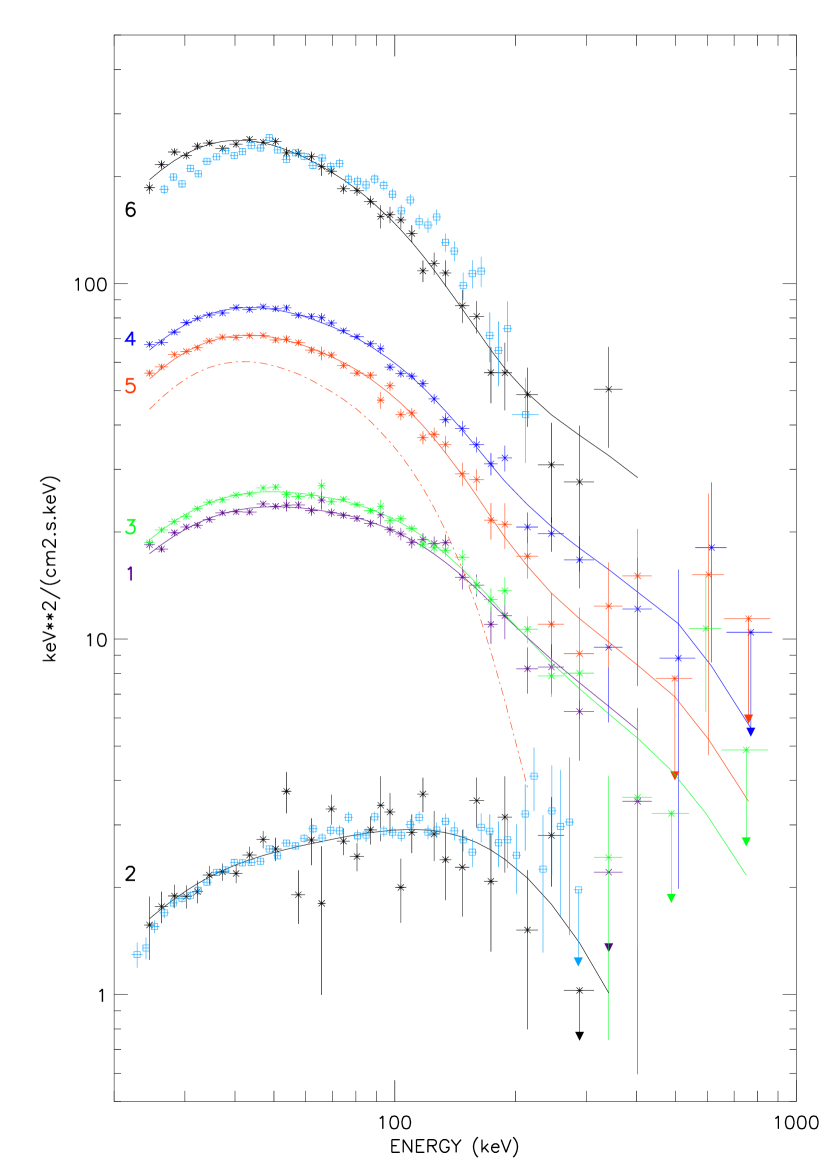
The corresponding spectra are compared in Fig.2. Tab.1 gives the best fit parameter values
when they are fit individually, and the parameters obtained for the averaged spectrum
for comparison. For the low flux periods ([1] and [2]), the cutoff powerlaw component is not required, probably
due to the low signal to noise ratio. Note that these periods are described by a hotter and thiner Comptonizing medium, while the temperature decreases and
the optical depth increases when the source’s flux is high.
In a second step, to overcome the error bars and degeneracy between kT and , we have also fit all the spectra together,
aiming to extract more information with a minimal number of free parameters. We thus started
our fitting procedure by imposing the same parameter values (except normalizations) to all considered spectra, and freed successively, one by one, those required to improve significantly the global . Finally (see Table1), a global reasonable description is obtained with fixed to 7.0 keV and photon index to 1.6, while a common converges toward a value of 1.55. The cutoff energy is fixed to 300 keV for all spectra but the averaged one, which includes a lot of spectral variability, limiting its scientific contents.
The most striking result is that, in such a scheme, the temperature is stable (between 25 and 28 keV), except during the period where the source seems to be less active (period [2]). The spectral emission at that time is harder, and this translates into a Comptonizing temperature of 40-50 keV.
It is worth noting that the high energy component is formally required in the high flux level spectra, and that introducing it in the
moderate flux peak (period [1]) affects the best fit parameters in such a way that they become
compatible with those obtained during the high flux periods (see Tab.1).
Notice also that at shorter timescales, the spectral shape evolution can be described with the same scheme. In Fig.2,
spectrum [6] corresponds to the maximum in a 100 s time bin. When this short specrum is compared to the longer term
spectra, the global shapes appear similar, indicating that low and high energy components evolve
more or less in the same way at all time scales.
This information, together with correlations at other wavelengths, will be crucial to
draw a more complete picture of the emitting regions and their intrinsic evolution.
As a supplementary study, we have considered
a 4.5 keV wide channel centered at 511 keV in order to search for an annihilation emission.
The observed flux remains below 2 for each of the
individual scws, leading to an upper limit of 1-2 ph cm-2 s-1.
When considering the whole revolution (150 ks), we obtain a 2 upper limit of 2 ph cm-2 s-1.
Compared to the values given for other black hole binaries in Teegarden and Watanabe (2006), these upper limits can provide further constraints
for models since they give limits in the case of very high luminosity, and on short timescales.
4. discussion
We are reporting here results obtained in the hard X-ray domain (20 to 650 keV) from the first revolution dedicated
to V404 Cyg by the INTEGRAL mission. While the extreme variability makes it difficult to
get instantaneous values of the parameters of emitting region(s), we studied the source evolution
during the flaring activity to estimate values representative of the global emission.
We have shown that the observed emission can be described with two components.
Several scenarios are able to account for the data, but we had to choose one to present
the results in a way as instructive as possible.
In this work, the first component is identified with a thermal Comptonization emission.
The low energy curvature has required a specific attention. Three parameters can help to describe it properly: An absorbing factor, ,
a reflection factor, R, or the temperature of the seed photons, . However, for each of them, the fit procedure converges toward unusual values:
of the order of a few , in contradiction with the soft X-rays observations (Motta et al., 2015), R 5, which would imply a peculiar geometry or 7 keV. This may be linked to the exceptional source luminosity or reflect the presence of another component at low energy or else another origin of the seed photons. The unceasing variability of the
Comptonizing population parameters, in space and/or in time, may also be responsible for the observed shape, since any gradient in kT or modifies the resulting emission. We give in this paper the results obtained with = 7 keV. The reflection component
is not included since it would add an additional free parameter which cannot be constrained. We have checked that to add a reflection factor (fixed to 1) only slightly modifies the best fit parameter values and does not affect the scientific conclusions.
For the second component, we have chosen a cutoff power law with a photon
index of 1.6 and a cutoff energy of 300 keV, to test a scenario similar to that observed in Cyg X-1 (Jourdain et al., 2012).
With the above hypothesis, we obtain a good description of the data and identify two states.
a) A quiet phase, when the source flux remains relatively low (300 mCrab) and the spectrum hard, with a Comptonization temperature
40 keV. b) An ”active” phase, when the source flares,
with huge variability and impressive amplitude changes, and a plasma temperature around 25 keV.
The second component is not required during the quiet phase and varies significantly during the active phase.
Both components contribute to the global flux intensity, even if their variations are
not strictly correlated, leading to an evolving spectral shape. This suggests that they are due to two different but probably linked mechanisms.
The similarity between V404 Cyg and Cyg X-1 spectral shapes in the high energy domain suggests that the second component could be related to a jet contribution extending from radio up to hard X-rays.
The radio flaring activity reported during the outburst (Mooley et al., 2015) could be used to test this hypothesis.
Polarization measurements could give a decisive answer. However, if the extreme variability of the source also affects the jet component, it could cancel any coherent polarization signal.
In addition, such an exceptional event requires a careful study of the 500 keV energy domain.
In the presented observations,
we did not detect any narrow feature at 511 keV, on the timescales of hours or days. This means that if 511 keV photons are produced, the flux
does not exceed ph cm-2 s-1 (2 ) for a width of 4.5 keV and a total duration of 150 ks.
The large amount of high statistics data from V404 Cyg opens a large domain of new studies: spectral variability over the minute timescale, evolution of the high energy component, timing studies in the hard X-rays/soft gamma-ray domains, etc. This means that what we will learn from this peculiar event will give us a new view of this family of objects.
5. summary and conclusion
The analysis of the V404 Cyg 2015 outburst is still in its early stages. The multiwavelength
campaign triggered by the first observations ensures a huge amount of data.
The hard X-ray domain enlightens the innermost regions of the source and reveals the behavior of the most energetic particles at
work during the flaring activity.
The source emission is satisfactorily described by a hot (40-50 keV) Comptonized component,
with no need for a second component (’quiet state’), or by a cooler Comptonizing plasma
(25-30 keV) plus a second component, possibly related to jet synchrotron emission, which appears above the thermal cutoff (’active state’).
A search for a narrow emission at 511 keV remained unsuccessful, but deeper studies are required to investigate the presence of any broad and/or shifted feature potentially related to the annihilation process.
INTEGRAL has observed this source for 4 weeks. This will allow the polarization to be investigated.
Also, information coming from all wavelengths will have to be correlated to reveal a more complete picture of the source and
understand the physics at work. In conclusion, V404 Cyg offers us, with this exceptional outburst, a unique opportunity
to make a significant breakthrough in both the X-ray transient phenomenon and X-ray binary sytems.
Note: Results on the two next revolutions are reported in Rodriguez et al. (2015), with a different spectral description. All the SPI spectra presented in our paper are made available in a fits format on the site given in footnote 2, in order to allow anybody to test different models.
Acknowledgments
The INTEGRAL SPI project has been completed under the responsibility and leadership of CNES. The Italian co-authors acknowledge the Italian Space Agency (ASI) for financial support under ASI/INAF agreement n. 2013-025-R.0. We are grateful to ASI, CEA, CNES, DLR, ESA, INTA, NASA and OSTC for support.
| Spectrum label | kT | Ecut | |||||
|---|---|---|---|---|---|---|---|
| keV | keV | (dof) | |||||
| Averaged spectrum | 26.4 2 | 1.6 0.2 | 26.0 0.9 | 241 40 | 1.4 0.02 | 1.1 (35) | |
| First small peak [1] (scw 19-20) | 42 5 | 1.1 +0.2 | 43 2.4 | not required | 1.1 (36) | ||
| ”Off-flare” [2] (scw 26-32) | 53 | 1.2 0.5 | 5.7 1.2 | not required | 1.2 (34) | ||
| Plateau [3] (scw 33-36) | 28 3 | 1.6 0.2 | 50.5 4 | 296 80 | 1.7 | 1.4 (35) | |
| first Maximum (scw 37) [4] | 21 2 | 1.9 0.2 | 174 6 | 189 | 8 1.6 | 1.23 (35) | |
| 2nd Maximum (scw 43) [5] | 23 2 | 1.7 0.2 | 156 7 | 189 40 | 5.4 1.8 | 1.0 (35) | |
| == | common fit | == | |||||
| Averaged spectrum | 27.8 1 | 1.55 0.1 | 25.9 0.3 | 242 20 | 1.3 0.03 | 1.2 (37) | |
| First small peak [1] (scw 19-20) | ” | ” | 42.5 1.2 | 300 (fix) | 1.9 0.1 | 1.1 (38) | |
| ”Off-flare” [2] (scw 26-32) | 43 4 | ” | 4.9 1.3 | ” | 0.2 0.1 | 1.2 (34) | |
| Plateau [3] (scw 33-36) | idem [1] | ” | 50 1.3 | ” | 1.8 0.07 | 1.3 (38) | |
| Maximum (scw 37) [4] | 25 1 | ” | 183.8 1.8 | ” | 4.3 0.15 | 1.3 (38) | |
| 2nd Maximum (scw 43) [5] | ” | ” | 164.4 1.9 | ” | 2.6 0.16 | 1.4 (38) | |
| == | 100s timescale | == | |||||
| 100s Max bin [6] | 22.5 1 | 1.55 (fix) | 680 12 | 300 (fix) | 9.8 1 | 0.93 (36) |
Note. — Parameters obtained for the individual spectra displayed in Fig.2. Top: Each spectrum is fit individually. Bottom: Spectra are fit simultaneously, with some parameters forced to be equal, to have the minimum of free parameters. The is fixed to 7 keV, except for [1] which requires a value of 6.5 keV. Photon index of the cutoff power law component is fixed to 1.6.
∗ For the Comptonization component ∗∗ Cutoff powerlaw normalisation at 1 keV.
References
- Arnaud et al. (1996) Arnaud, K., 1996, Astron. Soc. of the Pacific Conf. Series, Vol. 101, Astron. Data Analysis Software and Systems V, ed.G. H. Jacoby & J. Barnes, 17
- Barthelmy et al. (2015) Barthelmy, S. D., D’Ai, A., D’Avanzo, P. et al., 2015, GCN 17929
- Casares et al. (1992) Casares, J., Charles, P. A., and Naylor, T., 1992, Nat, 355, 614
- Jourdain et al. (2012) Jourdain, E., Roques, J. P., M. Chauvin, M. and Clark, D. J., 2012, ApJ, 761, 27
- Makino et al. (1989) Makino, F., et al. 1989, IAU Circ. 4782 & 4786
- Natalucci et al. (2015) Natalucci, L. , Fiocchi, M., Bazzano, A. et al, 2015, ApJ, accepted
- Miller-Jones et al. (2009) Miller-Jones, J. C. A., Jonker, P. G., Dhawan, V., et al., 2009, ApJ, 706, L230
- Mooley et al. (2015) Mooley, K., Fender, R., Anderson, G, et al., 2105, ATel 7658
- Motta et al. (2015) Motta, S., Beardmore, A., Oates, S. et al., 2015, ATel 7665
- Rodriguez et al. (2015) Rodriguez, J., Cadolle Bel, M., Alfonso-Garzón, J., 2015, A&A, 581, L9
- Roques et al. (1994) Roques, J.P., Bouchet, L. Jourdain, E., et al, 1994, ApJS, 92, 4a51
- Roques et al. (2003) Roques, J.P., Schanne, S., Von Kienlin A., et al, 2003, A&A, 411, L91
- Syunyaev et al. (1991) Syunyaev, R. A., Kaniovskii, A. S., Efremov, V. A. et al., 1991, soviet astron. Lett., 17, 123
- Teegarden (2006) Teegarden, B. J. & Watanabe, K. 2006, ApJ, 646, 965
- Ubertini et al. (2003) Ubertini, P., Lebrun, F., Di Cocco, G., et al., 2003, A&A, 411, L131
- Vedrenne et al. (2003) Vedrenne, G., Roques, J.P., Schonfelder, V. et al, 2003, A&A, 411, L63
- Younes et al. (2015) Younes G. A. on behalf of the Fermi GBM Team, 2015, GCN 17932