Measurement of [HDCO]/[H2CO] Ratios in the Envelopes of Extremely Cold Protostars in Orion
Abstract
We present observations of HDCO and H2CO emission toward a sample of 15 Class 0 protostars in the Orion A and B clouds. Of these, eleven protostars are Herschel-identified PACS Bright Red Sources (PBRS) and four are previously identified protostars. Our observations revealed the chemical properties of the PBRS envelope for the first time. The column densities of HDCO and H2CO are derived from single dish observations at an angular resolution of 20 (8400 AU). The degree of deuteration in H2CO ([HDCO]/[H2CO]) was estimated to range from 0.03 to 0.31. The deuterium fractionation of most PBRS (70%) is similar to that of the non-PBRS sources. Three PBRS (30%) exhibit high deuterium fractionation, larger than 0.15. The large variation of the deuterium fractionation of H2CO in the whole PBRS sample may reflect the diversity in the initial conditions of star forming cores. There is no clear correlation between the [HDCO]/[H2CO] ratio and the evolutionary sequence of protostars.
1 Introduction
Observing deuterated species is useful for probing the physical and chemical conditions of star-forming regions (Roberts & Millar, 2000b; Caselli et al., 2002; Roueff & Gerin, 2003; Crapsi et al., 2005; Tatematsu et al., 2010; Fontani et al., 2011; Caselli & Ceccarelli, 2012; Sakai et al., 2012). The deuterium to hydrogen (D/H) ratio in the local interstellar medium is low, about , which is the D/H elemental abundance as predicted by the nucleosynthesis (Linsky, 2003). By contrast, higher molecular D/H ratios have been observed from objects associated with star formation, such as molecular clouds (Loren & Wootten, 1985; Turner, 2001; Parise et al., 2009; Bergman et al., 2011), pre-stellar cores (Bacmann et al., 2003; Crapsi et al., 2005; Fontani et al., 2008), and protostellar cores (Ceccarelli et al., 1998; Loinard et al., 2002; Emprechtinger et al., 2009). Many observations and chemical models showed that deuterium-bearing molecules are enhanced during the cold prestellar core phase and released into the gas when a heating event, such as the formation of a protostar or the passage of a shock, evaporates the ice (Tielens, 1983; Rodgers & Millar, 1996; Ceccarelli et al., 2001; Bacmann et al., 2003; Maret et al., 2004; Cazaux et al., 2011; Taquet et al., 2012; Awad et al., 2014; Fontani et al., 2014).
Formaldehyde (H2CO) is one of the key species in the synthesis of more complex organic molecules. The H2CO lines are ubiquitous in the interstellar medium and used to infer temperature and density of gas (Mangum & Wootten, 1993; Ceccarelli et al., 2003). There have been debates on the dominant formation mechanism of deuterated H2CO: whether singly or doubly deuterated species (HDCO or D2CO) of formaldehyde form via active grain surface chemistry (Tielens, 1983; Turner, 1990; Ceccarelli et al., 2001; Loinard et al., 2001; Fontani et al., 2015) or gas-phase reactions (Langer et al., 1979; Roberts & Millar, 2000a; Parise et al., 2009). Codella et al. (2012) investigated deuteration in the protostellar outflow shock of L1157-B1. They concluded that the measured deuterium fractionation provides a fossil record of the gas before it was shocked by the jet driven by the protostar. They noted that the deuteration ratios derived from the outer part of the L1157 dense envelope (L1157-B1) are smaller than the ratios derived from the IRAS 16293-2422 spectra which is close to the protostar, where the density is expected to be higher. Recently, high resolution observations with a 2 resolution toward L1157-B1 showed that the emission of HDCO was detected mostly from the region of interface between the ambient material and the shock driven by active outflow from a low-mass Class 0 protostar L1157-mm (Fontani et al., 2014). The deuterated fraction [HDCO]/[H2CO] of 0.1 was measured in the HDCO emitting region. These observations confirmed that deuterated molecules are formed on the grain surface and released into gas phase by the shocks.
The Orion molecular cloud complex is one of the nearest active star-forming regions at a distance of 420 pc (Hirota et al., 2007; Kim et al., 2008; Menten et al., 2007). Stutz et al. (2013) discovered and characterized the PACS Bright Red Sources (PBRS) in Orion. Selected to have extremely red 70 µm to 24 µm colors (log(), the PBRS have K and . They are colder than the typical Class 0 protostars in Orion. Stutz et al. (2013) proposed that the PBRS may be the youngest protostars identified and characterized to date, with relatively high envelope densities. The PBRS are, therefore, ideal objects for investigating the earliest stage of protostellar evolution. The aim of this work is to investigate whether the youngest Class 0 objects, PBRS, are different from non-PBRS Class 0 protostars, by comparing the deuterated levels of H2CO.
In this paper, we report the observations of the selected protostars in the H2CO transition and the HDCO and transitions with two antennas of the Korean Very Long Baseline Interferometry Network (KVN) used in the single-dish mode. We describe source selection and details of our KVN observations in Section 2. The main observational results are presented in Section 3. In Section 4 we derive the physical properties. In Section 5 we discuss the deuterium fractionation of protostars. A summary is given in Section 6.
2 Source Selection and Observations
| SourceaaIn case of having two source IDs, we use the PBRS ID in the text. | R.A. | Declination | bbUncertainties in and are 15% (Stutz et al., 2013). | bbUncertainties in and are 15% (Stutz et al., 2013). | Field | |
|---|---|---|---|---|---|---|
| HOPS ID | PBRS ID | (h:m:s) | () | (K) | () | |
| PBRS | ||||||
| 398 | 119019 | 05:40:58.4 | 08:05:36.1 | 34 | 1.6 | L1641 |
| 169 | 05:36:36.0 | 06:38:54.0 | 35 | 4.5 | L1641 | |
| 400 | 082005 | 05:41:29.4 | 02:21:17.1 | 29 | 1.0 | NGC 2024 |
| 403 | 090003 | 05:42:45.2 | 01:16:14.2 | 36 | 2.7 | NGC 2024 |
| 358 | 05:46:07.2 | 00:13:30.9 | 44 | 30.6 | NGC 2068 | |
| 373 | 05:46:30.7 | 00:02:36.8 | 36 | 5.2 | NGC 2068 | |
| 404 | 093005 | 05:46:27.7 | 00:00:53.8 | 31 | 1.7 | NGC 2068 |
| 359 | 05:47:24.8 | 00:20:58.2 | 39 | 12.6 | NGC 2068 | |
| 341 | 05:47:00.9 | 00:26:20.8 | 36 | 3.6 | NGC 2068 | |
| 405 | 097002 | 05:48:07.7 | 00:33:50.8 | 33 | 1.1 | NGC 2068 |
| 354 | 05:54:24.1 | 01:44:20.2 | 37 | 7.5 | L1622 | |
| Non-PBRScc and of non-PBRS are from A. Stutz (private communication) and Furlan et al. (2015, in preparation). | ||||||
| 164 | 05:37:00.5 | 06:37:10.5 | 50 | 0.6 | L1641 | |
| 297 | 05:41:23.3 | 02:17:35.8 | 46 | 1.0 | NGC 2024 | |
| 321 | 05:46:33.2 | 00:00:02.2 | 74 | 4.6 | NGC 2068 | |
| 360 | 05:47:27.1 | 00:20:33.1 | 36 | 2.2 | NGC 2068 | |
| Transition | Rest frequency | aaMean system temperature | |||
|---|---|---|---|---|---|
| (GHz) | (s-1) | (K) | KUS, KYS | (K) | |
| HDCO | 128.812865 | 3.1 | 0.30, 0.33 | 240 | |
| HDCO | 134.284909 | 11.2 | 0.28, 0.31 | 230 | |
| H2CO | 140.839520 | 15.2 | 0.25, 0.28 | 300 |
The Herschel Orion Protostar Survey (HOPS) is a Herschel Open Time Key Program targeting about 300 Spitzer-identified protostars with PACS 70 µm and 160 µm photometry and a subset of 30 protostars with PACS spectroscopy (Fischer et al., 2010; Manoj et al., 2013; Stutz et al., 2013). Stutz et al. (2013) found 18 PBRS in the Orion molecular clouds using Herschel scan-map observations toward a subset of the HOPS fields. We selected 11 isolated PBRS that are situated away from other protostars to avoid confusion in the KVN beam (20″). For comparison, we added 4 non-PBRS HOPS targets, located in the vicinity of the PBRS targets, to the sample. The non-PBRS targets were selected based on their bolometric temperature and distance to the PBRS targets. They are located in the L1641, NGC 2024, and NGC 2068 fields of Orion, where most of the PBRS targets are also located. The number of non-PBRS targets was limited by the available observing time. Both PBRS and non-PBRS targets are taken from the HOPS sample. The coordinates and physical parameters of the selected sources are listed in Table 1.
Observations were made with the KVN 21 m antennas in the single-dish telescope mode during the 2013 observing season, with the KVN Yonsei antenna at Seoul in 2013 September–October and the KVN Ulsan antenna in 2013 November–December. The telescope pointing was checked once every two hours by observing Orion IRc2 (Baudry et al., 1995) in the SiO maser line and was good within 5″. The antenna temperature was calibrated by the standard chopper-wheel method.
We used the spectrometer with a bandwidth of 64 MHz and 4096 channels, which gives a spectral channel width of 15.625 kHz. Table 2 lists the parameters of the observed lines. The spectrometer setting gives a velocity channel width of 0.036 km s-1, 0.035 km s-1, and 0.033 km s-1 for HDCO , HDCO , and H2CO , respectively. For all lines, Hanning smoothing was applied three times. The half power beam width is about 20″. Quantization correction factor (1.25) and sideband separation efficiency (0.8 for the KVN Ulsan 129 GHz band) were applied to the KVN raw data. The data acquired in the antenna temperature scale, , were converted to the main beam temperatures scale, , using the main beam efficiencies () in Table 2. The data were processed with the GILDAS/CLASS software from Institute de RadioAstronomie Millimétrique (http://www.iram.fr/IRAMFR/GILDAS).
3 Results

| Source | H2CO | HDCO | HDCO | ||||||
|---|---|---|---|---|---|---|---|---|---|
| (K km s-1) | (km s-1) | (km s-1) | (K km s-1) | (km s-1) | (km s-1) | (K km s-1) | (km s-1) | (km s-1) | |
| 119019 | 3.07 0.16 | 5.13 0.04 | 1.74 0.11 | 0.29 0.03 | 5.11 0.03 | 0.53 0.06 | 0.39 0.06 | 4.93 0.07 | 0.93 0.17 |
| HOPS 169 | 4.02 0.16 | 6.99 0.03 | 1.36 0.06 | 0.65 0.07 | 6.99 0.05 | 0.99 0.13 | |||
| 082005 | 6.66 0.10 | 9.66 0.02 | 2.08 0.04 | 0.37 0.06 | 10.10 0.12 | 1.54 0.27 | |||
| 090003 | 0.86 0.05 | 8.42 0.01 | 0.45 0.02 | 0.37 0.04 | 8.50 0.03 | 0.53 0.07 | |||
| HOPS 358 | 7.27 0.20 | 10.09 0.03 | 2.21 0.08 | 0.86 0.04 | 10.18 0.03 | 1.31 0.07 | 0.18 0.05 | 10.12 0.06 | 0.47 0.18 |
| HOPS 373aaHOPS 373 shows an outflow feature. This table lists the parameters for the narrow component. The integrated intensity, centroid velocity, and line width for the line wing component are 13.31 0.34 K km s-1, 10.02 0.09 km s-1, and 7.75 0.22 km s-1, respectively. | 2.36 0.13 | 10.28 0.02 | 0.76 0.04 | 0.70 0.06 | 10.33 0.03 | 0.81 0.08 | 0.17 0.07 | 10.33 0.09 | 0.36 0.12 |
| 093005 | 10.58 0.15 | 10.23 0.01 | 1.84 0.03 | 0.67 0.05 | 10.04 0.05 | 1.09 0.11 | 0.39 0.05 | 9.90 0.06 | 0.86 0.13 |
| HOPS 359 | 6.28 0.27 | 9.63 0.04 | 2.12 0.11 | 0.96 0.06 | 9.39 0.04 | 1.23 0.08 | 0.37 0.09 | 9.35 0.07 | 0.71 0.22 |
| HOPS 341 | 4.01 0.12 | 9.67 0.02 | 1.31 0.05 | 0.40 0.03 | 9.75 0.02 | 0.58 0.05 | |||
| 097002 | 0.83 0.04 | 9.58 0.01 | 0.53 0.03 | 0.22 0.04 | 9.48 0.05 | 0.64 0.14 | 0.31 0.06 | 10.00 0.08 | 0.74 0.13 |
| HOPS 354 | 6.03 0.16 | 1.03 0.03 | 2.58 0.08 | 0.61 0.06 | 0.95 0.04 | 0.94 0.10 | 0.49 0.09 | 1.11 0.18 | 1.70 0.30 |
| HOPS 164 | 4.20 0.13 | 5.84 0.02 | 1.24 0.04 | 0.46 0.05 | 5.89 0.04 | 0.74 0.11 | |||
| HOPS 297 | 4.07 0.19 | 9.95 0.05 | 2.33 0.12 | 0.37 0.05 | 9.50 0.07 | 1.10 0.20 | |||
| HOPS 321 | 4.30 0.16 | 10.22 0.03 | 1.65 0.08 | 0.20 0.03 | 10.19 0.04 | 0.52 0.12 | |||
| HOPS 360 | 4.64 0.14 | 9.31 0.03 | 1.98 0.07 | 0.56 0.07 | 9.35 0.11 | 1.73 0.24 | |||
Note. — The calibration uncertainty of 10% is not included (Lee et al., 2011).
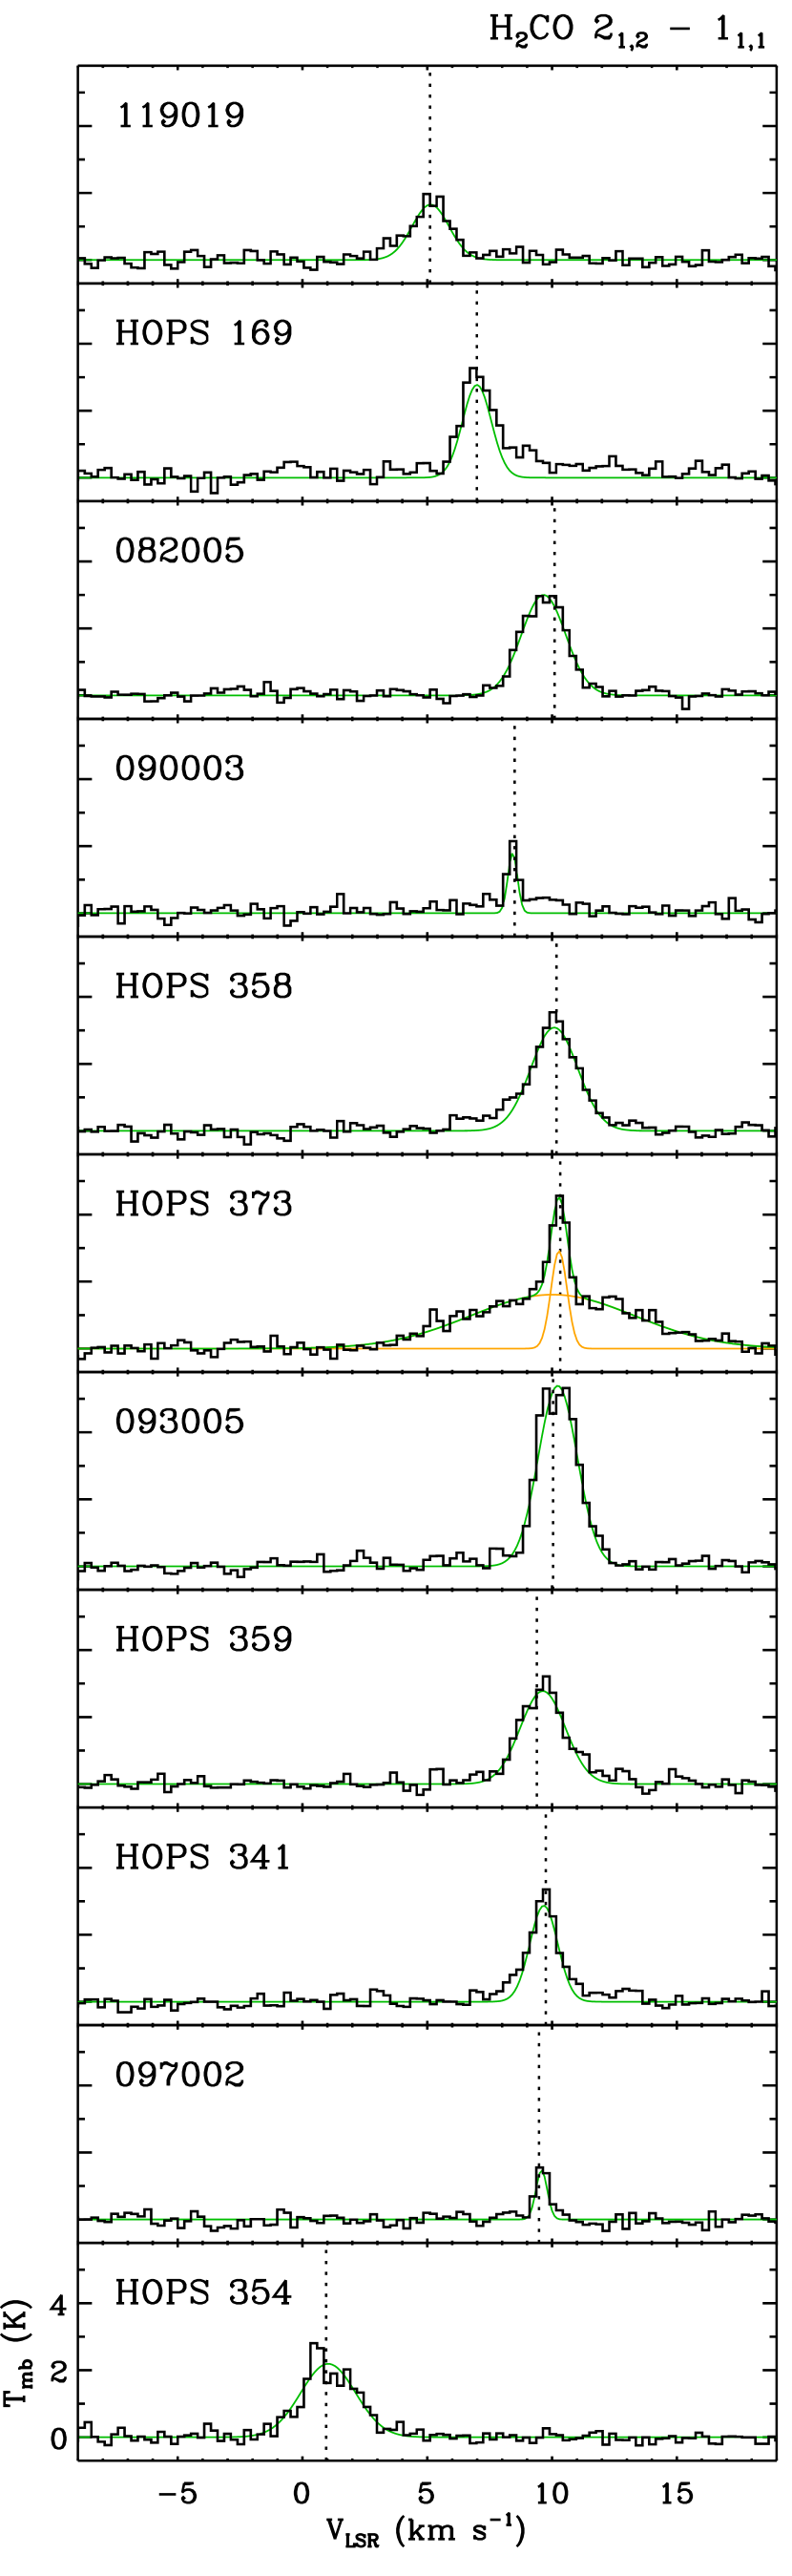
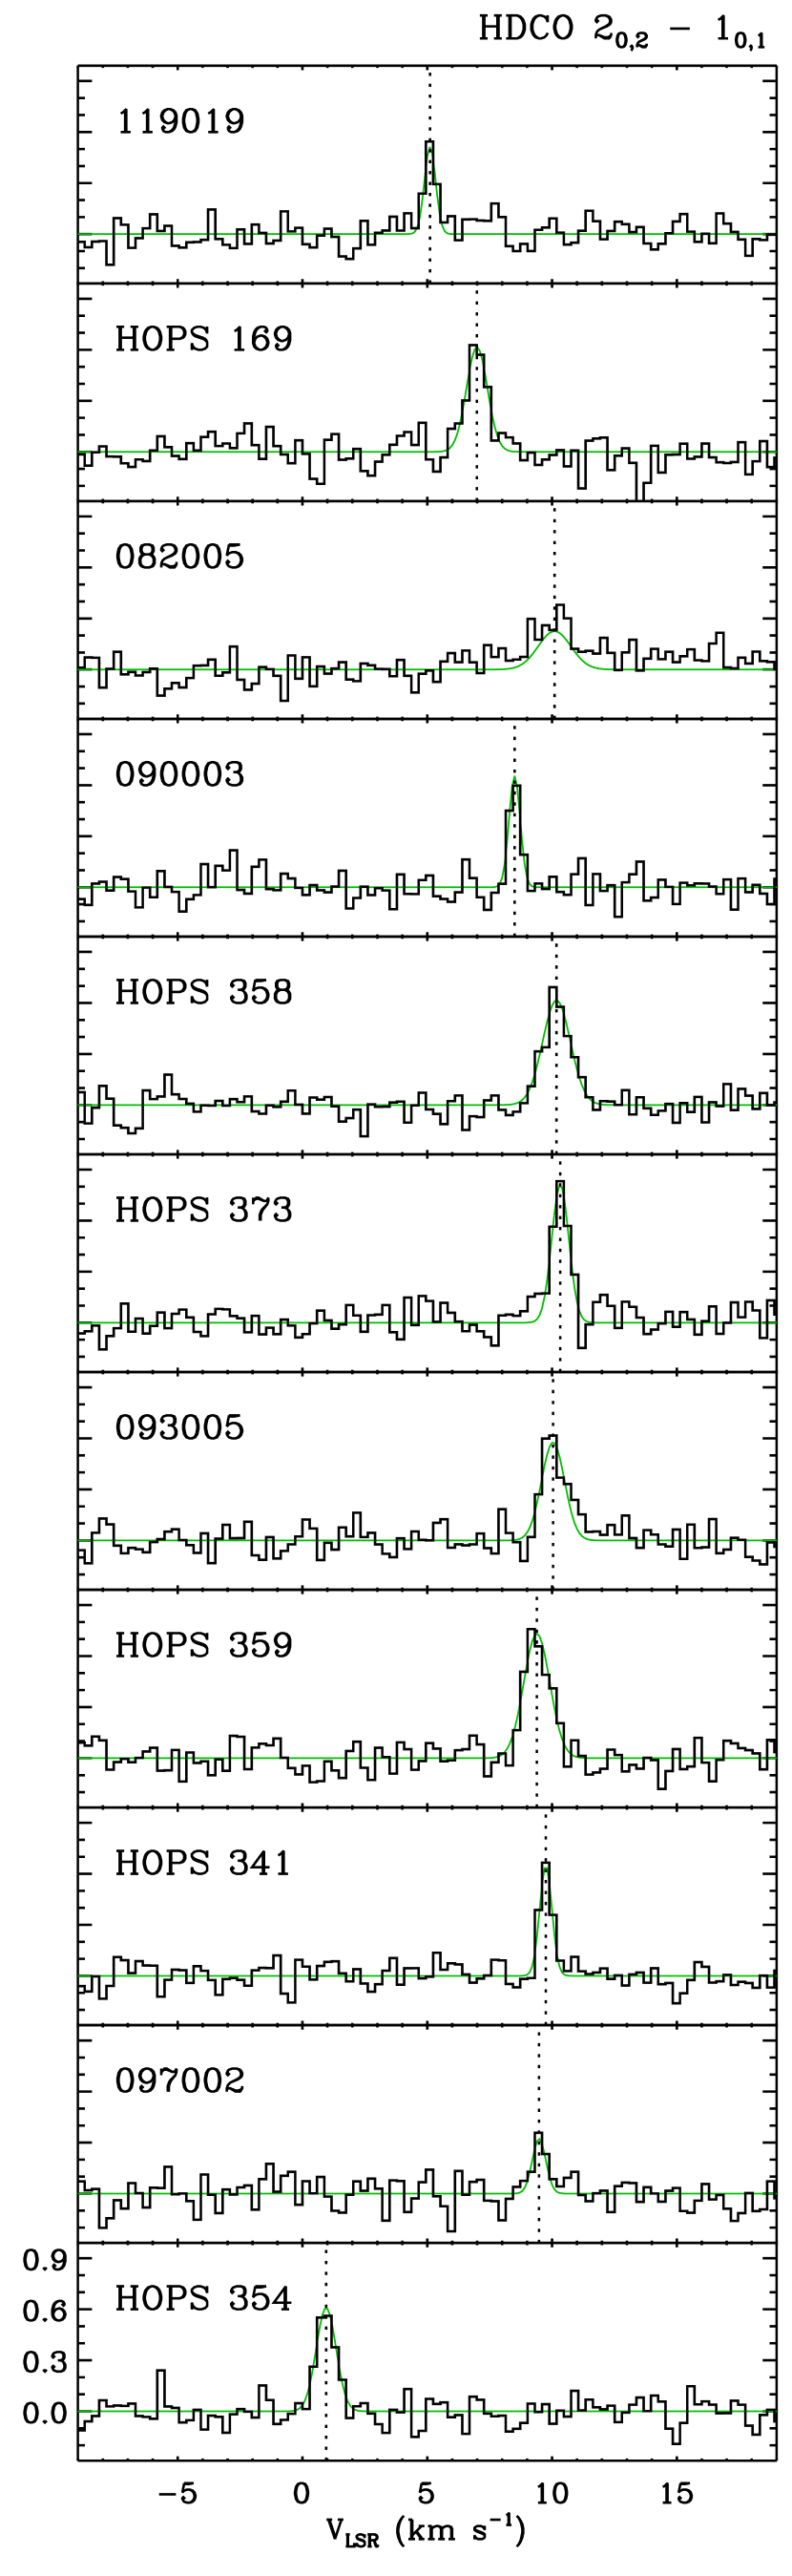
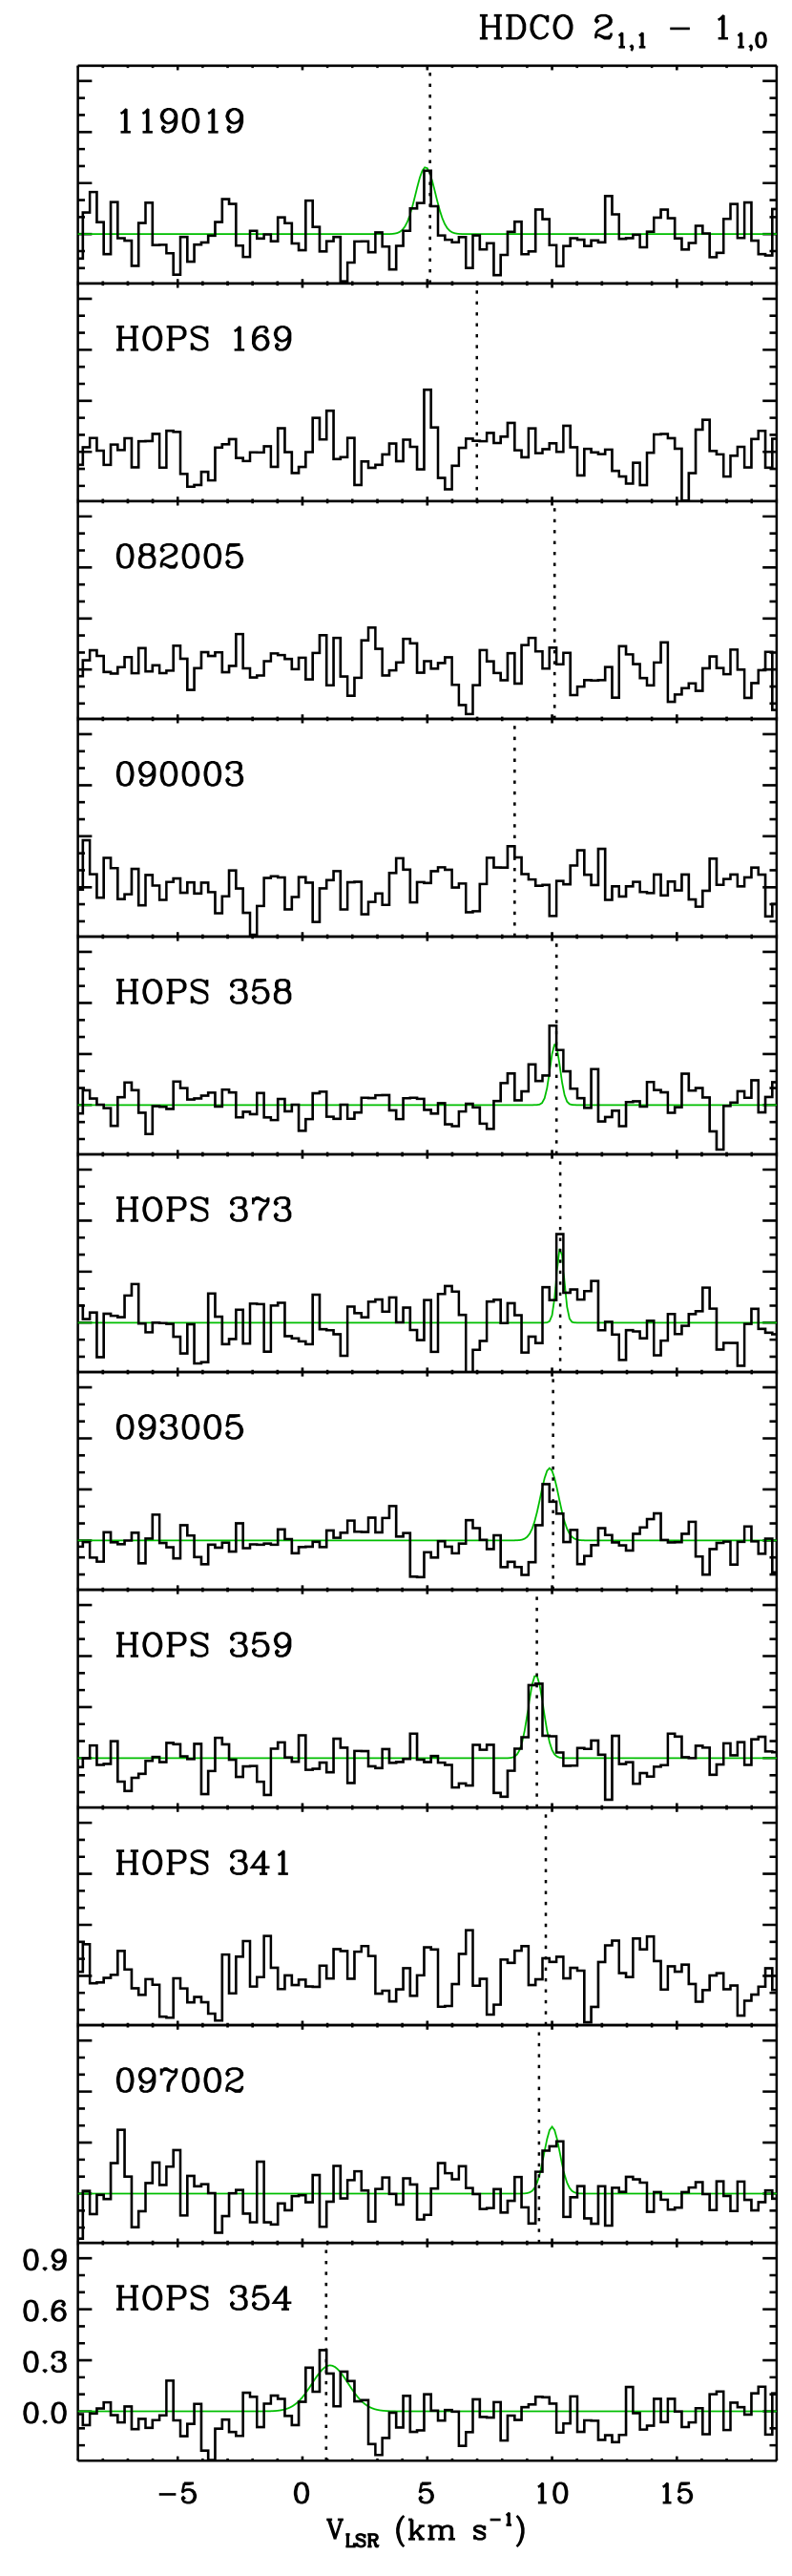
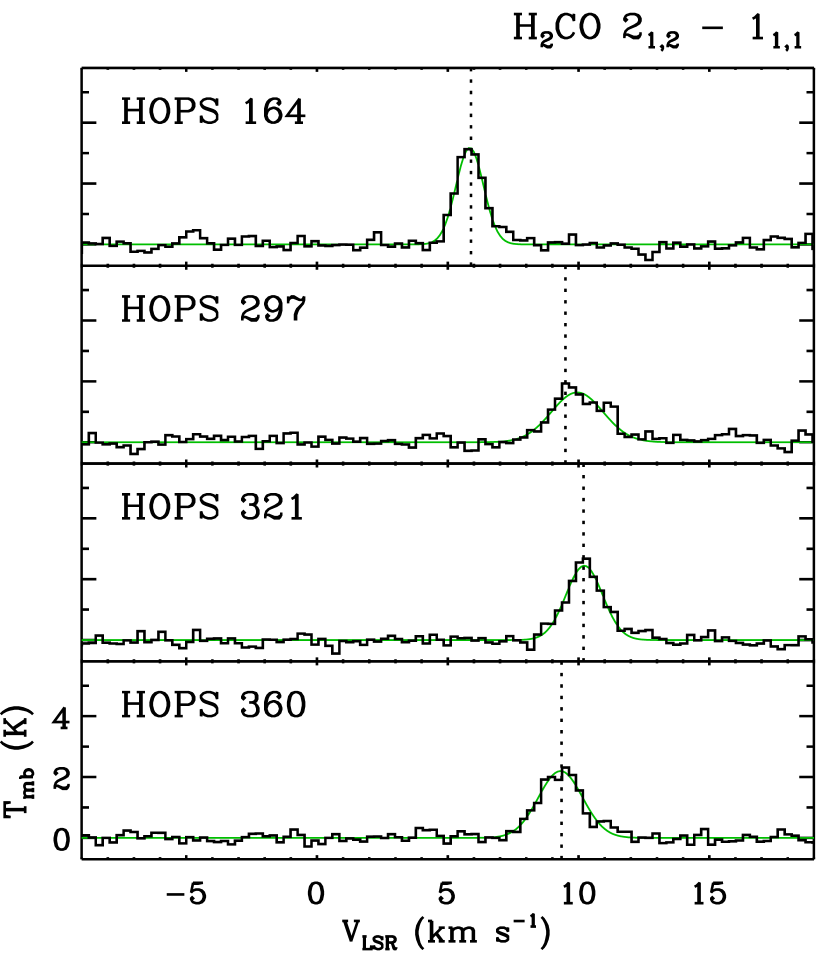
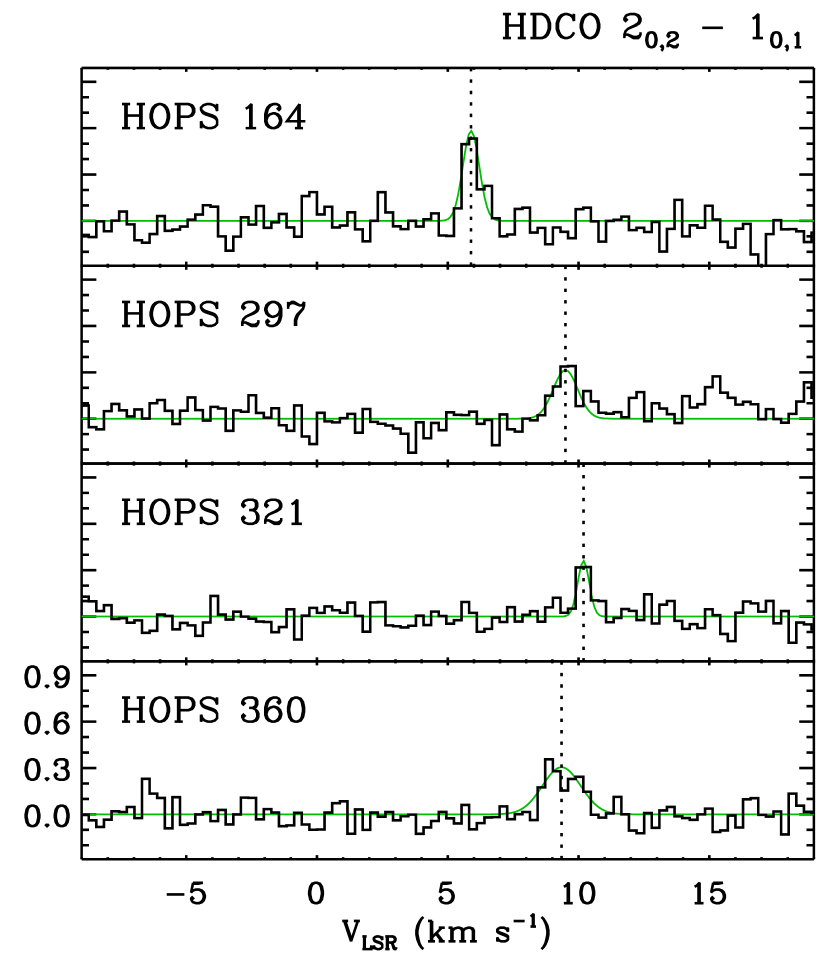
The observed H2CO , HDCO , and line spectra are shown in Figure 1 for PBRS and Figure 2 for non-PBRS. The results of the observations are summarized in Table 3, including integrated intensities, centroid velocities, and line widths derived by Gaussian fits to the spectra.
H2CO emission was detected toward all targets. The line widths of all sources are smaller than 3 km s-1. Two PBRS, 090003 and 097002, have quite small line widths, about 0.5 km s-1. Several sources with relatively large line widths show flat top spectra, indicating either large optical depths or overlap of multiple components. For example, the H2CO spectrum of 093005 shows double peaks. Since the velocity of the central dip corresponds to the peak velocity of the HDCO spectrum, we prefer the interpretation of a large optical depth. HOPS 373 drives a CO outflow (Gibb & Little, 2000), and the H2CO spectrum shows broad line wings extending to large velocities. For HOPS 373, we applied a two-component Gaussian fit and used the parameters derived from the narrow component, which allows us to focus on the emission arising from the envelope of the protostar.
HDCO emission was detected toward all sources. Line widths of the HDCO transition are narrower than those of the H2CO transition. The narrow lines emitted by the deuterated formaldehyde suggest that the emission is optically thin and dominated by the cold outer envelopes of the protostars. HDCO emission was detected toward seven PBRS. The qualities of the HDCO spectra toward 119019, 097002, and HOPS 354 are relatively poor. Spectral baselines (line free channels) of these sources seem to be worse than the other cases. The HDCO emission of 097002 may be a non-detection, because the line is placed at a peak velocity slightly different from that of the other transitions detected toward this source.
4 Analysis
4.1 H2CO column density
We calculate the column densities of H2CO. Assuming that the line is optically thin and the source size is similar to the main beam size, the column density in a lower state (defined as energy level ) can be obtained by
| (1) |
where is the Planck’s constant, the Boltzmann’s constant, the frequency of the transition in GHz, the excitation temperature, the statistical weight, the Einstein coefficient in s-1, the integrated line intensity, and the velocity in km s-1 (Rohlfs & Wilson, 1999). The column density is in cm-2, and the numerical factor in the equation corresponds to 8/ and a conversion factor, when it is expressed in the units given above. All parameters for molecules were taken from the JPL databases (Pickett et al., 1998). Some sources may have moderate optical depths as suggested in Section 3, and they are discussed in Section 4.4.
The total column density of ortho-H2CO, , is related to the column density, , in the lower state by
| (2) |
where is the statistical weight ( for ortho-H2CO), the energy of a level, and the partition function. If the molecules follow the Boltzmann distribution of a single , the partition function is
| (3) |
For ortho-H2CO, can only be odd. The total H2CO column densities are calculated assuming an excitation temperature of 10 K and the statistical ortho to para ratio of 3:1 (Minh et al., 1995; Guzmán et al., 2013). The resulting column densities are given in Table 4. The column densities are not very sensitive to the assumed excitation temperature, when 10 K (Roberts et al., 2002). Using an excitation temperature of 30 K or 50 K changes the inferred column densities by a factor of about 2.2 or 3.7, respectively. For example, if we calculate column densities of H2CO adopting K for 090003 and HOPS 341, their column densities become and cm-2, respectively. Indeed, we estimate 14 K from those sources with detections of both HDCO transitions (Section 4.3). Therefore, the assumption of = 10 K is reasonable.
| Source | (H2CO) | (HDCO) | [HDCO]/[H2CO] |
|---|---|---|---|
| () | () | ||
| 119019 | 11.7 1.3 | 0.79 0.11 | 0.07 0.01 |
| HOPS 169 | 15.3 1.6 | 1.76 0.26 | 0.12 0.02 |
| 082005 | 25.3 2.6 | 1.00 0.19 | 0.04 0.01 |
| 090003 | 3.3 0.4 | 1.00 0.15 | 0.31 0.06 |
| HOPS 358 | 27.6 2.9 | 2.33 0.26 | 0.08 0.01 |
| HOPS 373 | 9.0 1.0 | 1.90 0.25 | 0.21 0.04 |
| 093005 | 40.2 4.1 | 1.82 0.23 | 0.05 0.01 |
| HOPS 359 | 23.9 2.6 | 2.61 0.31 | 0.11 0.02 |
| HOPS 341 | 15.3 1.6 | 1.09 0.14 | 0.07 0.01 |
| 097002 | 3.2 0.4 | 0.60 0.12 | 0.19 0.04 |
| HOPS 354 | 23.0 2.4 | 1.65 0.23 | 0.07 0.01 |
| HOPS 164 | 16.0 1.7 | 1.25 0.18 | 0.08 0.01 |
| HOPS 297 | 15.5 1.7 | 1.00 0.17 | 0.06 0.01 |
| HOPS 321 | 16.4 1.7 | 0.54 0.10 | 0.03 0.01 |
| HOPS 360 | 17.6 1.8 | 1.52 0.24 | 0.09 0.02 |
4.2 HDCO column density
HDCO is a nearly symmetric top molecule. Therefore, the treatment for calculating column density is similar to the case of H2CO. However, there is no H-pair, so there is no ortho/para modification. While H2CO has electric dipole moment along the A axis only, HDCO has an extra dipole moment along the B axis. As a result, transitions between K ladders are allowed, and all K ladders are radiatively connected. HDCO lines have hyperfine structures (Langer et al., 1979). For the HDCO transition, the central group (2 components) dominates in intensity, and the velocity separation from center to satellites is km s-1. The hyperfine components are not expected to be resolved, but they can make the line look wide. For the purpose of column density calculations, we ignore the effects of hyperfine structure. We use (2.324 Debye) for , since we are interested in the transitions in a K ladder (a type). The statistical weight has a rotation contribution only, . The HDCO transition is optically thin because deuterated species are 10–100 times less abundant than the main species.
The total HDCO column density is calculated by assuming an excitation temperature of 10 K and optically thin line (Table 4). If we use 30 K or 50 K, the HDCO column densities change by a factor of about 3.4 or 6.7, respectively. The [HDCO]/[H2CO] ratios change by a factor of about 1.6 or 1.8, respectively.
4.3 Excitation temperature
| Source | aaThe line ratio of the HDCO and transitions. | bbN: cannot be determined because RT 3/4. The qualities of their HDCO spectra are relatively poor (Figure 1). |
|---|---|---|
| (K) | ||
| 119019 | 1.34 | N |
| HOPS 358 | 0.21 | 6 ( 1) |
| HOPS 373 | 0.24 | 7 ( 3) |
| 093005 | 0.58 | 31 (18) |
| HOPS 359 | 0.39 | 12 ( 4) |
| 097002 | 1.41 | N |
| HOPS 354 | 0.80 | N |
We calculated the excitation temperature using the line ratio of the HDCO = and transitions, assuming that they have the same excitation temperature. Because the quantum numbers are the same, factors depending on are common factors in calculating the column density ratio. The column density ratio, ignoring the common factors, is
| (4) |
where is the line ratio. Because the frequencies are very similar, the right exponential factor after is nearly 1. The column density ratio should be the same as the ratio of partition terms, and here the statistical weight cancel out since only depends on .
| (5) |
Since K and K, the excitation temperature is,
| (6) |
In our observations, seven sources are detected in both transitions. When the line ratio is close to 0.75, diverges. The excitation temperatures are summarized in Table 5. We obtained an average excitation temperature of 14 5 K. Therefore, the K used in the column density calculations is consistent with the measured .
4.4 Optical depths and line widths

The assumption of optically thin line is reasonable for the lines of the deuterated molecules based on their low abundances. However, the optical depth of the H2CO transition can be high because H2CO is abundant in molecular clouds. The optical depth of the H2CO line can be estimated by comparing the fluxes between H2CO and its isotopologue for the same transition. Unfortunately, our survey did not cover observations of the H213CO line. Though a direct measurement of the optical depth () is not available, we have roughly estimated the line optical depths using the solution of the line radiative transfer equation.
| (7) |
where is the peak temperature, and are the equivalent Rayleigh-Jeans excitation and background temperatures, respectively. The optical depths estimated in this way are between 0.3 to 1.9. In other studies, the optical depths of 0.4–1.1 were estimated from low-mass protostars (e.g., Maret et al., 2004) and 1.6 from the dense core in the Horsehead PDR (Guzmán et al., 2011), based on the flux ratio of the H2CO and H213CO transition. Larger line width is also known to be coupled with larger line optical depth (Phillips et al., 1979; Roberts et al., 2002; Ceccarelli et al., 2003). In Figure 3, we compare the line widths of H2CO and HDCO . Most sources with large H2CO line widths do not show a good agreement, which is likely due to the optical depth in the H2CO transition. Considering the optical depth of the H2CO estimated from our calculation, the column density of H2CO should be corrected by a factor of , then (H2CO) increases by a factor of 1.1 for and 2.2 for .
5 Discussion
5.1 Deuterium fractionation
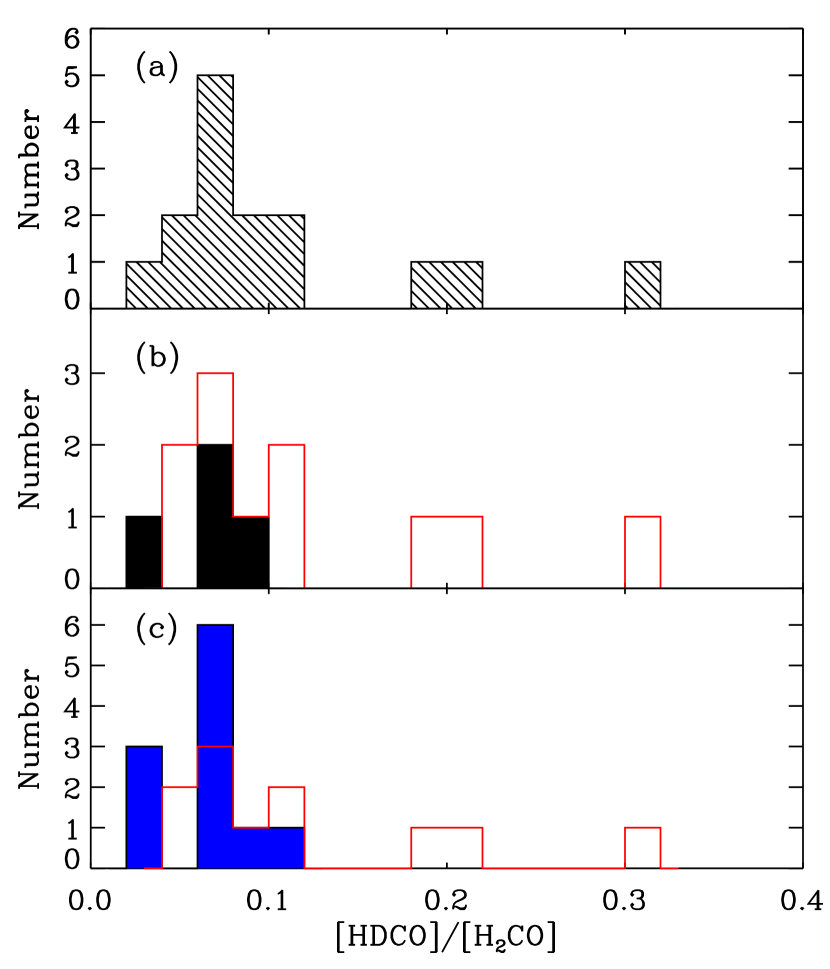
The last column of Table 4 lists [HDCO]/[H2CO] ratios calculated assuming = 10 K. This ratio is not very sensitive to (Section 4.2). The [HDCO]/[H2CO] ratio ranges from 0.03 to 0.31, which is consistent with values derived from the low-mass Class 0 protostars by Parise et al. (2006). The average [HDCO]/[H2CO] ratio and standard deviation of the total target sample are 0.105 and 0.075, respectively. Figure 4(a) shows the distribution of the [HDCO]/[H2CO] ratios for the full sample. Considering that the ratio is always positive and that the distribution is asymmetric, the distribution can be characterized better with the mode than the average. The mode value and FWHM are 0.07 and 0.02, respectively. The [HDCO]/[H2CO] ratios of the three PBRS on the high end (090003, HOPS 373, and 097002) are significantly larger than the mode value. They may represent either a long tail of a unimodal distribution or a secondary peak of a bimodal distribution. More extensive studies are necessary to understand the detailed shape of the distribution.
Figure 4(b) shows the [HDCO]/[H2CO] distributions for the PBRS and non-PBRS samples separately. About 30% of PBRS (3/11) have high [HDCO]/[H2CO] ratios (), and 70% of PBRS (8/11) have ratios similar to non-PBRS. Both PBRS and non-PBRS have the same mode (0.07) as the full sample.
Since the number of non-PBRS sources are relatively small, the [HDCO]/[H2CO] ratios of Class 0 sources measured by Roberts et al. (2002) may be helpful in understanding the distributions. Figure 4(c) shows the [HDCO]/[H2CO] distribution of non-PBRS sources, including 7 sources from Roberts et al. (2002). The general properties of the distribution remain the same. The mode is 0.07, and the range of values is less than 0.12, which reinforces the finding that the PBRS distribution has a relatively large dispersion and that the three PBRS on the high end are outliers. However, note that five sources in the sample of Roberts et al. (2002) are in regions closer than the Orion cloud, which could introduce some unexpected effects to the distribution. Therefore, a more extensive survey with a larger sample size will be helpful in understanding the distributions better.

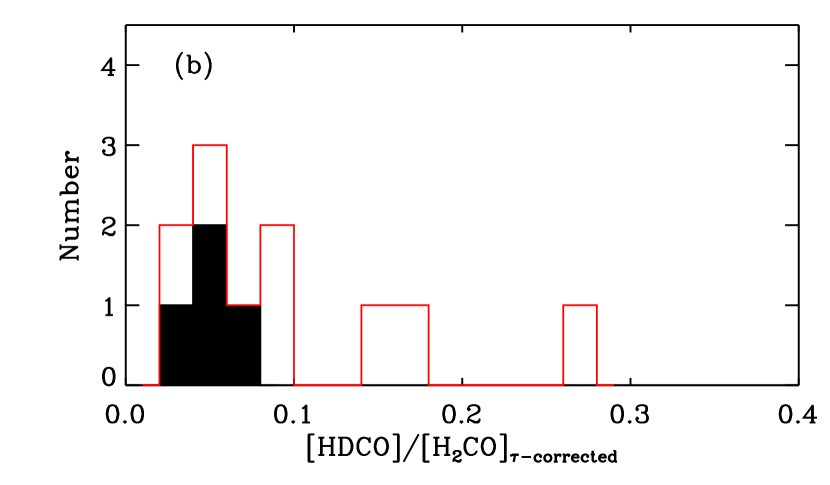
Figure 5(a) shows a comparison of the [HDCO]/[H2CO] ratios with and without optical depth correction. Although the optical depth corrections for the H2CO observations make the [HDCO]/[H2CO] ratios decrease for all sources, changes of the [HDCO]/[H2CO] ratios are not much. In Figure 5(b), the overall distributions of the -corrected [HDCO]/[H2CO] ratios show similar characteristics compared with Figure 4(b). The three outliers with high deuterium fractionation are still far from the mode of the distribution. Even if we consider the optical depth, the [HDCO]/[H2CO] ratios of 090003, HOPS 373, and 097002 are still high ( 0.15). Therefore, in the subsequent discussions below, we will consider only the [HDCO]/[H2CO] distribution derived with the assumption of optically thin lines.
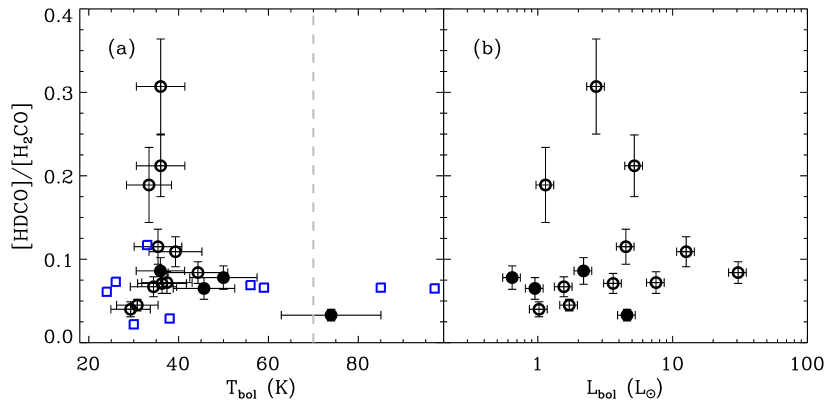
The [HDCO]/[H2CO] ratios are plotted against and in Figure 6. When plotted against in Figure 6(b), no obvious correlation was found. The [HDCO]/[H2CO] ratios for low-mass Class 0 protostars reported by Roberts et al. (2002) are also plotted in Figure 6(a). As suggested by Roberts et al. (2002), there is no marked correlation between the [HDCO]/[H2CO] ratios and the bolometric temperature (a proxy of the evolutionary stage of protostars). Though the PBRS and non-PBRS samples show similar mode values, the PBRS sample shows a significantly larger scatter. This difference suggests that either PBRS have an intrinsically large variation in the deuterium fractionation or the three outliers are chemically distinct from the majority of Class 0 protostars.
5.2 Properties of the PBRS sample
To focus on the large variation of the deuterium fractionation in the PBRS sample, we calculate the fractional abundances of the PBRS sample. The fractional HDCO and H2CO abundances were calculated by dividing the total HDCO and H2CO column densities by the H2 column density i.e., X(HDCO) = [HDCO]/[H2] and X(H2CO) = [H2CO]/[H2]. Using the 870 µm flux density in Table 5 of Stutz et al. (2013), the beam-averaged column density of PBRS can be computed with:
| (8) |
where is the beam solid angle, is the mean molecular weight of the interstellar medium, which we assume to be 2.8 (Kauffmann et al., 2008), is the mass of the hydrogen atom, is the dust absorption coefficient (1.85 cm2g-1, Schuller et al. (2009)), and is the gas-to-dust mass ratio (assumed to be 100). We assume a dust temperature of 20 K (Stutz et al., 2010). The observed abundances of HDCO and H2CO range from to and to , respectively. The H2CO abundances of PBRS are similar to the outer H2CO abundances toward low-mass protostars reported by Maret et al. (2004). They have explained that the outer regions of the envelopes of Class 0 sources reflect the pre-collapse conditions based on the similarity of the values between the abundances of pre-stellar cores studied by Bacmann et al. (2002, 2003) and the outer H2CO abundances of low-mass protostars.
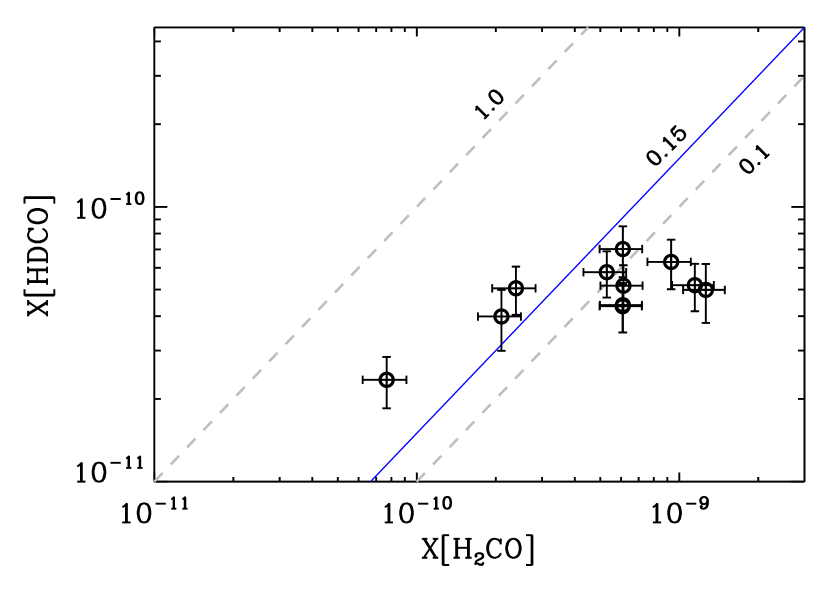

The HDCO and H2CO abundances relative to H2 are plotted in Figure 7. As the H2CO abundance increases, the HDCO abundance increases for the PBRS with the ratio of . The highly deuterated PBRS ([HDCO]/[H2CO] 0.15) are significantly different from the other PBRS in that they have small H2CO abundances and that their H2CO line widths are quite narrow ( 1 km s-1, Figure 3). The degree of deuterium fractionation is suggested to increase with increasing CO depletion (Bacmann et al., 2003). The CO and H2CO molecules are depleted by a similar factor in the outer envelope of Class 0 protostar (Maret et al., 2004). The low H2CO abundance of highly deuterated PBRS is likely to be explained by depletion of H2CO. The narrow line widths imply that these cores are quiescent, which is associated with early phases of core evolution. Therefore, the PBRS with high [HDCO]/[H2CO] ratios are probably in the very earliest stage of star formation.
Figure 8 shows the relation between [HDCO]/[H2CO] and the mass-to-luminosity ratio that is expected to decrease with time. The PBRS with high [HDCO]/[H2CO] ratios have relatively large mass-to-luminosity ratio, supporting that they are in the earliest stage of star formation. However, two PBRS with the largest mass-to-luminosity ratio have low [HDCO]/[H2CO] ratios. Therefore, it is difficult to find a simple relation between the two quantities. If the mass-to-luminosity ratio is a good tracer of evolution, [HDCO]/[H2CO] seems to have a large dispersion at early stages and converge to a typical value of Class 0 sources at later stages.
The large variation of deuterium fractionation in the whole PBRS sample leads us to suggest that the PBRS form in diverse conditions or have diverse formation histories. Indeed, the degree of deuterium fractionation of H2CO is sensitive to the initial D/H ratios of gaseous molecules determined before the collapse phase (Turner, 1990; Charnley et al., 1992; Roberts et al., 2002; Cazaux et al., 2011; Aikawa et al., 2012).
PBRS 097002 and 090003 among the highly deuterated PBRS have flat visibility amplitude profiles in the 2.9 mm dust continuum observations by Tobin et al. (2015). They interpret that the PBRS with flat visibility amplitude profiles are the youngest in a brief phase of high infall/accretion. Since PBRS 093005 and 082005 with the lowest [HDCO]/[H2CO] ratio also have flat visibility amplitude profiles, it is unclear if the variation of deuterium fractionation in H2CO is due to the core evolution. Additional observations in pure gas phase species, e.g., N2D+ and N2H+, can help understanding the chemical evolutionary sequence of PBRS.
6 Summary
We observed 15 Class 0 protostars (11 PBRS and 4 non-PBRS) in the Orion molecular cloud complex using the KVN in the single-dish telescope mode. The chemical properties of PBRS were investigated in the H2CO , HDCO , and lines. The main results are summarized as follows.
-
1.
The H2CO and HDCO emission lines were detected toward all targets. The HDCO emission line was detected toward seven PBRS.
-
2.
The [HDCO]/[H2CO] ratio ranges from 0.03 to 0.31. The deuterium fractionation of most PBRS (70%) is similar to that of non-PBRS Class 0 protostars, and three PBRS (30%) have significantly high deuterium fractionation, greater than 0.15. These findings represent a good hint that the deuterium fractionation of PBRS may have a distribution different from that of non-PBRS, but future studies with larger sample sizes are needed to reach a statistically more significant conclusion.
-
3.
The high [HDCO]/[H2CO] ratios of the three PBRS imply that they are in the earliest phase of the star formation. The large variation of deuterium fractionation in the whole PBRS sample suggests that PBRS form in diverse conditions of temperature and/or density, because [HDCO]/[H2CO] ratios are usually interpreted as a fossil memory of the earlier, colder phase of star formation.
-
4.
No clear correlation between the deuterium fractionation of H2CO and the evolutionary state of cores could be found. Further studies in various molecules are needed to investigate the difference between evolutionary sequence and initial conditions of the PBRS sample.
References
- Aikawa et al. (2012) Aikawa, Y., Wakelam, V., Hersant, F., Garrod, R. T., & Herbst, E. 2012, ApJ, 760, 40
- Awad et al. (2014) Awad, Z., Viti, S., Bayet, E., & Caselli, P. 2014, MNRAS, 443, 275
- Bacmann et al. (2002) Bacmann, A., Lefloch, B., Ceccarelli, C., et al. 2002, A&A, 389, L6
- Bacmann et al. (2003) —. 2003, ApJ, 585, L55
- Baudry et al. (1995) Baudry, A., Lucas, R., & Guilloteau, S. 1995, A&A, 293, 293, 594
- Bergman et al. (2011) Bergman, P., Parise, B., Liseau, R., & Larsson, B. 2011, A&A, 527, 39
- Caselli & Ceccarelli (2012) Caselli, P., & Ceccarelli, C. 2012, The Astron Astrophys Rev, 20, 56
- Caselli et al. (2002) Caselli, P., Walmsley, C. M., Zucconi, A., et al. 2002, ApJ, 565, 344
- Cazaux et al. (2011) Cazaux, S., Caselli, P., & Spaans, M. 2011, ApJ, 741, L34
- Ceccarelli et al. (1998) Ceccarelli, C., Castets, A., Loinard, L., Caux, E., & Tielens, A. G. G. M. 1998, A&A, 338, L43
- Ceccarelli et al. (2001) Ceccarelli, C., Loinard, L., Castets, A., et al. 2001, A&A, 372, 998
- Ceccarelli et al. (2003) Ceccarelli, C., Maret, S., Tielens, A. G. G. M., Castets, A., & Caux, E. 2003, A&A, 410, 587
- Charnley et al. (1992) Charnley, S. B., Tielens, A. G. G. M., & Millar, T. J. 1992, ApJ, 399, L71
- Chen et al. (1995) Chen, H., Myers, P. C., Ladd, E. F., & Wood, D. O. S. 1995, ApJ, 445, 377
- Codella et al. (2012) Codella, C., Ceccarelli, C., Lefloch, B., et al. 2012, ApJ, 757, L9
- Crapsi et al. (2005) Crapsi, A., Caselli, P., Walmsley, C. M., et al. 2005, ApJ, 619, 379
- Emprechtinger et al. (2009) Emprechtinger, M., Caselli, P., Volgenau, N. H., Stutzki, J., & Wiedner, M. C. 2009, A&A, 493, 89
- Fischer et al. (2010) Fischer, W. J., Megeath, S. T., Ali, B., et al. 2010, A&A, 518, L122
- Fontani et al. (2015) Fontani, F., Busquet, G., Palau, A., et al. 2015, A&A, 575, A87
- Fontani et al. (2008) Fontani, F., Caselli, P., Bourke, T. L., Cesaroni, R., & Brand, J. 2008, A&A, 477, L45
- Fontani et al. (2014) Fontani, F., Codella, C., Ceccarelli, C., et al. 2014, ApJ, 788, L43
- Fontani et al. (2011) Fontani, F., Palau, A., Caselli, P., et al. 2011, A&A, 529, L7
- Gibb & Little (2000) Gibb, A. G., & Little, L. T. 2000, MNRAS, 313, 663
- Guzmán et al. (2011) Guzmán, V., Pety, J., Goicoechea, J. R., Gerin, M., & Roueff, E. 2011, A&A, 534, 49
- Guzmán et al. (2013) Guzmán, V. V., Goicoechea, J. R., Pety, J., et al. 2013, A&A, 560, 73
- Hirota et al. (2007) Hirota, T., Bushimata, T., Choi, Y. K., et al. 2007, PASJ, 59, 897
- Kauffmann et al. (2008) Kauffmann, J., Bertoldi, F., Bourke, T. L., Evans, N. J. I., & Lee, C. W. 2008, A&A, 487, 993
- Kim et al. (2008) Kim, M. K., Hirota, T., Honma, M., et al. 2008, PASJ, 60, 991
- Langer et al. (1979) Langer, W. D., Frerking, M. A., Linke, R. A., & Wilson, R. W. 1979, ApJ, 232, L169
- Lee et al. (2011) Lee, S.-S., Byun, D.-Y., Oh, C. S., et al. 2011, PASP, 123, 1398
- Linsky (2003) Linsky, J. L. 2003, Space Science Reviews, 106, 49
- Loinard et al. (2001) Loinard, L., Castets, A., Ceccarelli, C., Caux, E., & Tielens, A. G. G. M. 2001, ApJ, 552, L163
- Loinard et al. (2002) Loinard, L., Castets, A., Ceccarelli, C., et al. 2002, Planetary and Space Science, 50, 1205
- Loren & Wootten (1985) Loren, R. B., & Wootten, A. 1985, ApJ, 299, 947
- Mangum & Wootten (1993) Mangum, J. G., & Wootten, A. 1993, ApJS, 89, 123
- Manoj et al. (2013) Manoj, P., Watson, D. M., Neufeld, D. A., et al. 2013, ApJ, 763, 83
- Maret et al. (2004) Maret, S., Ceccarelli, C., Caux, E., et al. 2004, A&A, 416, 577
- Menten et al. (2007) Menten, K. M., Reid, M. J., Forbrich, J., & Brunthaler, A. 2007, A&A, 474, 515
- Minh et al. (1995) Minh, Y. C., Dickens, J. E., Irvine, W. M., & McGonagle, D. 1995, A&A, 298, 213
- Parise et al. (2006) Parise, B., Ceccarelli, C., Tielens, A. G. G. M., et al. 2006, A&A, 453, 949
- Parise et al. (2009) Parise, B., Leurini, S., Schilke, P., et al. 2009, A&A, 508, 737
- Phillips et al. (1979) Phillips, T. G., Huggins, P. J., Wannier, P. G., & Scoville, N. Z. 1979, ApJ, 231, 720
- Pickett et al. (1998) Pickett, H. M., Poynter, R. L., Cohen, E. A., et al. 1998, JQSRT, 60, 883
- Roberts et al. (2002) Roberts, H., Fuller, G. A., Millar, T. J., Hatchell, J., & Buckle, J. V. 2002, A&A, 381, 1026
- Roberts & Millar (2000a) Roberts, H., & Millar, T. J. 2000a, A&A, 364, 780
- Roberts & Millar (2000b) —. 2000b, A&A, 361, 388
- Rodgers & Millar (1996) Rodgers, S. D., & Millar, T. J. 1996, MNRAS, 280, 1046
- Rohlfs & Wilson (1999) Rohlfs, K., & Wilson, T. L. 1999, Tools of Radio Astronomy (3rd ed.; Heidelberg:Springer)
- Roueff & Gerin (2003) Roueff, E., & Gerin, M. 2003, Space Science Reviews, 106, 61
- Sakai et al. (2012) Sakai, T., Sakai, N., Furuya, K., et al. 2012, ApJ, 747, 140
- Schuller et al. (2009) Schuller, F., Menten, K. M., Contreras, Y., et al. 2009, A&A, 504, 415
- Stutz et al. (2010) Stutz, A., Launhardt, R., Linz, H., et al. 2010, A&A, 518, L87
- Stutz et al. (2013) Stutz, A. M., Tobin, J. J., Stanke, T., et al. 2013, ApJ, 767, 36
- Taquet et al. (2012) Taquet, V., Ceccarelli, C., & Kahane, C. 2012, ApJ, 748, L3
- Tatematsu et al. (2010) Tatematsu, K., Hirota, T., Kandori, R., & Umemoto, T. 2010, PASJ, 62, 1473
- Tielens (1983) Tielens, A. G. G. M. 1983, A&A, 119, 177
- Tobin et al. (2015) Tobin, J. J., Stutz, A. M., Megeath, S. T., et al. 2015, ApJ, 798, 128
- Turner (1990) Turner, B. E. 1990, ApJ, 362, L29
- Turner (2001) —. 2001, ApJS, 136, 579