CARMA CO Observations of Three Extremely Metal-Poor, Star-Forming Galaxies
Abstract
We present sensitive CO (J = 1 0) emission line observations of three metal-poor dwarf irregular galaxies Leo P (3% ), Sextans A (7.5% ), and Sextans B (7.5% ), all obtained with the Combined Array for Millimeter-wave Astronomy (CARMA) interferometer. While no CO emission was detected, the proximity of the three systems allows us to place very stringent (4) upper limits on the CO luminosity (LCO) in these metal-poor galaxies. We find the CO luminosities to be LCO 2900 K km/s pc2 for Leo P, LCO 12400 K km s-1 pc2 for Sextans A, and LCO 9700 K km s-1 pc2 for Sextans B. Comparison of our results with recent observational estimates of the factor for converting between LCO and the mass of molecular hydrogen, as well as theoretical models, provides further evidence that either the CO-to-H2 conversion factor increases sharply as metallicity decreases, or that stars are forming in these three galaxies very efficiently, requiring little molecular hydrogen.
1 Introduction
Metal-poor environments such as those in low-mass dwarf galaxies and the outskirts of normal spiral galaxies are chemically similar to the star-forming environments of the early universe. Improving our understanding of these environments will help shed light on some of the processes that drive star formation in the early universe. It is clear that heavy elements help cool interstellar gas to initiate its eventual collapse into potential star-forming regions (e.g., Spitzer 1948; Shu et al. 1987; McKee 1989; Wolfire et al. 1995; Glover & Mac Low 2007). How does star formation proceed without the presence of heavy elements? Does star formation require large concentrations of molecular hydrogen (H2), or is this molecule just a byproduct of the star formation process at low metallicity?
In a solar metallicity environment like that of the Milky Way, molecular hydrogen easily forms on the available dust grains. Directly observing the H2 gas that will form stars is problematic since H2 does not radiate at temperatures below a few hundred Kelvin, while stars form inside cold molecular clouds with temperatures of a few tens of Kelvin. Fortunately, CO forms in conditions similar to H2, and the luminosity of CO (LCO) is correlated to the total mass of H2 (M; Young & Scoville 1982; also see the recent review by Bolatto et al. 2013 and references within).
While the conversion factor between LCO and M is fairly well established in normal galaxy disks with metallicity approximately equal to the solar value, it is much less certain at low metallicities (Maloney & Black 1988; Israel 1997; Leroy et al. 2011; Bolatto et al. 2013). At low metallicity, dust is much less abundant (e.g., Lisenfeld & Ferrara 1998; Galametz et al. 2012). The dust on which H2 forms also plays a critical role in the shielding of the molecular gas from photodissociation by UV photons. The lower dust abundances also lengthen the time for H2 to reach chemical equilibrium by up to 1 Gyr (Bell et al., 2006; Glover & Mac Low, 2011). This raises the question of whether atomic gas clouds can form stars in the absence of a significant molecular component. It is likely that for modest changes in metallicity from a solar abundance this is not a problem since [C II] can provide most of the needed cooling (Krumholz, 2012, 2013), and during collapse, the increase in density drives much of the gas into the molecular phase (Glover & Clark, 2012c).
There has been extensive effort aimed at both observing and modelling these low metallicity environments. Taylor et al. (1998) observed the CO emission in 11 nearby, low metallicity dwarf galaxies and found a striking dropoff of detections around an oxygen abundance of 12 + log(O/H) 8.0. This same limit was seen by Schruba et al. (2012) in 16 dwarf galaxies from the HERACLES survey (Leroy et al., 2009). The lack of CO detections at 12 + log(O/H) 8.0 could indicate the complete absence of CO or it could point to our limited technological ability to recover the low surface brightness emission. The recent detection of CO emission in WLM (12 + log(O/H) = 7.8) by Elmegreen et al. (2013) and marginal detection of CO in Sextans A by Shi et al. (2015) both using the Atacama Pathfinder EXperiment (APEX; Güsten et al. 2006) suggests the latter. Nevertheless, it is clear that the abundance of CO drops as the metallicity decreases.
Simulations of star formation at low metallicity have shown that molecular hydrogen may form and become abundant prior to any CO formation, even forming in gas with no dust or heavy elements (Glover & Clark 2012a; Glover & Clark 2012c; see also, for example, Krumholz et al. 2008; Krumholz et al. 2009a; Krumholz et al. 2009b; Ostriker et al. 2010; Krumholz 2012; Krumholz 2013). We aim to place further constraints on the state of the molecular interstellar medium (ISM) at low metallicity in relation to the star formation activity by observing the CO (J = 1 0) emission line in three nearby, low-metallicity, star-forming dwarf galaxies. We describe our observations in §2 and our galaxy sample in §3. We discuss our results in §4, compare our galaxy sample to those in the literature in §5, and summarize our findings in §6.
2 Observations and Data Processing
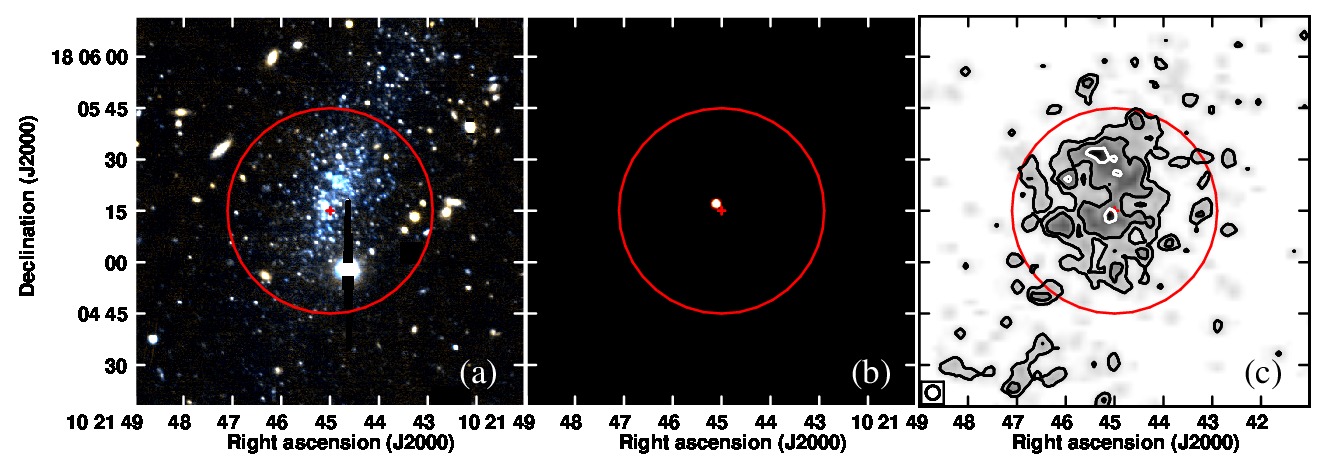
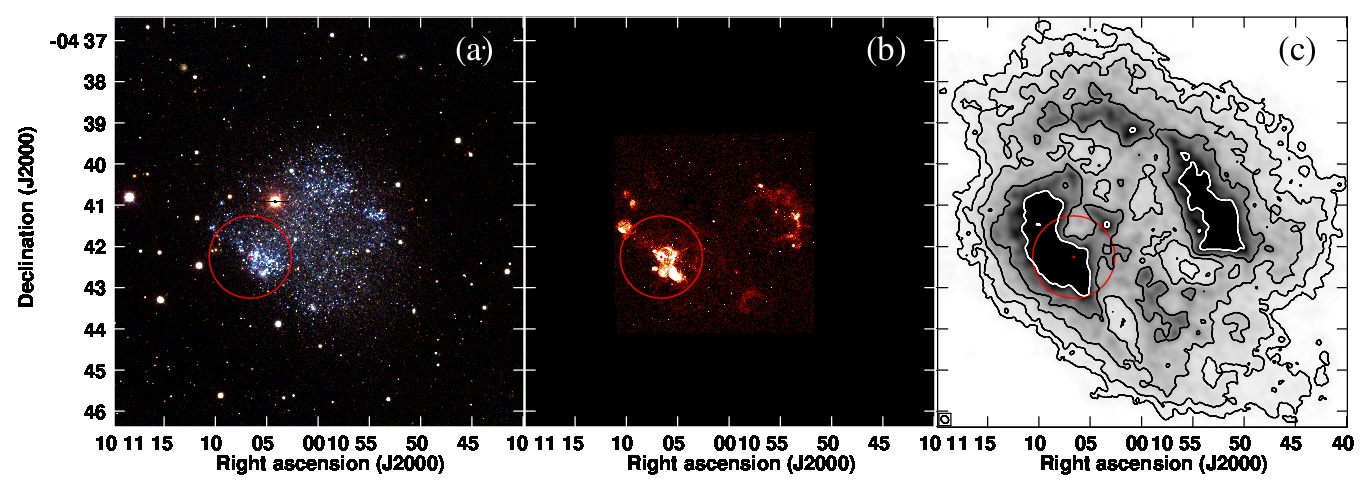
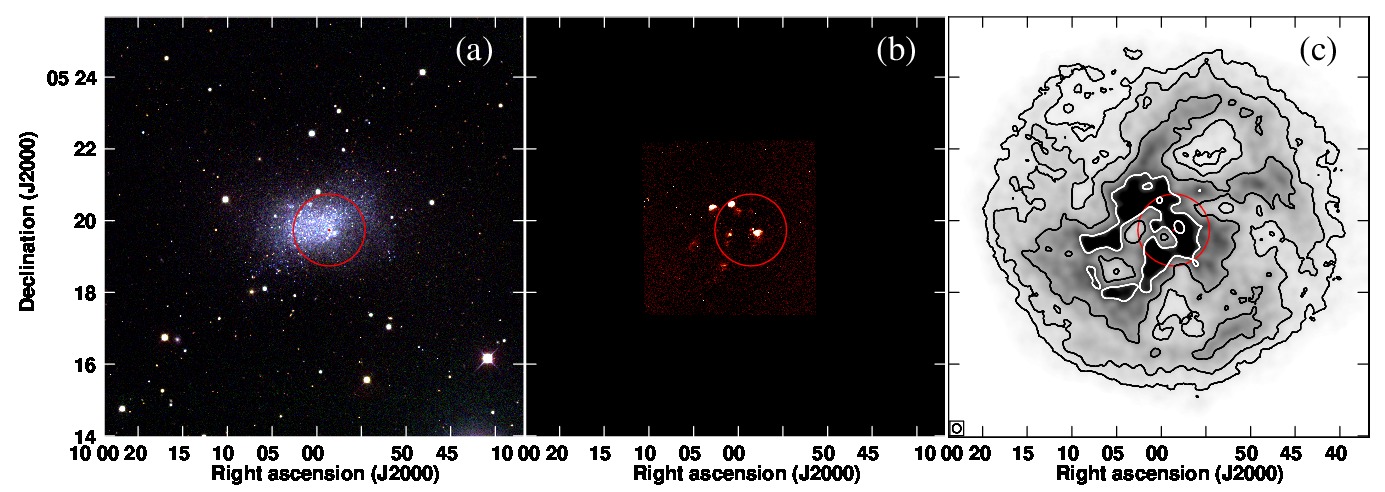
We observed the CO (J = 1 0) 115.27120 GHz emission line in three extremely metal-poor galaxies (Leo P, Sextans A, and Sextans B) with the Combined Array for Millimeter-wave Astronomy (CARMA) in the D-configuration. Because the CARMA primary beam (1 arcmin) covered the majority of the star forming disk in Leo P, it was observed with a single pointing for a total of 24 hours between 11 February 2013 and 16 February 2013. A seven-pointing mosaic was used to observe portions of Sextans A (17 total hours between 2-15 June 2013) and Sextans B (11 total hours between 28 March 2013 and 2 April 2013) that contained recent star formation activity as well as dense, potentially cold H I gas (Warren et al., 2012). Figure 1 shows optical images of each galaxy. The contours represent the H I column density and the red circles denote the field of view of our CARMA observations in each galaxy.
The correlator was set up to provide native channel widths of 2 km s-1 (0.78 MHz) for each galaxy. Standard reduction procedures were followed using the Miriad software package. Baseline and rest frequency corrections were applied, high-amplitude data were flagged, and the sources were calibrated against flux (3C273) and phase (0854+201, 1058+015) calibrators. The final data cubes have a natural weighted beam size of 3.5″2.5″and a velocity range of 600 km s-1 centered near the velocity at which H I emission was detected for each galaxy (Ott et al. 2012; Bernstein-Cooper et al. 2014). Table 1 lists relevant galaxy properties.
In addition to each of the above spectral line observations, we placed the 12 remaining CARMA spectral windows to observe the continuum emission. Each of these spectral win- dows covers a 500 MHz bandwidth (6 GHz total). Similar reduction procedures as above were performed on the continuum data. The entire 6 GHz bandwidth was then combined into a single image for later analysis.
We complement our CO analysis with Jansky Very Large Array H I emission line observations from two other studies: Bernstein-Cooper et al. (2014) (Leo P) and Ott et al. (2012) (Sextans A and Sextans B). We refer the reader to these manuscripts for full data reduction and processing steps. We utilize these natural weighted data sets to guide our search for CO emission as we expect the CO emission to overlap in frequency with the observed H I. In §5.2 we use the H I data to estimate the amount of H2 for comparison to that computed from our CO observations.
3 Galaxy Sample
We observed three nearby galaxies that show recent signs of star formation, suggesting that some amount of molecular gas is likely to be present. Leo P is a recently discovered, extremely low-mass galaxy identified by the Arecibo Legacy Fast ALFA (ALFALFA) survey (Giovanelli et al., 2013). Initial estimates for Leo P placed it at a distance between 1.5 and 2.0 Mpc (Rhode et al., 2013), while deep Large Binocular Telescope imaging refined the distance determination to 1.62 Mpc (McQuinn et al., 2015). At this distance, Leo P has a total H I mass of only 8.1105 M☉ (McQuinn et al., 2015). Despite its low gas content, Leo P is currently forming stars as evidenced by a young, blue stellar population as well as a single bright H II region (Rhode et al., 2013). There also exists evidence of a cold H I (T1000 K) gas phase near this lone H II region (Bernstein-Cooper et al., 2014). Optical spectroscopic observations of the bright H II region put a firm constraint on the oxygen abundance (12 + log(O/H) = 7.170.04; Skillman et al. 2013), establishing Leo P as one of the lowest metallicity gas-rich galaxies ever measured. Since Leo P was discovered recently, no Spitzer or Herschel observations exist.
At distances of 1.4 Mpc (Dalcanton et al., 2009), Sextans A and Sextans B are both well-studied systems. Each has a metallicity of 12 + log(O/H) 7.55 (Kniazev et al., 2005) and high column density H I reservoirs (Ott et al. 2012). Their H I disks show evidence of cold H I gas (T 1500 K; Warren et al. 2012), as well as co-spatial dust emission from Spitzer imaging (Dale et al., 2009). Following the methods used in Herrera-Camus et al. (2012; specifically, a modified blackbody model with an emissivity index =1.5 and a mass absorption coefficient of = 9.5 cm2 g-1), the Dale et al. (2009) Spitzer fluxes imply dust masses of 1.1 103 M☉ and 240 M☉ for Sextans A and Sextans B, respectively. This dust mass for Sextans A can be compared to the 770 M⊙ derived from Herschel observations in Shi et al. (2015).
Despite the H I richness and ongoing star formation of our sample galaxies, to date no CO emission has been found in Sextans B or in Leo P; a weak CO detection in Sextans A was reported in Shi et al. (2015) and is discussed further below. In Figure 1 we show our half-power CARMA field-of-view (red circles) overlaid onto optical (column a), H (column b), and integrated H I intensity (column c) images for Leo P (top row), Sextans A (middle row), and Sextans B (bottom row). Our CARMA observations cover areas with recent star formation and high-column density H I emission.
4 Results
Visual inspection of the final data cubes at 2 km s-1 velocity resolution (see Figure 2) revealed no significant CO emission in any of the three galaxies near the expected velocity ranges defined by the velocity ranges observed in H I. Thus, in order to report the upper limits of any CO emission, we follow a similar approach as Leroy et al. (2007), who presented high-sensitivity measurements of the CO emission from the extremely metal-poor galaxy I Zw 18. First, we smooth the data to a velocity resolution of 18.4 km s-1, a typical linewidth observed in other nearby, low-mass galaxies (e.g., Schruba et al. 2012). We then adopt an upper limit to the CO intensity (SCO) of four times the average rms level in each channel over the observed H I velocity range multiplied by the velocity resolution. To compute an upper limit to the luminosity of CO emission (LCO) we use the equation LCO = 2453SCOD where LCO has units of K km s-1 pc2, SCO in units of Jy beam-1 km s-1, and DMpc is the distance in Mpc. Table 2 lists the derived upper limits for each galaxy.
Our upper limits of the CO emission represent some of the most sensitive to date at the respective metallicities of each galaxy. Previous CO observations of the paradigm metal-poor galaxy I Zw 18 (12 + log(O/H) = 7.17; Skillman & Kennicutt 1993) by Leroy et al. (2007) and Herrera-Camus et al. (2012) yield an upper limit to the CO luminosity of LCO 105 K km s-1 pc2. Our limit to the CO luminosity in Leo P, which has a similar metallicity to I Zw 18 but is 10 times closer, is 30 times more sensitive. Recently, Shi et al. (2015) observed a small region in Sextans A (which is included in our observed region) and claims a marginal 3.4 CO detection resulting in an LCO lower limit of 3670 K km s-1 pc2. We discuss the implications of these limits below.
The 3 mm continuum emission in normal galaxies is dominated by free-free emission from H II regions (see Condon 1992). Our observations are not sensitive enough to detect this emission in our target regions even though H emission exists in each region (see Figure 1). We report here our upper limits as 4 times the rms level. The 3 mm continuum has an upper limit of 0.3 mJy for Leo P, 0.7 mJy for Sextans A, and 1.0 mJy for Sextans B.
5 Discussion
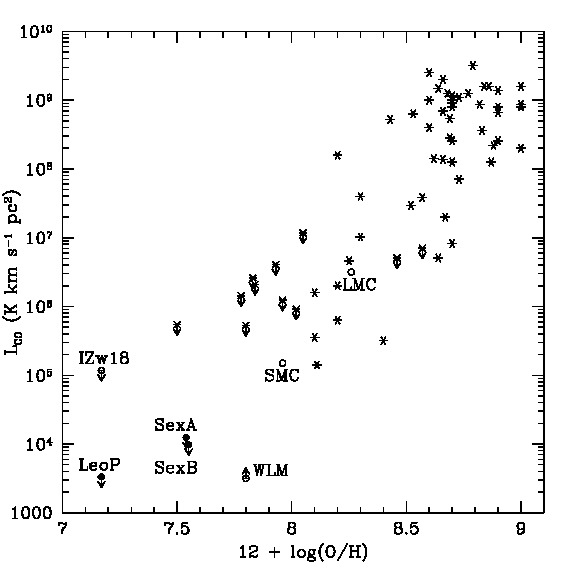
It is useful to compare our CO observations to measurements of other nearby systems in the literature. In Figure 3 we plot the CO luminosity versus the oxygen abundance for a sample of nearby galaxies. Black crosses are derived from the sample of galaxies reported by Schruba et al. (2012) and references therein. We have converted the CO (J = 2 1) observations in Schruba et al. (2012) to CO (J = 1 0) by assuming the same constant (2 1)/(1 0) line ratio in units of K km s-1 of 0.7 employed by Schruba et al. (2011) and Bigiel et al. (2011). Black open circles highlight a few galaxies of interest including the I Zw 18 limit (Leroy et al., 2007) as well as the recently reported lower limit to the CO emission in WLM (Elmegreen et al., 2013). We correct the WLM CO (J = 3 2) observation to CO (J = 1 0) by assuming the same (3 2)/(1 0) line ratio of 0.8 in units of K km s-1 employed by Elmegreen et al. (2013). Black filled circles represent the three galaxies in this study.
It is clear from Figure 3 that the detection of CO emission below metallicities of 12 + log(O/H) 8.0 remains difficult. If our galaxies had CO luminosities similar to the SMC we clearly would have detected their emission. This lack of detection may not be due entirely to sensitivity issues, but may be the result of changes in the physical conditions that support CO gas (e.g., metallicity, dust abundance, gas density, etc.). These changes in physical conditions have been noted several times in the literature (e.g., Maloney & Black 1988, Glover & Mac Low 2011). The recent detection of CO emission in the nearby galaxy WLM by Elmegreen et al. (2013) suggest that newer technology may be able to detect CO at much lower metallicities. Deep CO observations by observatories with larger light collecting areas such as the Atacama Large (Sub)Millimeter Array (ALMA) are needed to establish which of the above scenarios is the limiting factor in low metallicity CO detection.
5.1 H2 mass estimates from CO
The luminosity of CO is commonly used to infer the presence of molecular hydrogen. To convert LCO into M we need to know the relationship between the two quantities. Substantial effort has been expended toward understanding this correlation (see Bolatto et al. 2013). For Galactic metallicities the relationship between LCO and the H2 mass, M, is:
| (1) |
where = 4.3 M☉ (K km s-1 pc2)-1. This conversion works because, at these metallicities, the CO and H2 gas are coextensive.
For galaxies with metallicities much below solar, this simple conversion is no longer valid. H2 can self-shield even with little dust present, thus there should exist clouds of “CO-faint” H2 in star forming, low-metallicity environments which implies that the CO and H2 are not coextensive. Evidence for CO-faint gas is particularly strong in the SMC (Rubio et al., 1993; Lequeux et al., 1994; Israel, 1997; Bolatto et al., 2003; Leroy et al., 2007, 2009, 2011; Bolatto et al., 2011). These authors use star formation, dust, and gas tracers to infer the presence of molecular gas that emits only weakly in CO, if at all. The deviation away from the Galactic value of has also been inferred in CO surveys of galaxies (e.g., Wilson 1995; Arimoto et al. 1996; Bolatto et al. 2008; Leroy et al. 2011; Schruba et al. 2012). Here we use our LCO limits to compute upper limits to M using a range of conversion factors.
Table 3 lists computed H2 mass upper limits and the ratio of molecular-to-atomic hydrogen (M/MHI) in the observed regions for various assumptions of described below. Using the Galactic value for results in molecular-to-atomic hydrogen mass ratios of 1% for Sextans A and Sextans B and 5% for Leo P, far below those typically observed in star-forming higher metallicity galaxies of 20-100% (see, e.g., Leroy et al. 2009). If we instead use the typical value inferred in the SMC of 70 M☉ (K km s-1 pc2)-1 (Leroy et al., 2009), we compute H2 masses of 10% of the H I mass in Sextans A and Sextans B but 80% for Leo P. Lastly, we use the 3% Solar metallicity models of Glover & Clark (2012c) to estimate M. These authors find that the conversion factor varies in their models from 10-66.3 times the Galactic value. A recent ALMA study of SBS 0335-052 (Hunt et al., 2014) suggests a lower limit value for 125 M☉ (K km s-1 pc2)-1 at metallicities of 3% solar, which falls within the range of values computed in Glover & Clark (2012c). We use the larger value from Glover & Clark (2012c) here which corresponds to = 285 M☉ (K km s-1 pc2)-1 to compute M/MHI ratios of 50% for Sextans A and Sextans B, and over 300% for Leo P. Since low metallicity galaxies are dominated by atomic hydrogen, these unphysical molecular-to-atomic hydrogen mass ratios either rule out large values of or, more likely, the actual CO emission in these galaxies is less than the derived upper limits.
5.2 Predicting the total H2 mass from H I emission
Yet another way of predicting the amount of H2 mass in the observed regions comes from the recent modelling of Krumholz (2013). This model (hereafter KMT+) is an extension to the original models of Krumholz et al. (2009b) and predicts both the H2-to-H I mass suface density ratio, = /, and the ensuing star formation rate surface density, . The KMT+ model assumes a two-phase ISM where chemical equilibrium may never be reached prior to the onset of star formation in a low-metallicity environment. As a result, the formation of molecular species is more of a byproduct of the collapse of star forming clouds rather than preceded by it. That is, the H2 is formed in the centers of collapsing gas clouds where the temperatures are low enough and the densities are high enough rather than the molecules forming prior to the onset of collapse. This scenario thus suggests that large concentrations of molecular gas might not exist at extremely low metallicities.
Inputs into the KMT+ model are the total gas surface density, , the stellar + dark matter volume density (), the metallicity (Z), and some nominal clumping factor (cf). Leo P has a stellar mass of 5.7105 M⊙ and a radius of 580 pc (McQuinn et al., 2013). If we assume the stars have a scale height of 100 pc then the stellar mass volume density is approximately 0.005 M⊙ pc-3. This value will change based upon our geometric assumptions and assumptions of the dark matter contribution. Therefore we assume three different values for in order to bracket plausible values: the value in the Solar neighborhood = 0.01 M⊙ pc-3 (Holmberg & Flynn, 2000) and also values an order of magnitude above and below. Krumholz (2013) suggests that cf = 1 for linear scales below 100 pc. The H I linear beam sizes are 33 pc for Leo P, 80 pc for Sextans A, and 100 pc for Sextans B, thus we assume cf = 1. We use the output values in combination with the H I images to estimate the total H2 masses in each region. Table 4 shows the total H2 mass derived for each region in our galaxies.
We can use these mass estimates to predict what values of LCO are expected for various assumptions of . We use the H2 mass estimates from the = 0.01 models for this exercise. The quoted errors reflect the values for the = 0.1 and 0.001 H2 mass estimates. Table 5 lists various LCO predictions for our regions using the same values from Table 3. If the KMT+ models are correct it seems very unlikely that CO will be observed with current technology in Leo P, even with ALMA. The recent 3.4 CO detection (LCO 3670 K km s-1 pc2) reported by Shi et al. (2015) implies an 60 M☉ (K km s-1 pc2)-1 in the KMT+ models. This appears to be inconsistent with what is observed in objects of slightly higher metallicity (e.g., SMC) which require higher values of . There is hope, however, to observe CO in Sextans A and Sextans B with modest ALMA observations.
5.3 Comparison with Star Formation Rates
We use the SFRs computed from the H and FUV luminosities to compute limits to the amount of available molecular gas. To do this we need to multiply the SFR in units of M⊙ yr-1 by an appropriate time scale. Weisz et al. (2011) detail the SFRs of both Sextans A and Sextans B and show that the SFRs have remained relatively constant over the lifetimes of each galaxy with a relative uptick in SFR in the past 5 Gyr. There is currently no similar information available for Leo P. If we assume the SFRs have not changed significantly in the past couple of Gyr, then we can use an estimation of the depletion timescale, that is, the amount of time it would take the current SFR to convert all of the available molecular gas into stars. Bolatto et al. (2011) find that for the SMC, the molecular gas depletion time, , ranges from 0.6 - 7.5 Gyr with large uncertainties depending on the linear scales probed. These authors’ results are similar to the results of other studies of molecular dominated regions in high metallicity galaxies conducted at 750 pc - 1 kpc scales which obtain 2 Gyr (Bigiel et al., 2008, 2011; Leroy et al., 2008). We will adopt an order of magnitude approach to our calculation that will give us an upper limit to the amount of available molecular gas given our assumptions of a constant SFR over the depletion time of = 2 Gyr.
With a depletion timescale of 2 Gyr and the SFR values given in Table 1, we compute M = 1105 M⊙, 3.4106 M⊙, and 6.2105 M⊙ for Leo P, Sextans A, and Sextans B, respectively. These M values correspond to upper limits to the M/MHI ratios of 33%, 39%, and 13%, respectively. Computing the star formation rate using the H luminosity is notoriously unreliable at low metallicities (Lee et al., 2009). If instead we use the SFR values given in Table 1, we compute M = 1.0107 M⊙ and 2.3106 M⊙ for Sextans A and Sextans B, respectively. These values correspond to M/MHI ratios of 114% and 49%.
In Table 6 we compute the resulting CO luminosities with our previous assumptions. If an of 4.3 is appropriate, we would have detected this amount of H2 in each of our galaxies with our observations. In fact, we would have detected Sextans A using any of the values with either SFR indicator. Either the amount of CO present in these galaxies is much lower than the upper limits calculated from the SFRs or our assumptions of a constant SFR and 2 Gyr depletion timescale do not accurately describe the local physics. It is likely the depletion timescale is much longer than 2 Gyr in low metallicity environments. The LCO values computed here are at least an order of magnitude more than those predicted by the KMT+ model for = 2 Gyr. The KMT+ model allows for the depletion timescale to be as long as 100 Gyr in the H I-dominated regions similar to what we expect in our systems. Increasing the depletion timescale will, likewise, increase the derived LCO values. The data seem to favor larger values of but predicting an exact value requires more detailed understanding about the appropriate depletion timescales in each system.
6 Conclusions
We present CARMA CO (J = 1 0) observations of three nearby, low-metallicity galaxies: Leo P, Sextans A, and Sextans B. We do not detect any CO emission but derive very sensitive upper limits. We use the KMT+ models presented in Krumholz (2013) and some reasonable physical assumptions to calculate a prediction for the estimated total mass of H2 in the three galaxies, as well as the expected CO luminosity. We find that even under optimistic circumstances, CO will be extremely difficult to observe in Leo P with current technology. On the other hand, CO luminosities as low as 100 K km s-1 pc-2 can be detected with a modest amount of ALMA time, so Sextans A and Sextans B should be observable with ALMA. If future observations do find CO emission in Leo P, then this may imply that the parameters in the KMT+ model and/or our assumptions about the physical conditions in Leo P are flawed in some way.
Even though CO (1-0) has been the main tracer of molecular material in high-metallicity galaxies, other tracers of molecular gas need to be explored in low-metallicity systems. We suggest several useful observations that can trace molecular material in these systems.
-
1.
If the abundance of CO is low and the emission is optically thin, observations of CO (J = 2 1) may be a more sensitive probe of molecular gas in low-metallicity galaxies. The excitation conditions of the 2-1 transition are not particularly stringent, and the Rayleigh-Jeans brightness temperature can be up to 4 times higher than for the 1-0 transition in warm gas in LTE for optically thin emission.
-
2.
Continuum observations at sub-mm wavelengths (e.g., with ALMA Band 9) would allow for a derivation of the dust content. It is interesting to note that the optical imaging and spectroscopy presented in Rhode et al. (2013), McQuinn et al. (2013), and Skillman et al. (2013) each allow for the presence of a modest amount of differential extinction within Leo P. If dust is detected in Leo P, then this can be used to infer the presence of molecular material. We note that the observations of the Local Group galaxy WLM presented in Jackson et al. (2004) made exactly such a prediction; the subsequent detections of CO in this system (Elmegreen et al., 2013) now represent the most metal-poor CO measurement to date.
-
3.
Observations of warm H2 emission lines in the infrared would allow for a direct search for molecular material; while there would remain uncertainties about the excitation and temperature of the gas, such a detection of H2 that is co-spatial with the H I maximum and star formation would provide the possibility for cooler H2 as well.
-
4.
Emission from the [C II] 158 m line has been interpreted as a tracer of molecular gas in metal-poor environments (Madden et al., 1997). Observations in this transition are possible with current instrumentation (SOFIA), and could confirm the theoretical predictions described in the models discussed above (e.g., Bolatto et al., 1999).
References
- Arimoto et al. (1996) Arimoto, N., Sofue, Y., & Tsujimoto, T. 1996, PASJ, 48, 275
- Bell et al. (2006) Bell, T. A., Roueff, E., Viti, S., & Williams, D. A. 2006, MNRAS, 371, 1865
- Bernstein-Cooper et al. (2014) Bernstein-Cooper, E. Z., Cannon, J. M., Elson, E. C., et al. 2014, AJ, 148, 35
- Bigiel et al. (2008) Bigiel, F., Leroy, A., Walter, F., et al. 2008, AJ, 136, 2846
- Bigiel et al. (2011) Bigiel, F., Leroy, A. K., Walter, F., et al. 2011, ApJ, 730, L13
- Bolatto et al. (1999) Bolatto, A. D., Jackson, J. M., & Ingalls, J. G. 1999, ApJ, 513, 275
- Bolatto et al. (2003) Bolatto, A. D., Leroy, A., Israel, F. P., & Jackson, J. M. 2003, ApJ, 595, 167
- Bolatto et al. (2008) Bolatto, A. D., Leroy, A. K., Rosolowsky, E., Walter, F., & Blitz, L. 2008, ApJ, 686, 948
- Bolatto et al. (2011) Bolatto, A. D., Leroy, A. K., Jameson, K., et al. 2011, ApJ, 741, 12
- Bolatto et al. (2013) Bolatto, A. D., Wolfire, M., & Leroy, A. K. 2013, ARA&A, 51, 207
- Condon (1992) Condon, J. J. 1992, ARA&A, 30, 575
- Dalcanton et al. (2009) Dalcanton, J. J., Williams, B. F., Seth, A. C., et al. 2009, ApJS, 183, 67
- Dale et al. (2009) Dale, D. A., Cohen, S. A., Johnson, L. C., et al. 2009, ApJ, 703, 517
- Elmegreen et al. (2013) Elmegreen, B. G., Rubio, M., Hunter, D. A., et al. 2013, Nature, 495, 487
- Galametz et al. (2012) Galametz, M., Kennicutt, R. C., Albrecht, M., et al. 2012, MNRAS, 425, 763
- Giovanelli et al. (2013) Giovanelli, R., Haynes, M. P., Adams, E. A. K., et al. 2013, AJ, 146, 15
- Glover & Mac Low (2007) Glover, S. C. O., & Mac Low, M.-M. 2007, ApJS, 169, 239
- Glover & Mac Low (2011) Glover, S. C. O., & Mac Low, M.-M. 2011, MNRAS, 412, 337
- Glover & Clark (2012a) Glover, S. C. O., & Clark, P. C. 2012, MNRAS, 421, 9
- Glover & Clark (2012c) Glover, S. C. O., & Clark, P. C. 2012, MNRAS, 426, 377
- Güsten et al. (2006) Güsten, R., Nyman, L. Å., Schilke, P., et al. 2006, A&A, 454, L13
- Herrera-Camus et al. (2012) Herrera-Camus, R., Fisher, D. B., Bolatto, A. D., et al. 2012, ApJ, 752, 112
- Holmberg & Flynn (2000) Holmberg, J., & Flynn, C. 2000, MNRAS, 313, 209
- Hunt et al. (2014) Hunt, L. K., Testi, L., Casasola, V., et al. 2014, A&A, 561, A49
- Israel et al. (1995) Israel, F. P., Tacconi, L. J., & Baas, F. 1995, A&A, 295, 599
- Israel (1997) Israel, F. P. 1997, A&A, 328, 471
- Jackson et al. (2004) Jackson, D. C., Skillman, E. D., Cannon, J. M., & Côté, S. 2004, AJ, 128, 1219
- Kennicutt (1998) Kennicutt, R. C., Jr. 1998, ApJ, 498, 541
- Kennicutt et al. (2008) Kennicutt, R. C., Jr., Lee, J. C., Funes, S. J., José G., Sakai, S., & Akiyama, S. 2008, ApJS, 178, 247
- Kniazev et al. (2005) Kniazev, A. Y., Grebel, E. K., Pustilnik, S. A., Pramskij, A. G., & Zucker, D. B. 2005, AJ, 130, 1558
- Krumholz et al. (2008) Krumholz, M. R., McKee, C. F., & Tumlinson, J. 2008, ApJ, 689, 865
- Krumholz et al. (2009a) Krumholz, M. R., McKee, C. F., & Tumlinson, J. 2009, ApJ, 693, 216
- Krumholz et al. (2009b) Krumholz, M. R., McKee, C. F., & Tumlinson, J. 2009, ApJ, 699, 850
- Krumholz (2012) Krumholz, M. R. 2012, ApJ, 759, 9
- Krumholz (2013) Krumholz, M. R. 2013, MNRAS, 436, 2747
- Lee et al. (2009) Lee, J. C., Gil de Paz, A., Tremonti, C., et al. 2009, ApJ, 706, 599
- Lequeux et al. (1994) Lequeux, J., Le Bourlot, J., Pineau des Forets, G., et al. 1994, A&A, 292, 371
- Leroy et al. (2005) Leroy, A., Bolatto, A. D., Simon, J. D., & Blitz, L. 2005, ApJ, 625, 763
- Leroy et al. (2007) Leroy, A., Cannon, J., Walter, F., Bolatto, A., & Weiss, A. 2007, ApJ, 663, 990
- Leroy et al. (2008) Leroy, A. K., Walter, F., Brinks, E., et al. 2008, AJ, 136, 2782
- Leroy et al. (2009) Leroy, A. K., Walter, F., Bigiel, F., et al. 2009, AJ, 137, 4670
- Leroy et al. (2011) Leroy, A. K., Bolatto, A., Gordon, K., et al. 2011, ApJ, 737, 12
- Lisenfeld & Ferrara (1998) Lisenfeld, U., & Ferrara, A. 1998, ApJ, 496, 145
- Madden et al. (1997) Madden, S. C., Poglitsch, A., Geis, N., Stacey, G. J., & Townes, C. H. 1997, ApJ, 483, 200
- Maloney & Black (1988) Maloney, P., & Black, J. H. 1988, ApJ, 325, 389
- Massey et al. (2007) Massey, P., Olsen, K. A. G., Hodge, P. W., et al. 2007, AJ, 133, 2393
- McKee (1989) McKee, C. F. 1989, ApJ, 345, 782
- McQuinn et al. (2013) McQuinn, K. B. W., Skillman, E. D., Berg, D., et al. 2013, AJ, 146, 145
- McQuinn et al. (2015) McQuinn, K. B. W., Skillman, E. D., Dolphin, A., et al. 2015, arXiv:1506.05495
- Ostriker et al. (2010) Ostriker, E. C., McKee, C. F., & Leroy, A. K. 2010, ApJ, 721, 975
- Ott et al. (2012) Ott, J., Stilp, A. M., Warren, S. R., et al. 2012, AJ, 144, 123
- Rhode et al. (2013) Rhode, K. L., Salzer, J. J., Haurberg, N. C., et al. 2013, AJ, 145, 149
- Rubio et al. (1993) Rubio, M., Lequeux, J., & Boulanger, F. 1993, A&A, 271, 9
- Schruba et al. (2011) Schruba, A., Leroy, A. K., Walter, F., et al. 2011, AJ, 142, 37
- Schruba et al. (2012) Schruba, A., Leroy, A. K., Walter, F., et al. 2012, AJ, 143, 138
- Skillman & Kennicutt (1993) Skillman, E. D., & Kennicutt, R. C., Jr. 1993, ApJ, 411, 655
- Skillman et al. (2013) Skillman, E. D., Salzer, J. J., Berg, D. A., et al. 2013, AJ, 146, 3
- Spaans & Carollo (1997) Spaans, M., & Carollo, C. M. 1997, ApJ, 482, L93
- Spaans & Norman (1997) Spaans, M., & Norman, C. A. 1997, ApJ, 483, 87
- Spitzer (1948) Spitzer, L., Jr. 1948, ApJ, 107, 6
- Shi et al. (2015) Shi, Y., Wang, J., Zhang, Z.-Y., et al. 2015, ApJ, 804, L11
- Shu et al. (1987) Shu, F. H., Adams, F. C., & Lizano, S. 1987, ARA&A, 25, 23
- Taylor et al. (1998) Taylor, C. L., Kobulnicky, H. A., & Skillman, E. D. 1998, AJ, 116, 2746
- van Dishoeck & Black (1988) van Dishoeck, E. F., & Black, J. H. 1988, ApJ, 334, 771
- Warren et al. (2012) Warren, S. R., Skillman, E. D., Stilp, A. M., et al. 2012, ApJ, 757, 84
- Weisz et al. (2011) Weisz, D. R., Dalcanton, J. J., Williams, B. F., et al. 2011, ApJ, 739, 5
- Wilson (1995) Wilson, C. D. 1995, ApJ, 448, L97
- Wolfire et al. (1995) Wolfire, M. G., Hollenbach, D., McKee, C. F., Tielens, A. G. G. M., & Bakes, E. L. O. 1995, ApJ, 443, 152
- Young & Scoville (1982) Young, J. S., & Scoville, N. 1982, ApJ, 258, 467
| Parameter | Leo P | Sextans A | Sextans B |
|---|---|---|---|
| Right ascension (HH:MM:SS J2000) | 10:21:45 | 10:11:07 | 09:59:59 |
| Declination (DD:MM:SS J2000) | +18:05:15 | -04:42:16 | +05:19:44 |
| Distance (Mpc) | 1.62 0.15aaMcQuinn et al. (2015) | 1.380.05bbDalcanton et al. (2009) | 1.390.04bbDalcanton et al. (2009) |
| MB (Mag.) | -8.970.10ccRhode et al. (2013) | -13.710.08bbDalcanton et al. (2009) | -13.880.06bbDalcanton et al. (2009) |
| Metallicity (12+log(O/H)) | 7.170.04ddSkillman et al. (2013) | 7.540.06eeKniazev et al. (2005) | 7.530.05eeKniazev et al. (2005) |
| M (106 M☉)ffTotal galaxy H I mass. | 0.81aaMcQuinn et al. (2015) | 62.1hhOtt et al. (2012) | 41.5hhOtt et al. (2012) |
| H I velocity range (km s-1) | 250-294ggBernstein-Cooper et al. (2014) | 279-366hhOtt et al. (2012) | 259-346hhOtt et al. (2012) |
| L (log erg s-1) | 36.79ccRhode et al. (2013) | 38.66iiKennicutt et al. (2008) | 38.20iiKennicutt et al. (2008) |
| SFR (10-4 M☉ yr-1)jjEstimated by converting the H luminosity to a SFR via the relation in Kennicutt (1998). | 0.5 | 36.3 | 12.6 |
| SFRkkLee et al. (2009) (10-4 M☉ yr-1) | 120.2 | 51.3 | |
| Observed region properties:mmValues computed within half-power beam radius of our observed regions. | |||
| M (106 M☉) | 0.3 | 8.8 | 4.7 |
| L (log erg s-1) | 36.79 | 38.33 | 37.59 |
| SFR (10-4 M☉ yr-1)jjEstimated by converting the H luminosity to a SFR via the relation in Kennicutt (1998). | 0.5 | 17.0 | 3.1 |
| SFR (10-4 M☉ yr-1)m,nm,nfootnotemark: | 50.0 | 11.5 | |
| Parameter | Leo P | Sextans A | Sextans B |
|---|---|---|---|
| Velocity Resolution (km s-1) | 18.4 | 18.4 | 18.4 |
| Beam size() | 3.492.55 | 4.152.52 | 3.382.64 |
| Linear resolution (pc) | 2720 | 2817 | 2318 |
| rms Noise (mJy beam-1 channel-1) | 6.14 | 36.0 | 27.7 |
| 4 SCO Upper Limit (Jy beam-1 km s-1) | 0.45 | 2.65 | 2.04 |
| LCO Upper Limit (K km s-1 pc2) | 2900 | 12400 | 9700 |
| = 4.3a | = 70b | = 285c | ||||
|---|---|---|---|---|---|---|
| Galaxy | M (M⊙) | M/MHI | M (M⊙) | M/MHI | M (M⊙) | M/MHI |
| Leo P | 1.2104 | 0.015 | 2.0105 | 0.25 | 8.3105 | 1.0 |
| Sextans A | 5.3104 | 0.006 | 8.7105 | 0.10 | 3.5106 | 0.40 |
| Sextans B | 4.2104 | 0.009 | 6.8105 | 0.14 | 2.8106 | 0.60 |
| Galaxy | M | M | M | |||
|---|---|---|---|---|---|---|
| (M⊙/pc3) | (M⊙) | (M⊙/pc3) | (M⊙) | (M⊙/pc3) | (M⊙) | |
| Leo P | 0.001 | 34 | 0.01 | 87 | 0.1 | 257 |
| Sextans A | 0.001 | 1.1105 | 0.01 | 1.3105 | 0.1 | 2.2105 |
| Sextans B | 0.001 | 1.4104 | 0.01 | 2.2104 | 0.1 | 5.1104 |
| Galaxy | = 4.3 | = 70 | = 285 | Observeda | |
|---|---|---|---|---|---|
| Leo P | LCO = | 20 | 1.2 | 0.30 | 2900 |
| Sextans A | LCO = | 3.0104 | 1860 | 460 | 12400 |
| Sextans B | LCO = | 5100 | 310 | 77 | 9700 |
| Galaxy | log(M) (M⊙) | = 4.3 | = 70 | = 285 | Observeda | |
|---|---|---|---|---|---|---|
| Using SFR | ||||||
| Leo P | 5.0 | LCO = | 2.3104 | 1.4103 | 350 | 2900 |
| Sextans A | 6.53 | LCO = | 7.9105 | 4.9104 | 1.2104 | 12400 |
| Sextans B | 5.79 | LCO = | 1.4105 | 8.9103 | 2.1103 | 9700 |
| Using SFR | ||||||
| Sextans A | 7.0 | LCO = | 2.3106 | 1.4105 | 3.5104 | |
| Sextans B | 6.36 | LCO = | 5.3105 | 3.3104 | 8.0103 | |