Towards Meaningful Maps of Polish Case Law
,
This a draft version of the paper published in “Legal Knowledge an Information Systems, JURIX 2015: The Twenty-Seventh Annual Conference”, Frontiers in Artificial Intelligence and Applications, Volume 279, edited by Antonino Rotolo, IOSPress, 2015. The final publication is available from IOSPress.
In this work, we analyze the utility of two dimensional document maps for exploratory analysis of Polish case law. Such maps reflect the structure of analyzed collection by grouping similar documents in a neighbouring regions of 2D space. This visual aid could be useful for browsing and searching, finding anomalous documents or quickly gaining synthetic knowledge about large corpora.
We started our study by selecting two automatic methods of generating document maps. First one is a standard method using linear principal component analysis (PCA) and visualizing two most important components on a scatter-plot. Second one is a modern nonlinear method of embedding multidimensional data in 2D, namely, the t-Distributed Stochastic Neighbor Embedding method (t-SNE) [1]. t-SNE is optimized to preserve local structure (i.e., very similar documents should end up close together) and to reduce the so called ,,crowding problem”. The ,,crowding problem” is undesired feature of many dimensionality reduction techniques, which essentially place many data points in a very small area of low-dimensional space (hence creating a crowd). These two features make t-SNE unique and frequently used in recent analyses of high-dimensional data.
The results of the PCA and t-SNE analysis of 2000 judgments from Polish courts are presented in Figure 1.
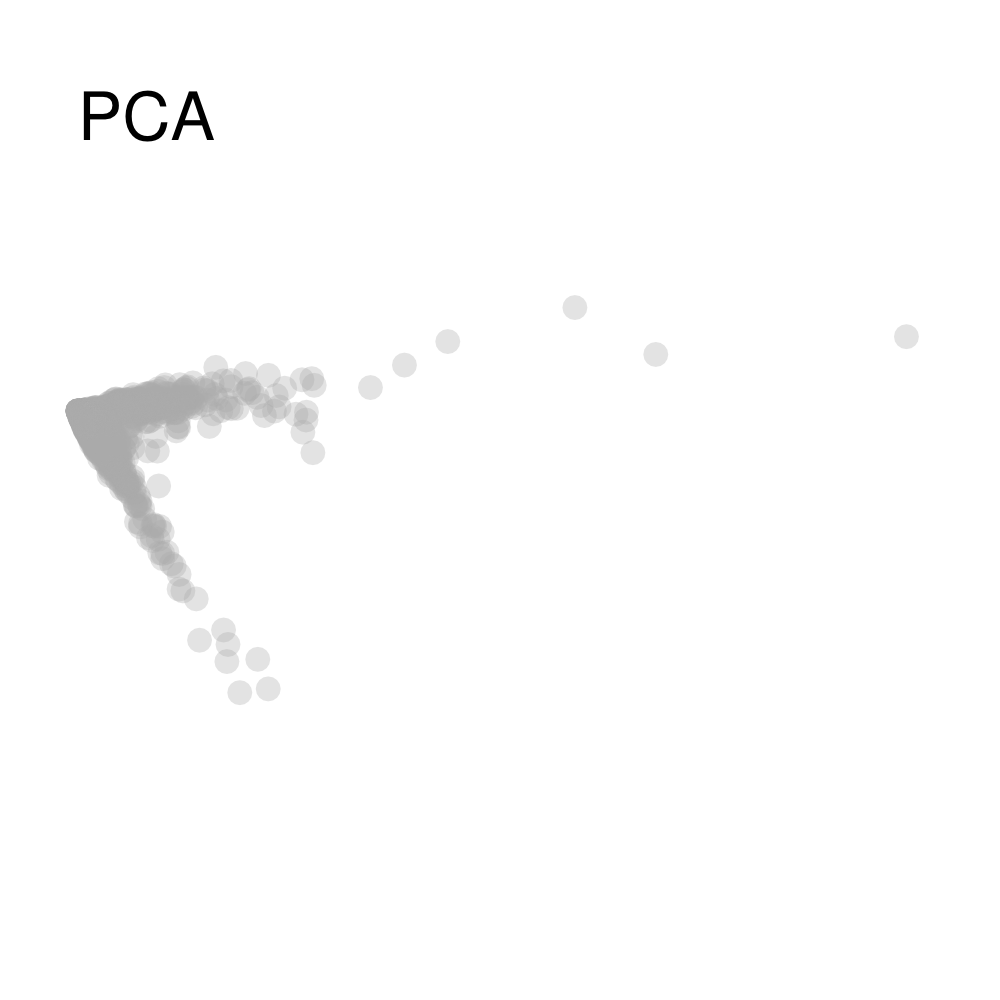
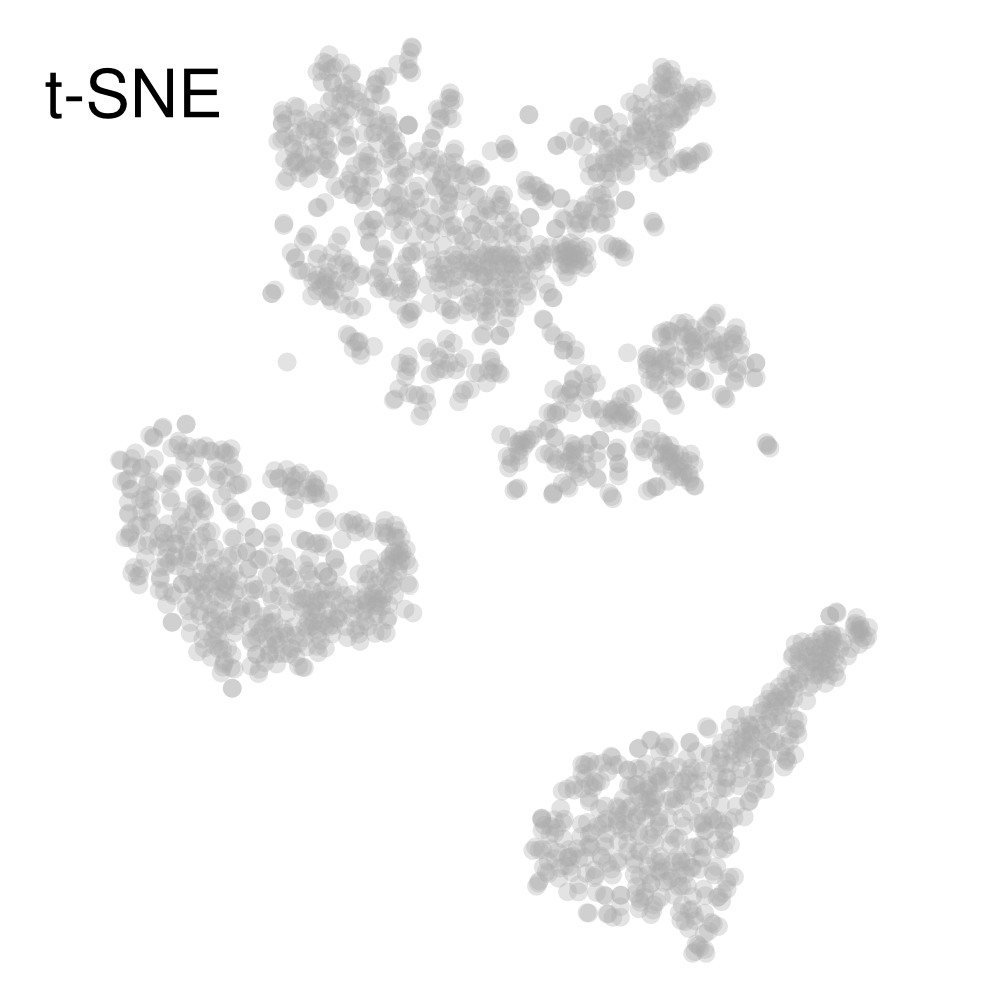
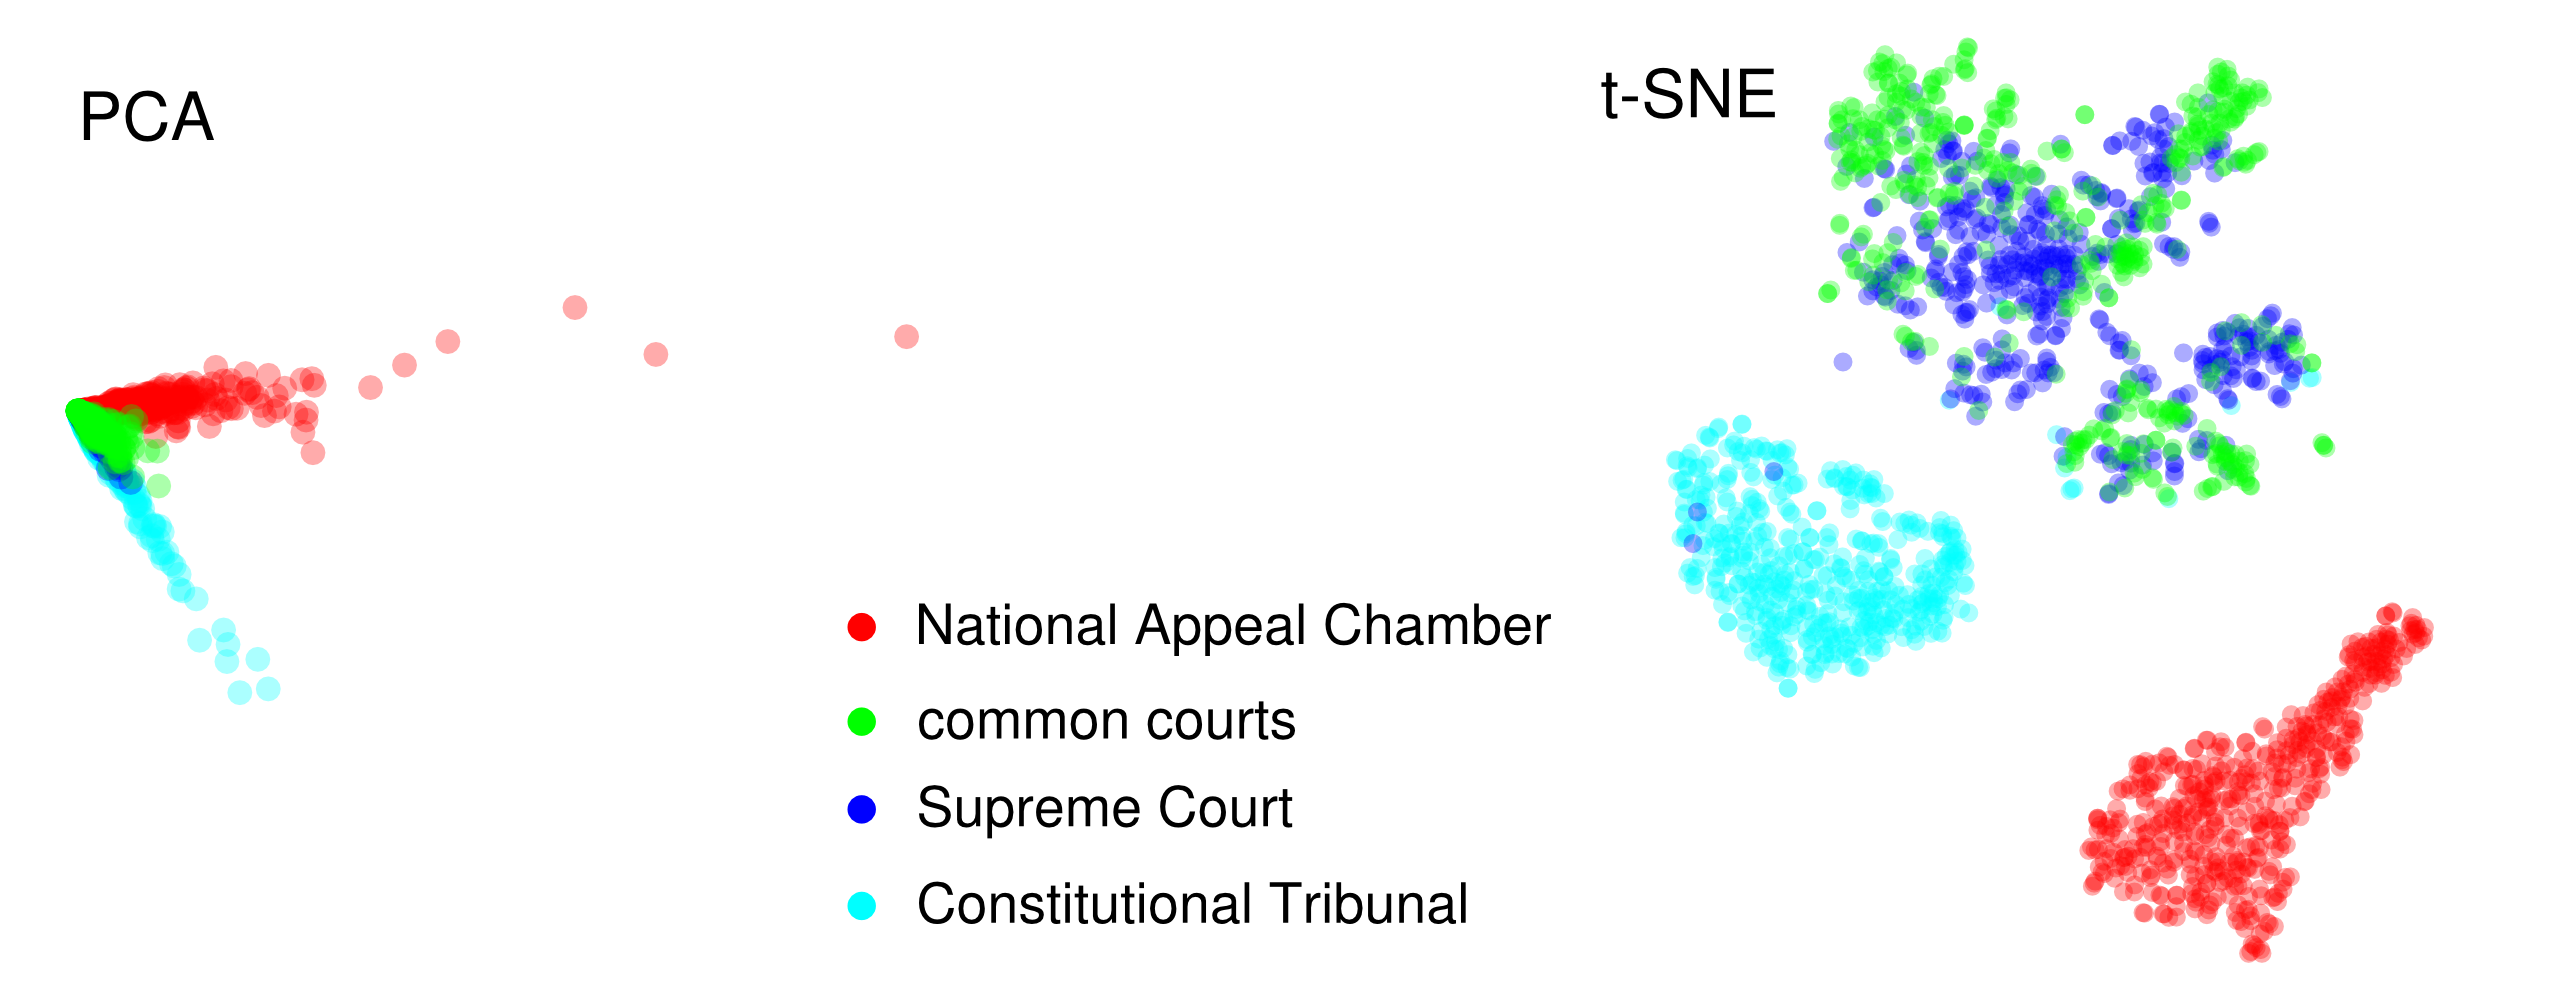
t-SNE approach forms three well separated clusters which occupy large fraction of available space. For PCA, there is no obvious structure visible, as well as most of the available space remains unused. In Figure 2, we added color-coded information about the document source (which was not directly used as a feature for computing the mapping!) to Figure 1. We find that indeed clusters visualized by t-SNE correspond to the judicial bodies. The common court judgments were merged together with the Supreme Court documents by t-SNE, hence three not four groups. In Poland, the Supreme Court is the court of last resort of appeal against judgments of common courts, so this artifact can be easily justified.
To further explore the utility of the t-SNE method, we visualized 2000 common court judgments selected randomly from documents tagged by five different keywords, see Figure 3.
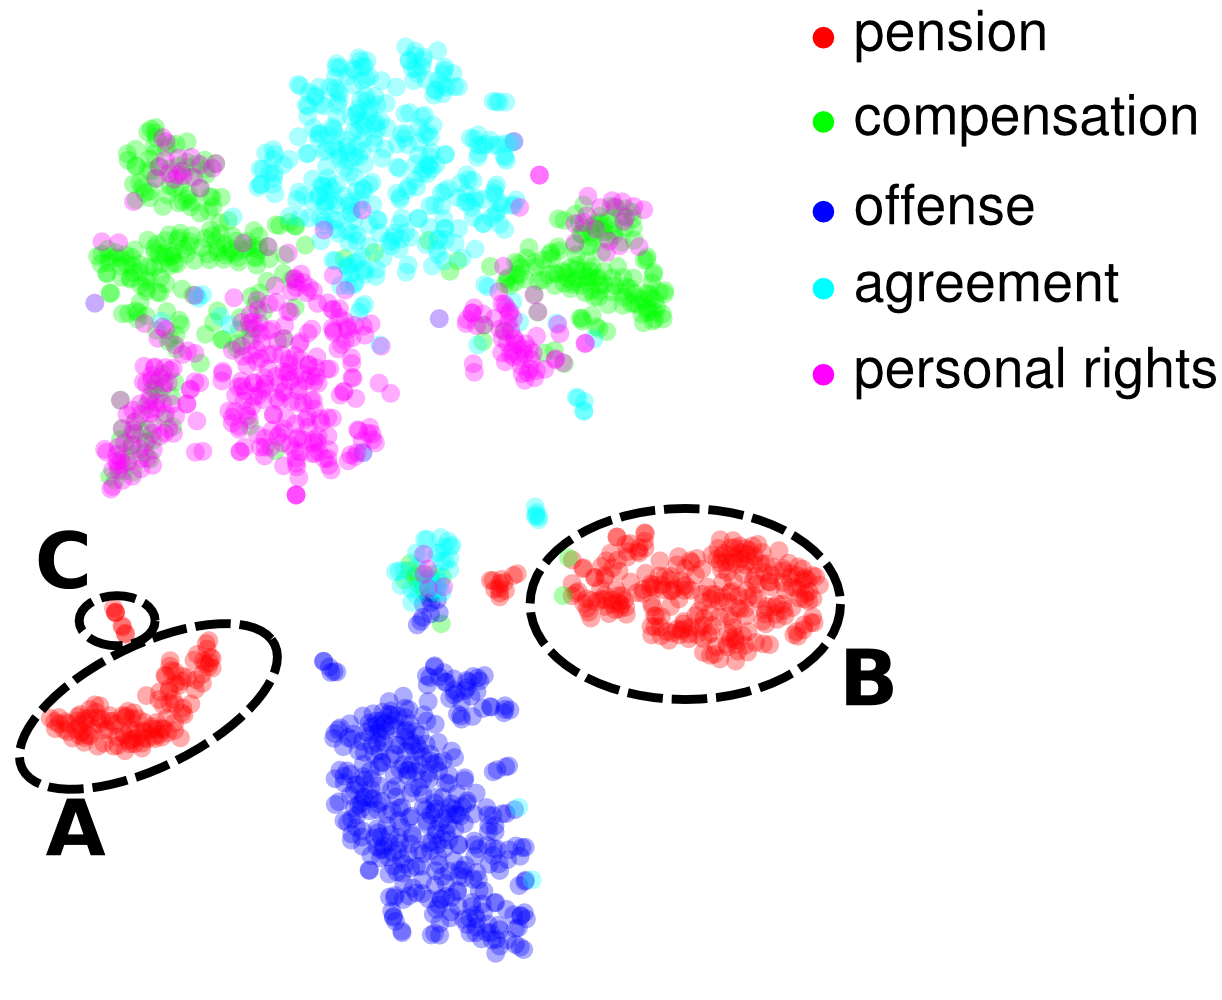
The graph generated by t-SNE mostly groups together documents labeled by the same keyword. Manual analysis of separated mapping regions related to word ,,pension” reveals hidden topical structure in the judgments. Region A turns out to correspond to cases about increase/recalculation of pension, B deals with actually granting a pension, C contains cases related to military pensions for which special regulations exist in Poland. This shows the potential of the t-SNE method in the exploratory analysis of judgments corpora.
To summarize, in our opinion t-SNE seems a promising approach to exploratory analysis of case law. After further investigation, t-SNE document maps may prove to be useful addition to legal information systems.
Acknowledgments. We acknowledge the support from the SAOS (http://saos.org.pl) project financed by the National Centre for Research and Development.
References
- [1] L. van der Maaten and G. Hinton. Visualizing data using t-SNE. Journal of Machine Learning Research, 9:2579, 2008.