The Age and Structure of the Galactic Bulge from Mira Variables
Abstract
We report periods and observations for 648 oxygen-rich Mira variables found in two outer bulge fields at and and combine these with data on 8057 inner bulge Miras from the OGLE, Macho and 2MASS surveys, which are concentrated closer to the Galactic centre. Distance moduli are estimated for all these stars. Evidence is given showing that the bulge structure is a function of age. The longer period Miras (, age Gyr and younger) show clear evidence of a bar structure inclined to the line of sight in both the inner and outer regions. The distribution of the shorter period (metal-rich globular cluster age) Miras, appears spheroidal in the outer bulge. In the inner region these old stars are also distributed differently from the younger ones and possibly suggest a more complex structure. These data suggest a distance to the galactic centre , of 8.9 kpc with an estimated uncertainty of kpc. The possible effect of helium enrichment on our conclusions is discussed.
keywords:
stars: AGB and post-AGB; Galaxy: bulge; stars: variables: general; infrared: stars; Galaxy: structure.1 Introduction
Detailed studies of the infrared surface brightness of the Galactic bulge (Matsumoto et al. 1982; Blitz & Spergel 1991) suggested a triaxial ellipsoid or bar with a major axis inclined to the line of sight and closer to us at positive Galactic longitudes. Whitelock & Catchpole (1992) see also (Whitelock 1992, 1993) used the distribution of individual bulge Mira variables, with distances from a near infrared period-luminosity relation, to show that these stars were in a bar with major axis at to the line of sight. Work on bulge structure to about 2009 was summarized in table 1 of Vanhollebeke et al. (2009) (also reproduced in Rich 2013). This table, together with later work (e.g. Gonzalez et al. 2011; Gerhard et al. 2012; Dékány et al. 2013; Pietrukowicz et al. 2012, 2015; Wegg et al. 2013; Cao et al. 2013; Vasquez et al. 2013; Gran et al. 2015; Nataf et al. 2015) shows that a large range of bar angles have been suggested. These are generally in the range to but have ranged from (Robin et al. 2003) to a near spherical distribution (Dékány 2013). Apart from observational uncertainties, one reason for this large range is the way the data have been handled. The locus of mean distance along lines of sight to the bulge can have quite a different slope to that of the major axis of a bar, derived from the same data using a model (e.g. Wegg 2013; Pietrukowicz et al. 2015). For instance, for RR Lyraes in a central bulge region Pietrukowicz et al. (2015) find an angle of from the mean distances in different directions and from an elliptical model. It is also now becoming realized that the observed bulge shape may depend on the region of the bulge being studied as well as on the type of tracers used.
Whilst, as documented by Rich (2013), there is a large range in metallicities among bulge stars, there has not been full agreement on the age range in the bulge. It seems clear that there is an old (globular cluster age) population in the bulge from the presence of a strong population of RR Lyrae variables and it has often been maintained that the bulge is entirely or almost entirely composed of a very old population (e.g. from colour-magnitude studies of a field at (Zoccali et al. 2003)). Clarkson et al. (2011) put the fraction of the population younger than 5 Gyr as at the most 3.4 percent in a field at . However, a recent study of microlensed stars in the bulge suggests at least a small population of young stars scattered through the bulge (Bensby et al. 2013). Bulge Mira variables, which show a wide range in periods and for which there is a period age relationship, have, in fact, long suggested a significantly younger population exists there. Nataf (2015) recently reviewed the evidence for and against the presence of a younger population and concluded that enhanced helium-enrichment would go some way to resolving the controversy.
In the present paper we report periods and photometry of 648 Mira variables in the bulge, chosen to study bulge structure. These observations are combined with 2MASS data for 8057 bulge Miras with OGLE and/or Macho periods, to study the structure of the bulge as a function of age as well as to estimate the distance to the Galactic centre.
2 Mira Variables
Mira variables are Asymptotic Giant Branch (AGB) stars with long pulsation periods ( days) and large amplitude variations (, mag). They are cool (K) and are generally understood to be near the end of the AGB evolutionary phase where they are rapidly losing mass (typically ). Kinematic and other studies (e.g. Feast & Whitelock 2000; Feast 2008) have shown that the period of a Mira is a good indication of its age and/or initial mass. This suggests that whilst the shorter period Miras (some of which are found in metal-rich globular clusters) are very old with , the bulk of Miras in the solar neighbourhood with are Gyr old111logarithms are to base 10 throughout this paper. An age of Gyr has been estimated at and in the following we refer to these as of “intermediate age”. Longer period Miras (including OH/IR stars which are generally long period Miras) are even younger.
As shown by Wood (2000), AGB variables lie on several parallel sequences in a period-luminosity (PL) diagram, where each sequence is a different pulsation mode. The Mira variables, which have larger amplitudes than the semi-regular (SR) variables, fall mostly on the PL relation corresponding to fundamental pulsation (sequence C in Wood 2000). However, at the long periods ( days) the mass-loss rates are sometimes sufficiently high that circumstellar extinction forces the apparent luminosity below the PL relation, unless the extinction is corrected for (e.g. Whitelock et al. 1991; Glass et al. 1995; Matsunaga et al. 2009).
In the Large Magellanic Cloud we also find a few Miras above the PL relation (e.g. Feast et al. 1989); these are believed to be relatively high mass hot-bottom-burning (HBB) stars (Whitelock et al. 2003, Menzies et al. 2015) possibly pulsating in the first overtone (Feast 2009). We expect these higher mass objects to be concentrated toward the centre and close to the plane. Their numbers in our fields are expected to be small and should not affect our discussion.
The Mira PL relation is potentially a very useful tool for distance scale studies, within the Galaxy and at larger distances, as recently summarized by Whitelock (2013). However, correction for both interstellar and circumstellar extinction must be made. This is discussed in section 5. The intrinsic colours of Galactic long period variables were discussed by Feast et al. (1982) and using these data Glass & Feast (1982) isolated an area of a two-colour diagram (their fig. 1) in which dereddened Miras are to be found. This is the referred to as the “Mira box” in the following discussion.
The atmospheric abundance of carbon relative to oxygen determines whether Miras are oxygen rich () or carbon rich (). Carbon enrichment happens during third dredge-up (Iben & Renzini 1984) in stars which have sufficiently large initial masses, and the existence or otherwise of carbon stars has sometimes been taken as evidence for or against the existence of an intermediate mass population. Note that more carbon must be dredged-up in order to produce carbon stars in a population that has a high initial oxygen abundance, as does the bulge, and that dredge-up efficiency depends on the initial abundance as well as on the initial mass, being less efficient at high metallicity or high helium abundance (Karakas et al. 2014 and references therein). The process of hot bottom burning (e.g. Boothroyd, Sackmann & Ahern 1993) prevents intermediate mass stars from becoming carbon rich, particularly at low metallicity, although this is probably not relevant to the Galactic bulge.
It should be noted that we assume that the Miras in the bulge are all or nearly all oxygen rich. Optical spectroscopy of giants suggests there are only a very few C-rich stars in the bulge (Blanco, McCarthy & Blanco 1984) and those few are faint, blue and probably the products of binary evolution. More recently Soszynski et al. (2013) have interpreted the OGLE light-curves of AGB stars as supporting an O-rich character for the majority of the variables. Relatively little is known about the chemistry of highly obscured variables towards the Galactic centre, except for those from which OH-Masers have been detected (e.g. Sevenster 1999), which are obviously O-rich. Cole & Weinberg (2002) are sometimes quoted as demonstrating the presence of numerous C-stars in the bar of the bulge, on the basis of 2MASS colours (and some unpublished spectra of the inner Galaxy). The interpretation of the 2MASS colours is based on the assumption that C stars have large colours, as is found in lower metallicity environments such as the LMC. However, the colours of mass-losing O-rich stars are very similar to those of C-stars and these will dominate in the higher metallicity Galactic bulge. Ojha et al. (2007) have questioned the Cole & Weinberg interpretation of the 2MASS colours and Ishihara et al. (2011) show, from a study of stars with both 2MASS and Akari photometry, that the majority of AGB stars in the direction of the Galactic centre are O-rich. This is confirmed by Uttenthaler et al. (2015).
3 Previous work on bulge Miras
The early optical survey of bulge Miras by Gaposchkin (1955), on plates taken by Baade and that of Oosterhoff et al. (1967, 1968), on plates taken by Thackeray and colleagues, as well as the work of Lloyd Evans (1976), indicated a broad range in period with most Miras having periods in the range 150 to 450 days in the NGC 6522, Sgr I and Sgr II windows (). Most of the bright IRAS sources delineating the overall structure of the bulge are Mira variables (Feast 1986; Glass 1986) and these tend to have even longer periods (Whitelock et al. 1991; Glass et al. 1995), with a few as long as days. It is possible that some of the longest period stars may be due to binary mergers as suggested by Renzini & Greggio (1990) (one probable example of such a process is a carbon rich Mira with a period of 551 days in a globular cluster (Matsunaga 2006; Feast et al. 2013). However, it seems very unlikely that this could be the source of all the 300 to 400 day Miras (see also section 2). Thus, taking the presence of long period Miras together with the discussion in section 2, indicates a substantial intermediate age population in the bulge.
As mentioned above, Whitelock & Catchpole (1992) and Whitelock (1992) observed 141 IRAS Miras in two strips on either side of the Galactic centre at and and made the first attempt to use individual stars to probe the structure of the bulge in three dimensions. A good fit to their data was given by a triaxial bulge inclined at to the line of sight. The relatively high Galactic latitude of the fields indicated a thick bar and there were suggestions of an “X” structure.
Sevenster (1999) discussed the distribution and velocities of 507 OH/IR stars within & . She finds evidence for an inclined bar as well as other structures. She also finds 9 stars from her young sample, lying along an HI feature identified with the 3 kpc arm. Groenewegen & Blommaert (2005) use DENIS and 2MASS colours to analyse 2691 Mira variables identified in the OGLE Survey. From these data they derive mean distances along various lines of sight and find evidence for a bar at an angle of to the line of sight.
Matsunaga, Fukushi & Nakada (2005) find 1968 Mira variables in the OGLE II data base. They assign them 2MASS colours and note that their surface density is similar to that of the 2.2m COBE image. The radial distribution shows a tilt towards us in positive longitudes. The work of Matsunaga et al. (2009) on Miras close to the centre is discussed in section 7.
4 Observations
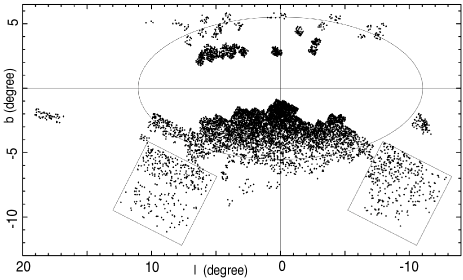
We selected two fields (the SAAO fields), both at , centred at (bulge East) and (bulge West) and each covering about 25 square degrees (see Figs. 1 & 5). Over a period of about six years, the AAO Schmidt was used to obtain IVN (-band) plates in each field, which are listed in Table 1. The Schmidt plates were scanned, using both the APM in Cambridge and the MAMA at the Paris Observatory, to find the long period variable candidates and their periods. The APM periods were found using phase dispersion minimization (Stellingwerf 1978) and the MAMA periods using the the method described by Schwarzenberg-Czerny (1996). The candidates were then observed with the SAAO 1.9-m telescope to obtain photometry in the SAAO system (Carter 1990). The error of individual observations is estimated to be 0.03 in and 0.05 in .
| East | West | ||
|---|---|---|---|
| Field 1834 -2500 | Field 1754 -4042 | ||
| Plate No. | Date. | Plate No. | Date |
| I14563 | 27/09/91 | I14565 | 28/09/91 |
| I14624 | 26/10/91 | I14609 | 14/10/91 |
| I14862 | 29/03/92 | I14631 | 28/10/91 |
| I14975 | 22/05/92 | I14852 | 27/03/92 |
| I15402 | 18/03/93 | I14903 | 22/04/92 |
| I15553 | 15/05/93 | I14909 | 24/04/92 |
| I15652 | 28/07/93 | I14974 | 22/05/92 |
| I16059 | 07/05/94 | I15039 | 02/07/92 |
| I16147 | 15/06/94 | I15093 | 29/07/92 |
| I16162 | 28/06/94 | I15134 | 25/08/92 |
| I17032 | 14/04/96 | I15151 | 06/09/92 |
| I17081 | 09/05/96 | I15377 | 13/03/93 |
| I17155 | 05/08/96 | I15481 | 16/04/93 |
| I17644 | 13/07/97 | I15552 | 15/05/93 |
| I17716 | 08/09/97 | I15592 | 14/06/93 |
| I15630 | 17/07/93 | ||
| I16051 | 04/05/94 | ||
| I16071 | 10/05/94 | ||
| I16134 | 03/06/94 | ||
| I17026 | 28/03/96 | ||
| RA | Dec | l | b | P | |||||
|---|---|---|---|---|---|---|---|---|---|
| (2MASS equinox 2000) | degree | day | magnitude | ||||||
| 265.439978 | -43.497269 | 347.14 | -6.93 | 245.1 | 9.94 | 8.89 | 8.44 | 7.96 | 1.17 |
| 265.443089 | -41.124081 | 349.18 | -5.69 | 227.1 | 10.30 | 9.25 | 8.80 | 8.34 | 1.40 |
| 265.512191 | -41.170151 | 349.17 | -5.76 | 239.1 | 9.81 | 8.82 | 8.39 | 7.68 | 1.40 |
| 265.513947 | -39.581005 | 350.53 | -4.94 | 257.1 | 9.41 | 8.40 | 7.92 | 7.19 | 1.89 |
| 265.542028 | -39.615677 | 350.51 | -4.97 | 353.1 | 9.38 | 8.26 | 7.62 | 6.97 | 1.82 |
| 265.543751 | -41.269283 | 349.09 | -5.84 | 271.1 | 9.29 | 8.35 | 7.86 | 7.19 | 1.44 |
| 265.548023 | -38.449688 | 351.51 | -4.37 | 427.2 | 9.59 | 8.05 | 7.23 | 6.37 | 3.20 |
| 265.555889 | -39.809402 | 350.35 | -5.08 | 347.1 | 8.56 | 7.45 | 6.84 | 6.20 | 1.79 |
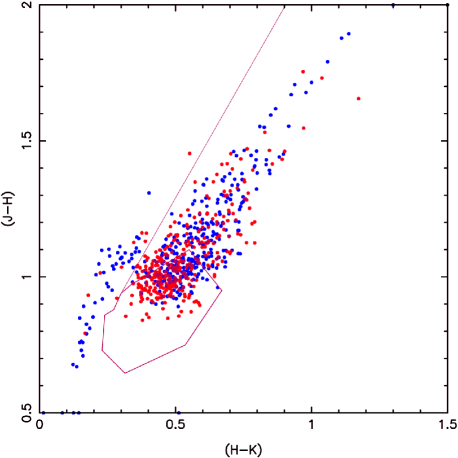
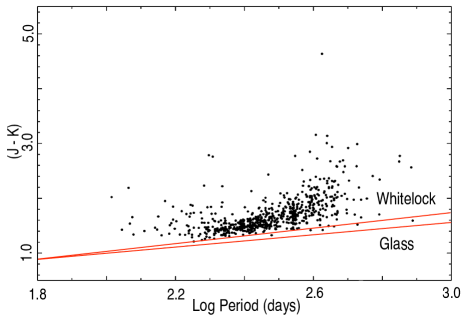
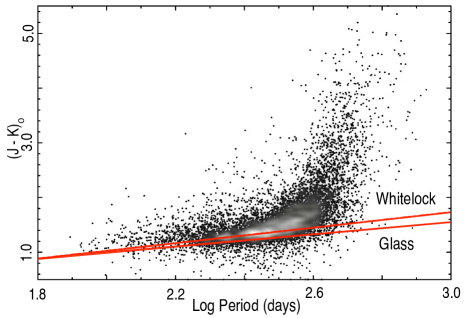
A , two-colour diagram, Fig. 2, was then used to distinguish between Miras and non-Miras. The region for unreddened local Miras is defined in this diagram by the Mira box (Feast et al. 1982) and all stars lying in this region and to the right of the line defining its upper reddened extension, are listed as Miras in Table 2. The Miras are shown in a / diagram in Fig. 3. The two straight lines are the locus of unreddened Miras discussed below.
Although most stars have only two observations 28 were observed an average of 10 times each to confirm the periods found from the photographic plates.
The magnitudes listed in Table 2 are mean values. All the stars have been identified with stars in the 2MASS catalogue and assigned 2MASS positions. These are listed in Table 2.
Ten stars in bulge West and 51 in bulge East, lie above the reddening line in Fig. 2. Dereddening will move them into the region of normal giant stars and they were omitted from the analysis.
The greater proportion of non-Miras in the East field probably arises from identification problems when carrying out observations at the telescope. This leaves a total of 341 Miras in bulge West and 307 in bulge East.
The OGLE survey (Soszynski et al. 2013) found 6528 Mira variables in the Galactic bulge region. A total of 1093 Mira variabes were also found in this region in the MACHO survey and are listed by Bernhard & Hümmerich (2013). Of these, 142 are common to the OGLE survey as are 16 stars in the SAAO fields. Five stars are common to the SAAO survey and the OGLE survey. Duplicates were eliminated to give a grand total of 8057 stars. The spatial distribution of these stars in the plane of the sky, is shown in Fig. 5.
Of the 21 stars common to our survey, 19 have MACHO or OGLE periods that agree within 2 days of our periods. Star number 277.00016 in Table 2, designated by its 2MASS R.A. has the largest difference. We find a period of 450 days and the MACHO survey finds a period of 463 days.

Fig. 4 shows a histogram of the periods of the bulge Miras discussed here. It shows a very broad distribution with most periods in the range ( days), but with tails to the short and long period ends. We might anticipate that this will be incomplete; at the very long period end extremely red Miras (e.g. extreme OH/IR sources) could have been missed by OGLE and by us (see also Whitelock et al. 1991), while at the short period end the Miras are faint. In globular clusters Miras have been found with periods of days. There are also Miras with periods around 300 days whose cluster membership requires confirmation. Miras in the solar neighbourhood cover a large range of period, but no one has yet produced a histogram for a given volume.
All the stars were identified in the 2MASS catalogue and their magnitudes transformed to the SAAO system, using the revised Carpenter (2001) transformation formulae given on ‘www.astro.caltech.edu/jmc/2mass/v3/transformations/’. For Miras with SAAO observations, the transformed 2MASS photometry was combined with our photometry, raising the average number of observations from two to three. There are uncertainties in these transformations when applied to Miras. However, as we discuss in section 7, analyses in the 2MASS system, are in close agreement with those in the SAAO system, suggesting that any uncertainty in the transformations has not affected our main conclusions.
5 Derivation of Extinction and Distance Modulus
The bulge Mira observations must be corrected for interstellar extinction and also, at least for the longer period stars, circumstellar extinction. Estimates of the total reddening (interstellar and circumstellar) were made in the following four (somewhat similar) ways:
-
1.
Whitelock. Uses the intrinsic relationship
(1) given by Whitelock et al. (2000) for local Galactic Miras. Note that at the longer periods this is an extrapolation (see the discussion on this point in Catchpole (1992)) and that some scatter will be introduced from the fact that we use observations from a single epoch, or small number of epochs, rather than mean colours. However, since Miras are redder when faint, there will be some compensation in the final distance modulus, after correcting for extinction.
-
2.
Glass. As for “Whitelock” but using the Glass et al. (1995) relationship for LMC Miras.
-
3.
JHK. In the , diagram (Fig. 2) moving all stars parallel to the direction of the reddening vector until they intercept a line orthogonal to the reddening vector, passing through , , which we define as the centre of the Mira box. This is close to correcting all the stars to . When compared with the Whitelock method, it under corrects the short period stars and over corrects the long period stars.
-
4.
Matsunaga. Derives reddenings and distance by comparing observations with PL relations in from the LMC (Matsunaga et al. 2009). In using these relations we first convert the SAAO photometry to the 2MASS system (see section 4) and adopt an LMC distance modulus of 18.49 (see below).
In addition estimates of the interstellar reddening alone, were made
using the extinction map described by Schlegel et al. (1998) and
recalibrated by Schlafly & Finkbeiner (2011), hereafter referred to as
Schlafly. This map describes the total
extinction through the Galaxy and should therefore, in principle be an upper limit.
Drimmel et al. (2003) made a three dimensional model of Galactic extinction, which Whitelock, Feast & van Leeuwen (2008) used iteratively, to correct for extinction. This model could not be used with the bulge Miras, first, because not all the lines of sight are included in the model and secondly, because many Miras lie beyond the distance limits of the model. However, in regions of overlap the Drimmel et al. model gives extinctions on average 0.06 magnitude greater than the Schlafly method.
Fig. 6 shows the / relations of Whitelock and Glass together with the bulge Miras, corrected only for interstellar reddening using the Schlafly extinction map. The effects of circumstellar reddening are clearly seen at the longer periods.
Extinctions in and were derived from the reddenings, using the reddening law given by Glass (1999). This is close to that derived by Nishiyama et al. (2006, 2009) for stars in the direction of the Galactic bulge.
A mean line drawn through the reddened Miras in Fig. 2 is not exactly parallel to the reddening line shown. This could be due to the circumstellar and/or interstellar reddening law being different from the one adopted. On the other hand, since the dereddened Miras are supposed to lie in the Mira box, it is quite possible that ones with very thick shells come from positions in the box to the right of those with thinner shells. That this is the likely explanation is shown by fig. 1 of Feast et al. (1982). The distribution of stars with longitude, indicated by colour in Fig. 2, suggest there is no systematic bias with longitude that will affect measurements of (see below).
There may even be some contribution to the flux by emission from their circumstellar shells, which is not accounted for, as was found by Whitelock (1987) in symbiotic Miras (her fig.3).
We note that the deviation of the Schlafly corrected Miras from the Whitelock line in Fig. 6 starts at as opposed to for the local Miras. At least some of this difference may be due to different selection effects for the different samples.
After correction for extinction, the distance modulus of each star is found using the relationship given by Whitelock et al. (2008)
| (2) |
The slope is derived from observations of LMC Miras and the zero point was derived from Hipparcos parallaxes of nearby Miras, VLBI parallaxes of OH-Miras and Hipparcos parallaxes of sub-dwarfs, which provide a distance calibration for globular cluster Miras. This calibration leads to a distance modulus of 18.49 for the LMC.
6 BULGE STRUCTURE AND AGE
| Log Period Range | All Longitudes | |||||
| day | kpc | N | kpc | N | ||
| SAAO Fields Only | ||||||
Previous work on the barred structure of the bulge has been summarized in section 2. As is clear from Fig. 5, the Miras in our sample at low Galactic latitude are primarily from OGLE and concentrated toward the centre. At higher latitude the sample is dominated by the new Miras reported in this paper, which are concentrated in two regions in the outer bulge with mean longitudes at . It is therefore convenient to discuss the low and higher latitude variables separately.
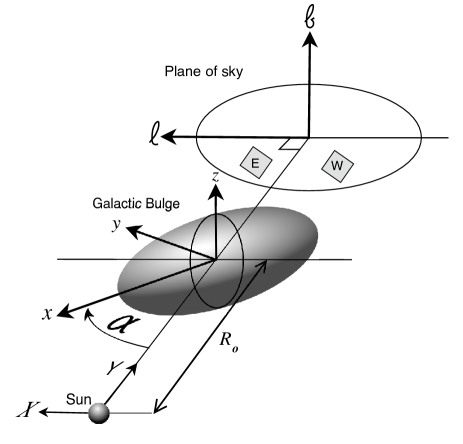
In the following subsections we adopt the simplest model, which is to fit straight lines to various samples of stars in distance modulus/longitude, giving unit weight to each star. The derived distance modulus of the Galactic centre and the angle of the distribution to the line of sight, are then converted into and in the XY plane. The relation between the two systems of coordinates is of course non-linear, but this is not of significance for our present purpose. Given the discussion in section 1, the angles derived for a bar may not correspond to those derived in other ways (particularly those derived from model fitting). However, we are primarily concerned with establishing whether or not various sub-samples of Miras show evidence (or not) of barred structure and also whether there are differences between different period groups of Mira variables.
6.1 .
The sample with consists essentially of the OGLE stars and is concentrated to low latitudes and longitudes in Fig. 5. The stars were divided into period groups of .
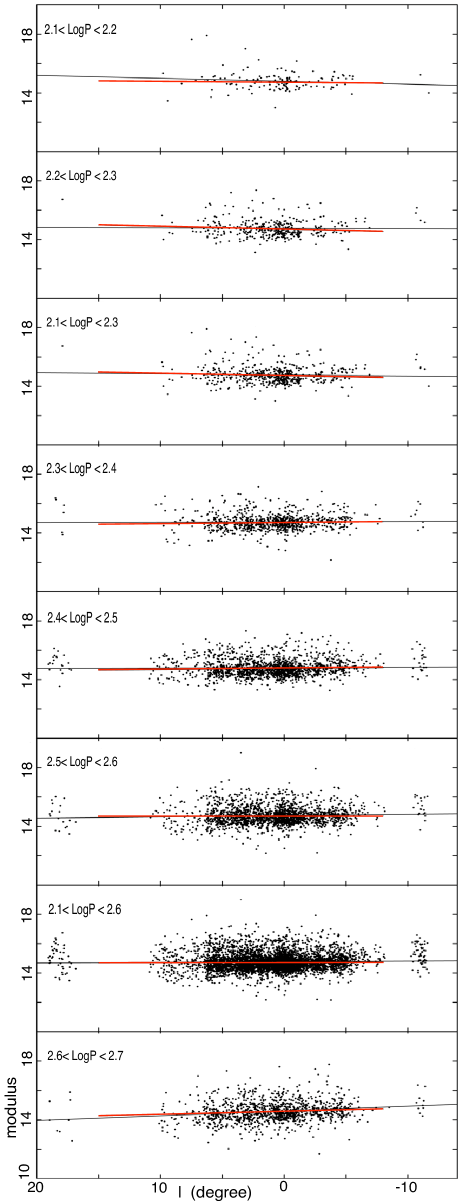
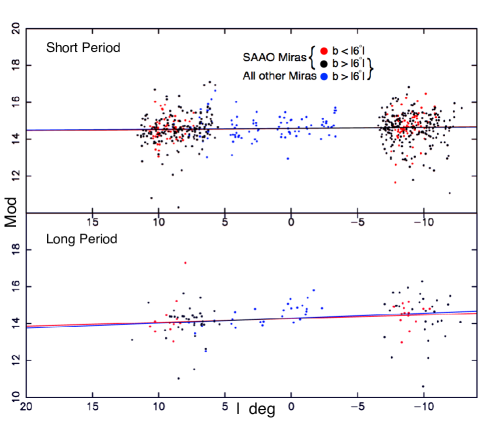
The results are shown in Fig. 7. The work of Nishiyama et al. (2005) (their fig. 4)
on bulge red clump stars at and of Pietrukowicz et al. (2012, fig. 14) on bulge RR Lyrae
variables at ,
shows that the maximum number density as a function of longitude
changes slope for
(although in opposite directions in these two cases). We show therefore least
square fits in Fig. 7
for all longitudes and for . The values of and derived are shown in
Table 3. The values of will be discussed later.
However, it should be noted that
the value for the longer period stars is sensitive to the correction for circumstellar
extinction. Note also that the values of are internal
only.
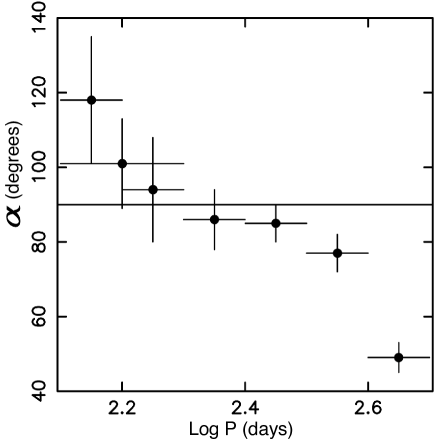
Despite considerable uncertainties, Table 3 suggests a change in with period, that is with age, which is illustrated in Fig. 8 for the first section of Table 3. This is particularly noticeable in comparing the groups with with the longest period group. We therefore also show in Table 3 and in Fig. 7, the results for between 2.1 and 2.6, which then may be compared with the longer period group (last two rows of the first section in Table 3). We deduce that the change of with period becomes marked at (short periods, ; long period ). Evidently the long periods show clear evidence of a barred structure. Whether the shorter period group is barred is less clear.
According to the discussion in Feast (2008) corresponds to an age of Gyr. Note that since we anticipate some spread in the period-age relation, we cannot decide clearly whether the results indicate a gradual change of structure with age, or the division into two different populations at . A gradual change in apparent bar angle might be due to varying bar thickness (see for instance López-Corredoira et al. 2007, Appendix), it is unlikely to be a real change. Nataf & Gould (2012) have suggested that the bulge contains a populations with enhanced helium abundance and Buell (2013) has discussed how this will change evolution on the AGB. Buell suggests that the youngest main sequence stars in the bulge have enhanced helium and ages between 2 and 4 Gyr, i.e. still much younger than the Globular Clusters. If our long period group are helium enhanced then we may not be able to deduce their ages from their periods by analogy with Miras of more normal composition. A full discussion of this must await detailed modeling and is beyond the scope of this paper, but our conclusion that the long period Miras are younger and are in a bar seems secure.
In the rest of the paper, the terms long and short period groups, refer to a division at . Fig. 9 shows the results for the short and long period groups, but with mean points for adjacent longitude bins that either contain 100 Miras or are wide. The lines in these plots are the solutions in Table 3. This allows the bulge structure to be discussed in more detail. The long period group clearly shows the inclined distribution indicative of a barred structure. However, the plot suggests a flatter structure (larger ) in the central region. In view of the error bars, too much weight should not be placed on this. Nevertheless, this structure is reminiscent of the distribution of red clump stars close to the Galactic equator (Nishiyama et al. 2005, fig. 4) which show an apparent increase in for , a change that may be removed by detailed modelling (Wegg & Gerhard 2013). It should be noted that the ages of red clump stars can cover a large range, so that the mean age of the Nishiyama stars is not known.
In Fig. 9 for the short period stars, there is, as previously noted, no significant evidence of a bar. However, the structure is complex. Apparently, the stars at lower longitudes are closer than those further out. In discussing this (and also the long period stars) it is necessary to remember that the stars at low longitudes are in the mean at lower latitudes (compare Fig. 5). Subdivision of the Miras by both latitude and longitude seems hardly feasible given the size of our sample. We therefore conclude that the short period (old) group of Miras shows little evidence of barred structure but that more complex structure is evident.
The variation of bulge structure with Mira period indicates that at least the bulk of long period Miras are not the evolutionary product of merged binaries (and therefore belong to an old, low mass population), confirming their intermediate age status.
6.2 Miras at larger
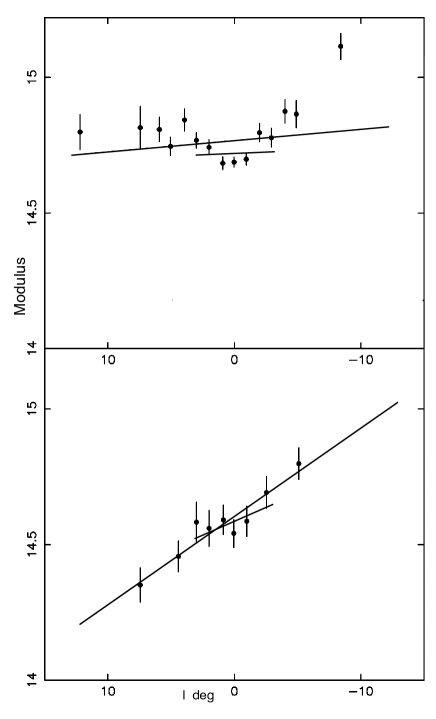
We first consider the Miras in the two SAAO fields shown in Fig. 5. In view of the discussion in the last subsection, we divided these stars into two groups; greater or less than 2.6. The results are shown in Fig. 10 and tabulated in Table 3.
The results are broadly similar to the inner region just discussed. For the short period stars, the results show little evidence of barred structure () and the mean moduli of the two SAAO fields differ only marginally (). For the long period group there is definite indications of a bar (), despite the fact that the error is largely due to the relatively small number of stars involved.
Because the SAAO fields are in outer, less dense bulge fields, the results might be affected by foreground and background stars. Table 5 therefore lists the results obtained using a 2- cut and also when restricting the sample to Miras between distance moduli of 13 and 16. We have also experimented with truncating at a fixed distance either side of the centre. Truncating the data at kpc about the best fit, gives results similar to the truncation. Narrowing the truncation limits reduces both and for both the long and short period Miras, but maintains the difference in between them. The results for the long period stars show clear evidence for a bar with decreasing slightly in the restricted solutions. For the short period stars the restricted samples give a value of significantly different from . One interpretation of this would be a continuous variation in bulge structure with age, the oldest Miras having little or no barred structure, consistent with Fig. 8.
The results for the inner bulge region tabulated in Table 3, show a smaller value of for the longer period (barred system) than for the shorter period one. Some of this difference may be due to problems of correctly accounting for circumstellar extinction. The difference between the short and long period stars is even more marked in the outer fields now being discussed and it seems worth investigating whether this is connected with (3D) bar structure.
Fig. 10 also shows the Miras which lie at . The points at large are mainly from the SAAO fields, those near are from the OGLE data. The results are shown in Table 3 and by the lines in Fig. 10. They are not significantly different from those just discussed. However, in Fig. 10, the long period Miras within , fall above the mean line and have a mean distance modulus of ( kpc). This suggests that the low value of for long period stars in fields with large is at least partly due to 3D structure and perspective effects.
6.3 Summary
Our results for the longer period (younger) Miras show the presence of triaxial, bar-like, structure in both our inner and outer fields. This confirms the result of Whitelock & Catchpole (1992) and Whitelock (1992) who found a tilted bar in a sample of mainly longer period Miras. These were concentrated in two, one degree wide, strips at extending between . The shorter period (old) Miras in our outer fields are consistent with a spheroidal or near-spheroidal distribution, though evidence of structure on a smaller scale is present. Gran et al. (2015) suggest that their results on RR Lyrae variables (another old population) in a field at are also consistent with a near spheroidal distribution. Furthermore, fig. 14 of Pietrukowicz et al. (2012) shows that the apparent distribution of RR Lyrae variables with becomes flat (larger ) as one moves from to . This same diagram shows that, in contrast, the red clump stars show a tilted bar at all in the plot. This seems to suggest that the bulk of the red clump stars in these regions belong to an intermediate age population. In our inner region, the shorter period (old) Miras show a different distance distribution from the younger ones in Fig. 9, with no clear evidence for a bar, though there appears to be smaller scale structure present.
7 Distance to the centre ()
Glass & Feast (1982) made a first attempt to derive a distance to the Galactic centre from Mira variables in the NGC 6522 and Sgr I bulge windows of Baade (see also Glass et al. 1995). The matter is complicated by the barred nature of the bulge. Matsunaga et al. (2009) overcame this problem by detecting and studying Miras within 30 arcminutes of the Galactic centre. They obtained kpc based on an LMC distance modulus of 18.50. Estimates derived in other ways are listed by Feast (2013). A mean value of 8.0 kpc was adopted there with an uncertainty “probably less than 0.5 kpc”.
The values of listed in Table 3 are in reasonable agreement with the above values, given the likely effect of 3D structure on our values, as well as the presence of smaller scale structure etc., discussed in the previous section. We note again that the standard errors quoted are only internal.
| Method | kpc | N | kpc | N | ||
|---|---|---|---|---|---|---|
| None | 4883 | 1182 | ||||
| Interstellar only (Schlafly) | 4883 | 1182 | ||||
| Whitelock | 4883 | 1182 | ||||
| Glass | 4883 | 1182 | ||||
| JHK | 4883 | 1182 | ||||
| Method | kpc | N | kpc | N | ||
|---|---|---|---|---|---|---|
| 4671 | 1132 | |||||
| 4326 | 1038 | |||||
| 4607 | 1107 | |||||
| No limit | 4883 | 1182 | ||||
| SAAO Fields Only | ||||||
| 486 | 85 | |||||
| 464 | 84 | |||||
| 491 | 88 | |||||
| No limit | 525 | 94 | ||||
Table 4 shows how the derived values of and vary using different methods of correcting for interstellar and circumstellar extinction. ‘None’ indicates that no extinction correction was made. The main significance of this table is to show that values of are insensitive to the extinction corrections used. As expected, neglecting circumstellar extinction leads to an overestimate of , especially for the longer period stars. Using the “Matsunaga” method (section 5) leads to kpc for the short period group in Table 4 and kpc for the long period group, in good agreement with the “Whitelock” results in that table. The difference between these two values is probably a consequence of uncertainties in the reddening correction (see section 6) and/or due to the 3-dimensional structure (see section 8) of the bulge. Since the “Whitelock” results are in the SAAO system and the “Matsunaga” results in the 2MASS system, the agreement suggests that conversion between the systems has little effect on the results.
It is evident from, for example Fig. 7, that there is a considerable apparent spread in distance moduli of the Miras in any one direction. Part of this is no doubt real and part due to uncertainty in the derived moduli. The effects of truncating the sample in the SAAO fields was already discussed in section 6.2. The first part of Table 4 shows the effects of similar experiments with the lower latitude stars. The effects are relatively small, especially considering that the uncertainties in the results are dominated by external errors (see following paragraph). Truncation has the effect of slightly reducing the value of for the Miras at low latitude and increasing them for the high latitude SAAO fields, presumably because of the different balance between foreground and background objects.
Matsunaga et al. (2009) give some discussion of the real (external) errors of their value of derived from Miras in the region of the centre. They adopt 0.4 kpc for this quantity. Our Miras suffer less interstellar absorption than theirs but are further from the centre and are thus not fully model independent. This is particularly true of the longer period stars which are in a bar structure. The correction for circumstellar extinction is also more important for these latter stars. We thus adopt as our best estimate of the value for Miras with , restricted to and taking a mean of the last three estimates in Table 4 (8.9 kpc) and adopt Matsunaga’s error estimate (0.4 kpc).
8 Structures within the Bar
Whether on not there is small scale structure in the bulge is of considerable significance for its formation and evolution.
To illustrate possible structure, we have selected Miras within a restricted range of and over which the coverage is fairly uniform, as can be judged by looking at Fig. 5. The Miras are projected onto the Galactic, plane, after correcting for “Whitelock” extinction. The plane is divided into 0.15 kpc square bins and the number of Miras is counted in each bin. Each bin becomes an image pixel and the maximum number of stars in a pixel is 15 in the short period group and 7 in the long.
The maximum number of stars is used to scale the resulting image and normalise it to an intensity count of 255. The image is then smoothed and doubled in size to make it more legible. Images for the short and long period Miras are shown in Fig. 11. The restriction in and means that the images do not correspond to the subsets of data given in Table 3.
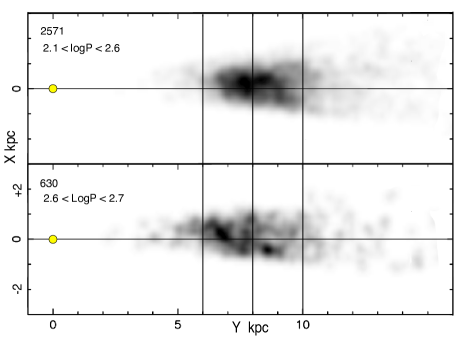
In Fig. 11 there is a strong contrast between the spatial distribution of old and intermediate age Miras. The short period group show a relatively smooth centrally concentrated distribution. The long period group show a clumpy structure as well as evidence of the tilted bar to which the two main clumps at 6.8 and 8.6 kpc seem to belong.
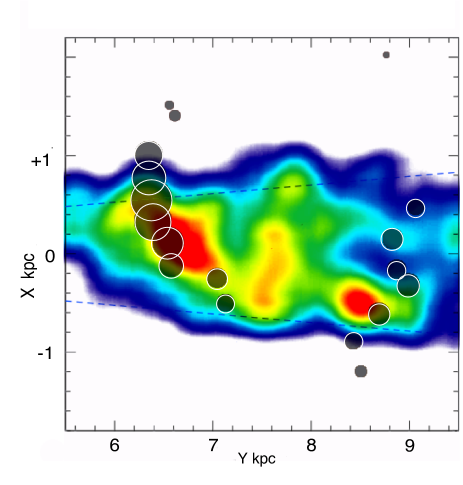
In Fig. 12 the clumping in the long period Miras is compared with the distribution of red clump stars found by McWilliam & Zoccali (2010) in the plane, shown in their fig. 6. They interpret these concentrations as the wings of an X shaped or triaxial bar, seen almost edge on to our line of sight, though this interpretation has been disputed (Lee, Joo & Chung 2015). The correspondence between some of their clumps and ours, shown in Fig. 12, suggests that the red clump stars and the long period Miras have similar distributions. Taken together with the results of the previous paragraph, this would indicate a more clumpy structure in a (younger) triaxial or X-shaped bar than in the older part of the bulge. It has been proposed that the bulge formed from the infall and eventual merger of large massive lumps (e.g. Noguchi 1999, Immeli et al. 2004, Ferraro et al. 2009, Massari et al. 2015) whether they could be long enough lasting to explain the observed clumping is not clear.
9 Conclusion
We have obtained periods and photometry for 648 Mira variables in two outer fields in the direction of the Galactic bulge and combined it with 8057 Miras found in the OGLE and Macho surveys of the inner bulge. Distances were derived from a period-luminosity relation together with corrections for interstellar and circumstellar extinction. In both our inner and outer regions the longer period Miras, tracers of an intermediate age population, give evidence of a tilted bar-like structure. The older, shorter period Miras do not show this. The longer period Miras also show a more clumpy structure than the shorter period ones, possibly part of an X-structure.
We estimate a distance to the Galactic centre in satisfactory agreement with other estimates.
The change of Mira distribution with period, besides showing the complex structure of the bulge, also indicates that the longer period stars there, are fundamentally different from the shorter period ones. It therefore supports the view that the longer period Miras in the bulge belong to an intermediate age population, as such stars do elsewhere, and are not, for instance, the progeny of the mergers of old (low mass) stars. The exact age of that intermediate age population may depend on abundance details and particularly on the level of helium enrichment.
10 Acknowledgements
We are grateful to the following people who took part in the infrared photometry programme at Sutherland, Brian Carter, Dave Laney and Enrico Olivier. MWF and PAW gratefully acknowledge a research grant from the SA National Research Foundation. We thank an anonymous referee for their comments and specifically for raising the question of the helium abundance. This paper uses observations made at the South African Astronomical Observatory (SAAO).
References
- [] Bensby T., Yee J. C., Feltzing S., et al., 2013, ApJ, 763, 141
- [] Bernhard A., Hümmerich S., 2013, OEJV, 159, 1
- [] Blanco V. M., McCarthy M. F., Blanco B. M., 1984, AJ, 89, 636
- [] Blitz L., Spergel D. N., 1991, ApJ, 379, 631
- [] Boothroyd A. I., Sackmann I.-J., Ahern S. C., 1993, ApJ, 416, 762
- [] Buell J. F., 2012, MNRAS, 428, 2577
- [] Cao L., Shude M., Nataf D., Rattenbury N. J., Gould A., 2013, MNRAS, 434, 595
- [] Carpenter J. M., 2001, AJ, 121, 2851
- [] Carter B. S. C., 1990, MNRAS, 242, 1
- [] Catchpole R. M., 1992, in: (ed.) Warner B., Variable Stars and Galaxies, ASP Conference Series, 30, 295
- [] Clarkson W. I., Sahu K. C., Anderson J., et al. 2011, ApJ, 735, 37
- [] Cole A. A., Weinberg M. D., 2002, ApJ, 574, L43
- [] Dékány I., Minniti D., Catelan M., Zoccali M., Saito R. K., Hempel M., Gonzalez O. A., 2013, AJ, 776, L19
- [] Drimmel R., Cabrera-Lavers A., Lopez-Corredoira M., 2003, A&A, 409, 205
- [] Feast M. W., 1986, in: Light on Dark Matter, Noordwijk, Reidel Publishing Co., p. 339
- [] Feast M. W., 2008, in: First Middle East-Africa, Regional IAU meeting, Cairo, Egypt. p. 3
- [] Feast M. W. 2009, in: AGB stars and related phenomena (Ueta T., Matsunaga, N. & Ita, Y., eds.), AGB stars and related phenomena, p. 48
- [] Feast M. W., 2013, in: (eds.) Oswalt T. W., Gilmore G., Planets, Stars and Stellar Systems, Vol. 5: Galactic Structure and Stellar Populations, Springer Science+Business Media Dordrecht, p 829
- [] Feast M. W., Menzies J. W., Whitelock P. A., 2013, MNRAS, 428, 36
- [] Feast M. W., Robertson B. S. C., Catchpole R. M., Lloyd Evans T., Glass I. S., Carter B. S. 1982, MNRAS, 201, 439
- [] Feast, M. W., Glass, I. S., Whitelock, P. A., Catchpole, R. M., 1989, MNRAS, 241, 375
- [] Feast M. W., Whitelock P. A., 2000, MNRAS, 317, 460
- [] Ferraro F.R. Dalessandro E., Mucciarelli A., et al., 2009, Nature, 462, 483
- [] Gaposchkin S., 1955, Var. Star. Bull. Acad. Sci. USSR, 10, 337
- [] Gerhard O., Martinez-Valpuesta I., 2012, ApJ, 744, L8
- [] Glass I. S., 1986, MNRAS, 221, 879
- [] Glass I. S., 1999, Handbook of Infrared Astronomy. Cambridge Univ. Press, Cambridge
- [] Glass I S., Feast M. W., 1982, MNRAS, 198, 199
- [] Glass I. S., Whitelock P. A., Catchpole R. M., & Feast, M. W., 1995, MNRAS, 273, 383
- [] Gonzalez O.A., Rejkuba M., Minniti D., Zoccali M., Valenti E.,, Saito R. K., 2011, A&A, 534, L14
- [] Gran F., Minniti D., Saito R. K., Navarrete C., Dékány I., McDonald I., Contreras Ramos R., Catelan M., 2015, A&A, 575, 114
- [] Groenewegen M. A. T., Blommaert J. A. D. L., 2005, A&A, 443, 143
- [] Iben I., Renzini A., 1983, ARAA, 21, 271
- [] Immeli A., Samland M., Gerhard O., Westera P., 2004, A&A, 413, 547
- [] Ishihara D., Kaneda H., Onaka T., Ita Y., Matsuura M., Matsunaga M., 2011, A&A, 534, A79
- [1] Karakas A. I., 2014, MNRAS, 445, 347
- [] Lee Y.-W., Joo S.-J., Chung C., 2015, MNRAS, 453, 3906L (arXiv:1508.05942)
- [] Lloyd Evans T. H. H., 1976, MNRAS, 174, 169
- [] López-Corredoira M., Cabrera-Lavers A., Mahoney T. J., Hammersley P. L., Garzón F., González-Fernández C., 2007, AJ, 133, 154
- [] Massari D., Dalessandro E., Ferraro F.R., 2015, ApJ, 810, 66
- [] Matsumoto T., Hayakawa S., Koizumi K., Murakami H., Uyama K., Yamagami T., Thomas J. A., 1982, AIP Conf. Proc., 83, 48
- [] Matsunaga N., 2006, PhD Thesis, University of Tokyo
- [] Matsunaga N., Fukushi H., Nakada Y., 2005, MNRAS, 364,117
- [] Matsunaga N., Kawadu T., Nishiyama S., Nagayama T., Hatano H., Tamura M., Glass I. S., Nagata T., 2009, MNRAS, 399, 1709
- [] McWilliam A., Zoccali M., 2010, ApJ, 724, 1491
- [] Menzies J. W., Whitelock P. A., Feast M. W., 2015, MNRAS, 452, 910
- [] Nataf D. M., 2015, PASA, in press, arXiv1509.00023v1
- [] Nataf D. M., Gould A. P. 2012, ApJ, 751, L39
- [] Nataf D. M., Udalski A., Skowron J., et al., 2015, MNRAS, 447, 1535
- [] Nishiyama S., Nagata T., Baba D., et al., 2005, ApJ, 621, L105
- [] Nishiyama S., Nagata T., Kusakabe N., et al., 2006, ApJ, 638, 839
- [] Nishiyama S., Tamura M., Hatano H., Kato D., Tanabe T., Sugitani K., Nagata T., 2009, ApJ, 696, 1407
- [] Noguchi M., 1999, ApJ, 514, 75
- [] Ojha, D. K., Tej, A., Schultheis, M., Omont, A., Schuller, F., 2007, MNRAS, 381, 1219
- [] Oosterhoff P. Th., Ponsen J., Schuurman M. C., 1967, Bull. Astr. Inst. Netherlands Supp., 1, 397
- [] Oosterhoff P. Th., Ponsen J., 1968, Bull. Astr. Inst. Netherlands Supp., 3, 79
- [] Pietrukowicz P., et al., 2012, ApJ, 750, 169
- [] Pietrukowicz P., et al., 2015, ApJ, 811, 113
- [] Renzini A., Greggio L., 1990, in: ESO/CTIO Workshop on bulges of Galaxies, La Serena, Chile, p. 47
- [] Rich R. M. 2013, in: (eds.) Oswalt T. W., Gilmore G., Planets, Stars and Stellar Systems, Vol. 5: Galactic Structure and Stellar Populations, Springer Science+Business Media Dordrecht, p. 272
- [] Robin A. C., Reylé C., Derrière S., Picaud S., 2003, A&A, 409, 523
- [] Schlafly E. F., Finkbeiner D. P., 2011, ApJ, 737, 103
- [] Schlegel D. J., Finkbeiner D. P., Davis M., 1998, ApJ, 500, 525
- [] Sevenster M., 1999, MNRAS, 310, 629
- [] Schwarzenberg-Czerny A., 1996, ApJ, 460, L107
- [] Soszynski I., Udalski A., Szymanski M. K., et al., 2013, Acta Astronomica, 63, 21
- [] Stellingwerf R.F., 1978, ApJ, 224, 953
- [] Uttenthaler S., Blommaert J. A. D. L., Wood P. R., Lebzelter T., Aringer B., Schultheis M., Ryde N., 2015, MNRAS, 451, 1750
- [] Vanhollebeke E., Groenewegen M. A. T., Giradi L., 2009, A&A, 498, 95
- [] Vásquez S., Zoccali M., Hill V., et al., 2013, A&A, 555,91
- [] Wegg C., Gerhard O., 2013, MNRAS, 435, 1874
- [] Whitelock P. A., 1987, PASP, 99, 573
- [] Whitelock P. A., 1992, in: (ed.) Warner B., Variable Stars and Galaxies, ASP Conference Series 30, p. 11
- [] Whitelock P. A., 1993, in: (eds.) De Jonghe H., Habing H. J., IAUS 153 Galactic Bulges, Kluwer Academic Publishers, p. 39
- [] Whitelock P. A., 2013, in: R de Grijs (ed.) Advancing the Physics of Cosmic Distances, IAUS, 289, 209
- [] Whitelock P. A., Catchpole R. M., 1992, in: (ed.) Blitz L., The Centre, Bulge and Disk of the Milky Way, Kluwer Academic Publishers, p. 103
- [] Whitelock P. A., Feast M. W., Catchpole R. M., 1991, MNRAS, 248, 276
- [] Whitelock P. A., Feast M. W., van Loon, J. T. H., Zijlstra, A. A., 2003, MNRAS, 342, 86
- [] Whitelock P. A., Feast M. W., van Leeuwen F., 2008, 386, 313
- [] Whitelock P., Marang F., Feast M. W., 2000 MNRAS, 319, 728
- [] Wood P. R. 2000, PASA, 17, 18
- [] Zoccali M., Renzini A., Ortolani S., et al., 2003, A&A, 399, 931