The Young Stellar Population of the Cygnus-X DR15 Region
Abstract
We present a multi-wavelength study of the young stellar population in the Cygnus-X DR15 region. We studied young stars forming or recently formed at and around the tip of a prominent molecular pillar and an infrared dark cloud. Using a combination of ground based near-infrared, space based infrared and X-ray data, we constructed a point source catalog from which we identified 226 young stellar sources, which we classified into evolutionary classes. We studied their spatial distribution across the molecular gas structures and identified several groups possibly belonging to distinct young star clusters. We obtained samples of these groups and constructed K-band luminosity functions that we compared with those of artificial clusters, allowing us to make first order estimates of the mean ages and age spreads of the groups. We used a 13CO(1-0) map to investigate the gas kinematics at the prominent gaseous envelope of the central cluster in DR15, and we infer that the removal of this envelope is relatively slow compared to other cluster regions, in which gas dispersal timescale could be similar or shorter than the circumstellar disk dissipation timescale. The presence of other groups with slightly older ages, associated with much less prominent gaseous structures may imply that the evolution of young clusters in this part of the complex proceeds in periods that last 3 to 5 Myr, perhaps after a slow dissipation of their dense molecular cloud birthplaces.
infrared: stars — infrared: ISM — X-rays: stars
1 Introduction
The star forming complex of Cygnus-X region is one of the most prominent features in our Galaxy. Originally detected as an extended region with a thermal spectrum, Piddington & Minnett (1952) named the region Cygnus-X, in order to distinguish it from the other nearby known radio source, Cygnus-A. Cygnus-X is composed of several OB associations, dozens of embedded stellar clusters, hundreds of HII regions and over 40 known massive protostars (see Reipurth & Schneider, 2008, for an extensive review). The young star population in Cygnus-X is currently interacting with one of the most massive molecular cloud complexes in the Galaxy, with a total mass of (Schneider et al., 2006), as well as the X-ray emitting Cygnus Superbubble. It has been proposed that Cygnus-X could be the precursor of a globular cluster (Knödlseder, 2000).
To study the interaction between recently formed star clusters and their surrounding medium in Cygnus-X could provide very important clues about the present evolution of the complex. It is particularly important to focus on the numerous embedded cluster populations and to compare the properties of clusters across the region. For instance: how embedded clusters proceed from formation to emergence from their parental gas clumps in such a strong ionizing medium? Is cluster formation or evolution in Cygnus-X determined by the local environment? What are the time scales from formation to gas dispersal? Also, what happens after cluster emergence: are subsidiary clusters destined to disperse or could they end up swelling the ranks of the main association? In any case, we should expect that multiwavelength analysis of the young star clusters in Cygnus-X will help to fine tune current ideas about the formation and evolution of embedded stellar clusters or groups.
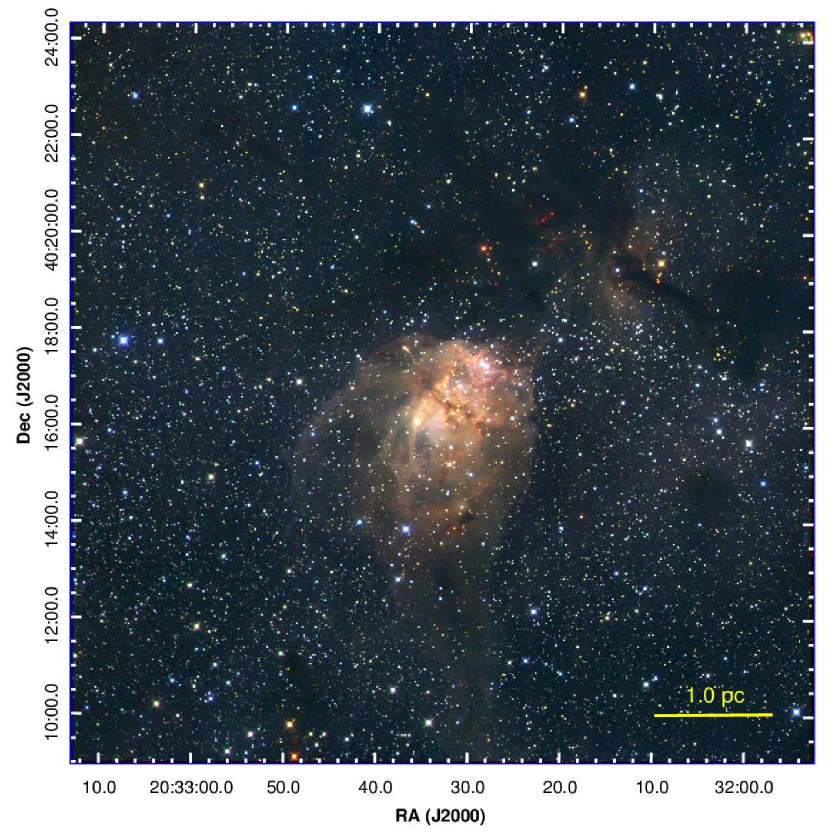
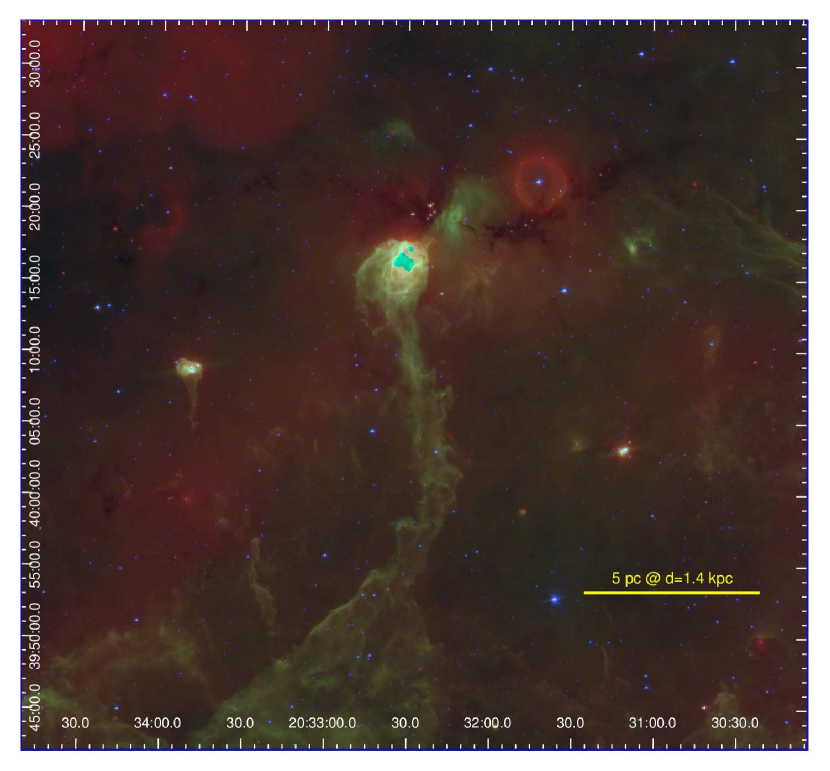
In this paper we selected to study one of the most prominent embedded cluster populations in Cygnus-X: the region DR15, also listed as cluster 10 in the survey of Dutra & Bica (2001). The DR15 region has been related to the HII region G79.306+0.282, the source IRAS 20306+4005/FIR-1 (Campbell et al., 1982), and sources IRS 1, 2 and 3 in the list of Kleinmann et al. (1979) (see also Odenwald et al., 1990). DR15 is located in the Cygnus-X South region, located at an estimated distance of 1.4 kpc (Rygl et al., 2012). The cluster contains one prominent far-infrared source (FIR-1), which marks the location of a compact HII region formed by a pair of B type embedded sources (Odenwald et al., 1990; Oka et al., 2001; Kurtz et al., 1994), however the cluster hosts various intermediate to massive stars which create a rather complex structure of photodissociation regions, forming a nebulous envelope which glows brightly in infrared images (see Figure 1). DR15 sits at the tip of a long (about 10 pc), filamentary pillar that extends into the southern edge of the central OB from DR12, lying in projection about 1 degree south from the Cyg-X3 star. The structure of the pillar appears to be protruding from the DR12 ridge (see Figure 2). The DR12-15 region in Cygnus-X possibly lies in front of the OB2 association, along our line of sight. A large filamentary infrared dark cloud (IRDC) with active star formation lies to the north and west of the cluster. This IRDC appears to be kinematically independent from DR15, as shown by Schneider et al. analysis. Recently, the western segment of the IRDC, has been shown to host a young stellar cluster in interaction with the Luminous Blue Variable (LBV) source G79.29+0.46 (Rizzo et al., 2008; Jiménez-Esteban et al., 2010). Distance to G79.29+0.46 has been also estimated to be 1.4 kpc (Rizzo et al., 2014; Palau et al., 2014).
Our main goal in this study is to track the progression of the star formation in the DR15 cluster and its immediate surroundings, by looking at the properties and distributions of the young stellar population. DR15 is especially interesting for being at a very specific stage at which it is already emerging from its parental cloud (some members and parts of the reflection nebulosities are already detectable in visible wavelengths). Moreover, the interesting case it presents at being apparently formed at the tip of a filamentary structure and next to a much younger star forming spot in the IRDC, is worth of detailed attention.
The paper is organized as follows: in Section 2 we describe the datasets used in this work. Section 3 is dedicated to describe the procedures we followed to acomplish a description of the history of star formation in the region, a result which we discuss in Section 4. Finally, a brief summary of our results can be found in Section 4.
2 Observations
For the first part of our analysis, we combined high-quality deep near-IR observations with images and catalogs from the Spitzer Cygnus-X Legacy Survey (Hora et al., 2009, hereafter CXLS). We also made use of archival data from the Chandra X-Ray Observatory. By combining these datasets we prepared a multi-wavelength photometry catalog for the stellar population in DR15, which we use to reconstruct the history of star formation in the region.
2.1 Near Infrared Observations
Near-infrared images of the Cygnus-X DR15 region were obtained with the OMEGA 2000 camera at the 3.5m telescope of the Calar Alto Observatory, atop Sierra de los Filabres in Almería, Spain, during the nights of February 2nd and March 3rd, 2010, with excellent weather conditions. The dataset consists of 900 second co-added exposures in the , and bands (1.209, 1.648 and 2.208 m, respectively). The seeing values –measured directly from the average FWHM of stars in the final reduced mosaics– were 1.17, 1.13 and 0.98 in , and , respectively.
The reduction of the images and the extraction of Point Spread Function (PSF) photometry lists for all bands were performed with custom IRAF pipelines, and the SExtractor algorithm (Bertin & Arnouts, 1996), following a methodology equivalent to the one described in Román-Zúñiga et al. (2010).
We constructed a near-IR catalog by matching individual filter photometry lists with the aid of TOPCAT (Taylor, 2005). We replaced saturated sources and a small number of missing detections in the Calar Alto images with values from the 2MASS Point Source Catalog, obtained at the Infrared Processing and Analysis Center (IPAC, Caltech). The 10 percent photometric depth values –indicated by the average brightness at which photometric error reaches a value of 0.1 mag– are 21.5, 20.0 and 18.75 mag in , and , respectively, and are good indicators of the completeness of the data. These limits are enough to sample the young star population in DR15 down to 0.09 M⊙ in regions of low to moderate extinction ( mag).
2.2 Spitzer Cygnus-X Legacy Survey data
The Spitzer Space Telescope has observed the DR15 cluster with the IRAC and MIPS detectors as part of the CXLS. We obtained archival enhanced product mosaics from the Spitzer Heritage Archive as well as a photometric catalog coincident with our region of interest directly from the CXLS Data Release 1 (DR1). The catalog contains calibrated magnitudes for sources detected with IRAC in its four cryogenic mission channels (3.6, 4.5, 5.8 and 8.0 m), as well as in the 24 m channel of MIPS. Using TOPCAT and IDL routines we combined our near-IR and the CXLS DR1 catalogs into a single infrared photometry list with a total of 46983 sources.
2.3 Chandra ACIS Observations
The DR15 cluster was observed with the Imaging Array of the Chandra Advanced CCD Imaging Spectrometer (ACIS-I) on 2011 January 25 (ObsID 12390, P.I. Wright) with net exposure time of 39.875 ks.
We processed the archival raw data using the routines from version 4.5 of the Chandra Interactive Analysis of Observations CIAO data analysis system (Fruscione et al., 2006). We used the chandrarepro reprocessing script to recalibrate our event data in order to ensure that consistent calibration updates were applied to the dataset.
The X-ray image processing was performed as follows: first, we created a exposure-corrected image from our data in the broad band (0.5 to 7 keV with an effective energy of 2.3 keV) using CIAO/fluximage routine with a bin size of 1. Second, we applied the wavedetect tool to our broad band image in order to identify potential X-ray sources. We used wavelet scales from 1 to 16.5 pixels in s.pdf of and a source significance threshold of .
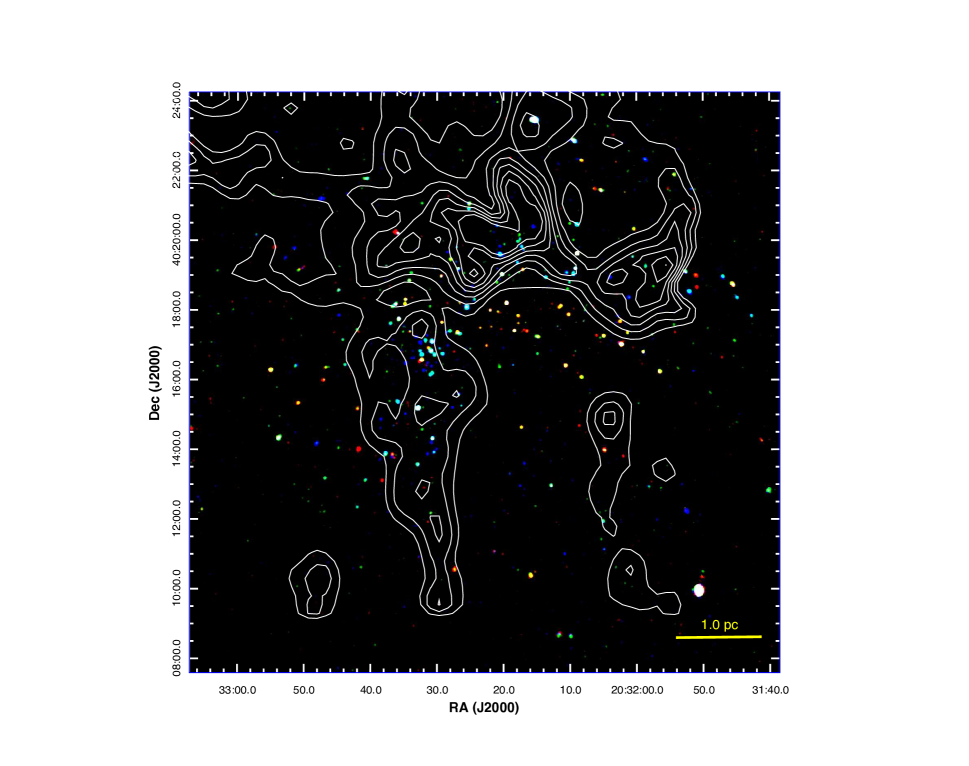
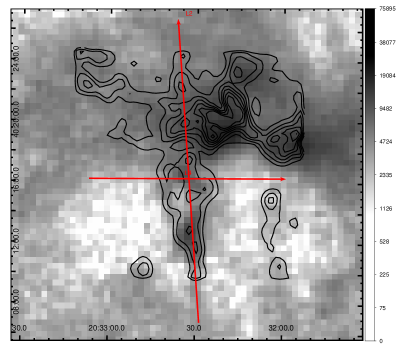
We performed photometry on the list provided by wavedetect using the the ACIS Extract (AE) package (Broos et al., 2010). AE permits an optimal determination of the local background and the best flux extraction apertures based on the PSF of the image. Photometry is then extracted on selected energy bands and a list of source properties, statistics and best fit spectral models is produced. We used three energy bands: Soft, from 0.2 to 2.0 keV, Medium, from 2.0 to 4.0 keV and Hard, from 4.0 to 7.0 keV. From the final list of sources produced by ACIS Extract we rejected those with a probability of 1 or higher of being a background fluctuation ). Our final lists contains a total of 131 X-ray sources. From these, a total of 109 (83.2%) sources have a counterpart in our IR catalog. In Figure 3 we show a false color (RGB) map of the ACIS field for DR15 using images from the three energy bands, overlaid with contours of visual extinction from the NICEST extinction map ww constructed from near-IR data. In there, we see how sources with hard X-ray emission are preferently located in regions of high column density. This is because soft X-ray bands are prone to oscuration by dust. We see how most of the X-ray sources are associated with the molecular cloud and the embedded population, confirming that most of the point source X-ray emission in DR15 comes from young stars.
2.4 FCRAO Observations
We made use of the Five College Radio Observatory (FCRAO) 13CO(1-0) molecular radio emission map of the South Cygnus-X region from the study of Schneider et al. (2011). The map is a RA-Dec-radial velocity cube, from which we extracted molecular gas properties using standard tools from the MIRIAD (Sault et al., 1995) package.
3 Analysis
We limited our region of study to the area covered with OMEGA 2000, defined as . The analysis described below correspond to sources falling within that area only.
3.1 Identification of YSOs
We identified Young Stellar Objects (YSOs) in the DR15 region, by applying color and brightness criteria to our multiwavelength catalog. For sources that were detected in the Spitzer IRAC and MIPS 24m bands, we classified Class I/0 (embedded protostars) and Class II (Classic T Tauri) sources using the criteria by Ybarra et al. (2013), we also required that these sources had photometric uncertainty values less than 0.25 mag in each band.
Our color criteria Ybarra et al. (2013) are essencially based in the color criteria of Gutermuth et al. (2008) and Kryukova et al. (2012), but as explained by Ybarra et al. we add an additional [5.8]-[8.0] criteria for objects that do not have a MIPS 24 detection. In addition, our use of photometry allows us to identify additional less bright candidates and with the use of X-ray data we are able to identify Class III sources that do not have an infrared excess.
Class III candidate sources were selected from a list of sources in the Chandra catalog that match in position with an infrared point source, after removing those corresponding to Class I/0 and Class II candidates. We added the requirement that
, because sources with are most likely either galaxies or spurious sources associated with diffraction spikes of bright stars. We further depurated this first counterpart list by keeping only those sources that had no evidence of a prominent circumstellar disk (i.e., we only selected stars with mostly photospheric emission). For this last criteria we used the vs color space:
and for those sources that do not have a detection in [4.5] we used:
The remaining list of Chandra-NIR counterparts are sources with evidence of a disk that were not previously selected as Class 0/I or II sources. We used the additional near-IR criteria of Gutermuth et al. to select a few more young sources from this group. If a Chandra counterpart had photometry in the first three IRAC bands, and photometric errors less than 0.1 mag in at least [3.6] and [4.5], then it was classified as a Class 0/I candidate if:
while for Class II candidate identification, we used:
A total of 20 sources could not be classified with these criteria if they did lack a detection in one or more bands, but if they fall to the right of the reddening band in the vs color space, they could be bonafide young sources. For 13 of these sources we determined their class (I or II) by inspecting their spectral energy distrubutions (SED), which we constructed using the SED fitting tool of Robitaille et al. (2007). Four additional sources were identified as possible AGN galaxies. The 3 remaining sources did not have enough IR bands to permit a clear classification and were discarded from the list.
In total, we identified in our selected region a total of 226 YSOs, distributed as follows: 26 Class I/0 candidates, 155 Class II candidates and 45 Class III candidates (11, 69 and 20 percent of the total, respectively). We list all identified YSOs in the tables of the Appendix A.
We matched our Class I, Class II and Class III catalogs against the catalog of Kryukova et al. (2014), out of 23 sources coinciding with our region of study, 17 were also identified as YSO candidates in this study. The 6 remaining sources lack emission is the [4.5] band and could not be confirmed as YSOs using our criteria.
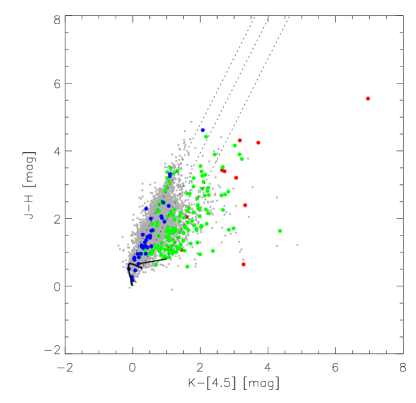
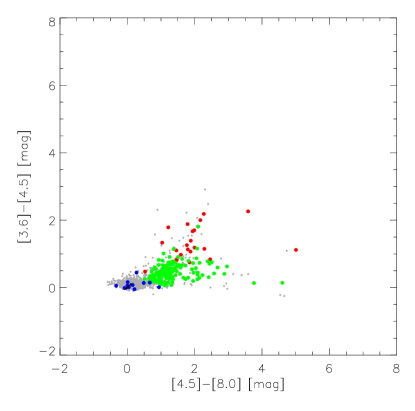
In Figure 4 we show the distribution of the classified YSOs in two different color-color diagrams. In the vs. diagram we can see that the most of Class I sources lie to the right of the reddening band indicating the presence of intense excess emission at IR wavelegths due to the stellar radiation in the dusty material of their envelopes or circumstellar disks. Class II sources also present infrared excess emission, although in a lesser way due the dust clearing within their inner disks. Then, the Class III sources lie within the reddening band or along the dwarf main sequence and lack significant infrared excess. The three groups of sources appear well separated in the [3.6]-[4.5] vs. [4.5]-[8.0] two-color diagram.
3.2 Dust Extinction and the Spatial Distribution of YSOs
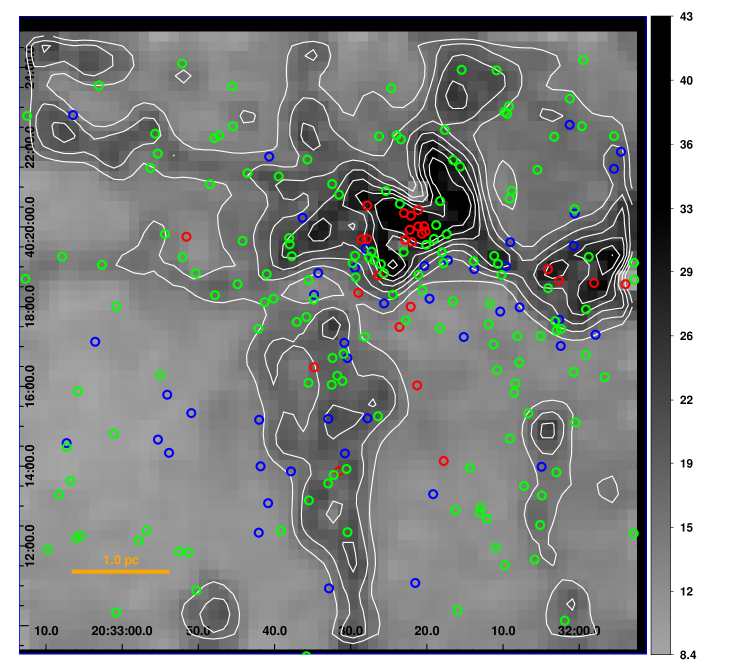
In Figure 5 we plot the spatial distribution of the YSOs on a dust extinction map. This dust extinction (AV) map for the DR15 region was constructed with the near-IR catalog an optimized version of the near-infrared excess (NICER) algorithm of Lombardi & Alves (2001), which estimates extinction using the dust-reddened colors of stars in the background of the cloud. In order to construct the map, we removed all sources with colors indicative of intrinsic infrared excess, which would bias the estimated extinction towards higher values. We used a sigma-clipping scheme to remove outlier values from the final weighted averages at each position. The map was constructed using Nyquist sampling on a equally spaced equatorial grid, smoothing the individual extinction estimates of background stars with a Gaussian filter of 30 FWHM (this implies a resolution near 0.2 pc at a distance of 1.4 kpc). In Figure 5 we see how the map clearly resolves the filamentary structure of the IRDC in the northern part of the field and the morphology of the dust pillar on which DR15 is located. The extinction contours are limited to a maximum level of =30 mag and further smoothed on the figure with a factor 3 boxcar, in order to remove some spurious features at the IRDC region. The resultant map shown in Figure 5 is in good agreement with a column density map constructed from 250 to 500 micron dust emission images from Herschel/SPIRE111Herschel is an ESA space observatory with science instruments provided by European-led Principal Investigator consortia and with important participation from NASA., which also allows a much larger dynamic range (up to 150 mag; Schneider et al., private comm.)
Clearly, the regions with higher column density values are those hosting a majority of the youngest stars. Using our extinction map we determined how the Class I sources are distributed in the highest density regions. Using contours of constant extinction in s.pdf of 1.0 mag, we counted the number of Class I sources above each level, and found that 23 out of 24 sources in our region of study lie above AV=13.0 mag, and 20 out of 24 sources lie above =15.0 mag. The fraction of the total of Class I sources, , decreases steeply after that, with only 50 percent of the total number of sources remaining at levels above =22.0 mag. It is also important to notice that given the filamentary morphology of the IRDC, the projected area of the map contained above each level decreases very steeply for mag. We also found that the surface density of Class I sources, , defined as the number of sources divided by the area above a given level, deviates little from a power-law behavior with a slope in the range mag. All of this is very consistent with a Schmidt type relation like it was found for a set of nearby Giant Molecular Clouds by Lada et al. (2013), except that in those clouds the linear regime appears to be set at a lower extinction interval. Unfortunately, our numbers are too small to attempt a Bayesian analysis like that of Lada et al. (2013), and possibly a comparison with other regions containing IRDCs would be more fair. However, the fact that we find a possible Schmidt-like behavior in a region like Cygnus-X DR15 is very interesting and worth of a dedicated comparative analysis with similar regions, which is beyond the scope of this paper.
3.3 Properties of the youngest stars in the DR15 region
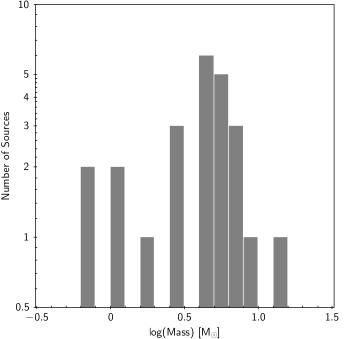
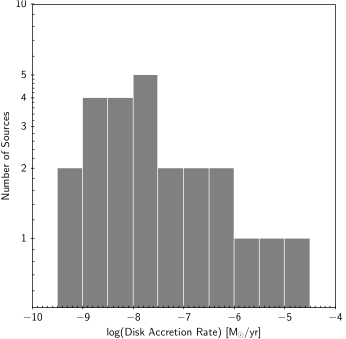
Using our master infrared catalogs we were able to construct spectral energy distrubutions (SED) for 24 of the Class 0/I sources we identified using the methods previously described. In most cases these sources belong to the cluster population associated with the dark infrared cloud in the northern section of our region of study. In a few cases we were able to complement these SEDs with Herschel Space Telescope PACS mid/far infrared photometry from the catalog of Ragan et al. (2012) and 850 m photometry from the catalog of Di Francesco et al. (2008). Using the SED fitting tool of Robitaille et al. (2007), we estimated some basic properties for the sources. In Figure 6 we show histograms of star masses and the disk accretion rates. The mass distribution suggests that the sources we are able to detect in DR15 are mostly intermediate to massive (mostly solar type and above). The accretion rates are in good agreement with estimates of typical accretion disk for sources with masses above solar (Fang et al., 2013).
3.4 The Star Formation History of DR15
3.4.1 Identification of the main stellar groups in DR15
To further investigate the stellar formation history in the DR15 region we attempted to identify the individual stellar clusters present in our field of study. Two clusters are easy to identify, namely the cluster at the center of the field and the cluster embedded in the IRDC at the north. However, the map of Figure 5 shows a good number of sources located around the molecular gas filaments, which may or may not be part of previously formed stellar clusters or groups.
In order to identify significant overdensities of stars in the DR15 region, we constructed surface density maps using the Gather algorithm of Gladwin et al. (1999). This algorithm is based in turn on the nearest neighbor method, which assigns individual surface density values to points on a two-dimensional map based on the equivalent circular area defined by the distance to a th. neighbor point (see Casertano & Hut (1985) for a description of this method in the particular case of stellar cluster identification; some examples of its use for embedded clusters can be found in Román-Zúñiga et al. (2008); Gutermuth et al. (2009) and Román-Zúñiga et al. (2015)). The gather algorithm is adequate for identifying individual clusters in a relatively simple layout, optimizing the value of that defines the surface density measurement and the size of the smoothing kernel used to construct the surface density map.
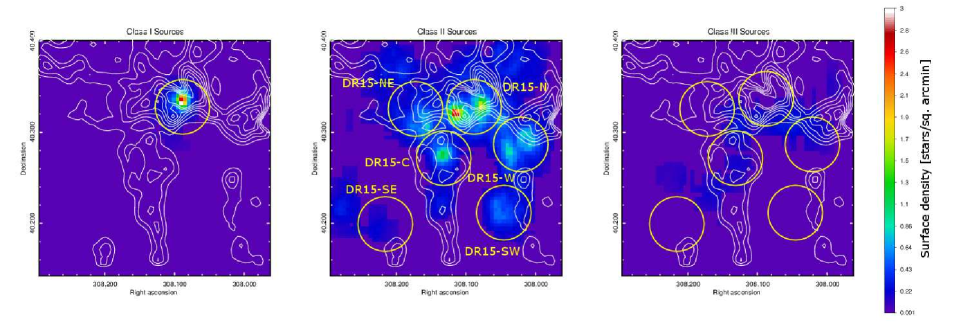
We made individual gather maps for each of the candidate YSO class lists. These maps are shown in Figure 7. The maps show the concentration of Class I sources at the north IRDC region. Class II sources are distributed over the entire region of study, but still concentrate in a few clearly defined groups. This led us to define some populations of stars, which we use as samples for our analysis. We named the two known clusters as DR15-C and DR15-N because their location center and north of our region of study. We identified and named as well three other groups: DR15-W, DR15-SW and DR15-SE. The purpose of this selection is to compare the age and age spread of these populations with the age of DR15-C.
3.4.2 YSO population ages from the K-band Luminosity Function
One of the goals of this study is to reconstruct the history of star formation in the region, by estimating the mean age and age spread of a set of the clusters and groups we identified from the gather maps. For this purpose, we constructed the K-band luminosity functions (KLF) of the groups and clusters, and compared them to the KLF of artificial pre-main sequence populations with different age ranges and age spreads. These artificial KLFs were constructed using the pre-main sequence model interpolation code of Muench et al. (2000). Another example of this method applied to a young cluster population can be found in Román-Zúñiga et al. (2015)
We selected the samples for DR15-C,DR15-W, DR15-SW and DR15-SE for this analysis. The samples were defined as circular areas that covered the four overdensities. The radii of the circles was chosen as 0.03 deg for DR15-W,SW and SE, and as 0.0225 for DR15-C. The KLF was constructed by limiting the samples by extinction in the following manner: we restricted the sample to those sources that a) fall above an extinction vector corresponding =20 mag that reaches the sensitivity limit in a vs. color-magnitude diagram, and b) fall between an unreddened and unreddened 3 Myr pre-main sequence isochrone, properly shifted to the estimated distance to DR15. The extinction-limited samples assure a minimum contamination from extragalactic sources (which mostly will fall in the area below the extinction vector and the sensitivity limit) and will minimize a bias due to the decrease in the number of detected sources as a function of extinction.
In their study, Muench et al. (2000) showed that the observed shape of the KLF (mostly defined by the peak value) of a pre-main sequence population is particularly sensitive to three intrinsic parameters: the underlying Initial Mass Function (IMF), the mean age of the population, and to a lesser extent, the age spread or period of formation. Our analysis consists of constructing a grid of artificial KLF for each of our samples, and compare them with our observed function. We constructed this grid by assuming a fixed IMF and let the time parameters, mean age and age spread, to run free.
For each population (DR15-C,DR15-W, DR15-SW and DR15-SE) we the used code of Muench et al. to simulate artificial KLFs for clusters with the same number of sources and the same distributions for extinction and disk fractions as a function of color (). We drew the artificial population from a broken power law IMF using the parameters of the one obtained for the IC 348 cluster (2 Myr old) in the paper of Muench et al. (2003). To draw the artificial populations we used the pre-main sequence stellar evolution model by D’Antona & Mazzitelli (1997), with to draw the samples for the artificial clusters . We ran the models using a grid of ages in which we varied the mean age of the cluster between 0.5 and 10 Myr, in s.pdf of 0.5 Myr. For each case, we simulated five age spreads between 1.0 to 5.0 Myr. For each case we simulated 500 clusters.
The method could not be applied succesfully for the DR15-N sample, due to the large extinction variations in that cluster, which does not allow us to obtain a sufficient detection rate in the K band at the highest column density regions. In the remaining clusters, we were able to isolate extinction limited samples satisfactorily.
We determined which age/age spread set fits each of the observed KLFs by averaging the KLF over all simulations for each point in the grid and comparing to the observed KLF, obtaining for each case a reduced estimation. In Figures 8 and 9 we show, for each cluster a contour plot of the reduced in a mean age vs age spread plane, indicating the parameter region with the best adjustments.
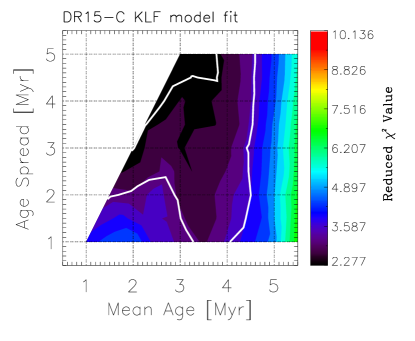
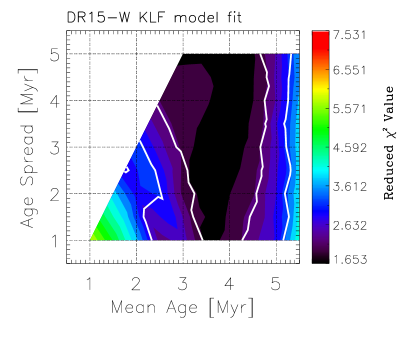
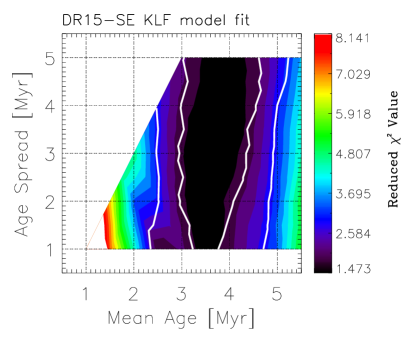
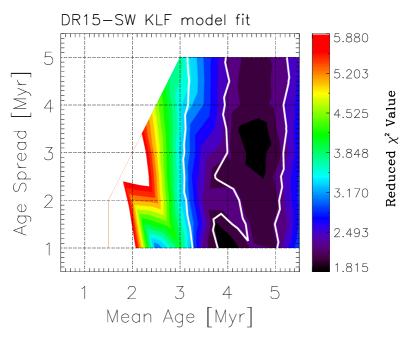
In Table 1 we list the results of the artificial KLF modeling analysis for the cluster samples in DR15. For each cluster we also include the number of Class I, Class II and Class III YSOs found in each population. The more embedded clusters DR15-C and DR15-W contain a population that according to our analysis, could have a mean age of 3.0 Myr. The populations flanking the main molecular pillar, DR15-SE and DR15-SW, appear to have mean ages as large as 3.5 and 4.5 Myr, respectively. The contour plots for these two samples, however, appear to have two local minima, suggesting age spreads as short as 3.0-3.5 Myr or as large as 4.5-5.0 Myr. The adjustment to an older age is in agreement with the less embedded status of these two samples. Notice that the confidence ranges in all cases indicate that our method cannot really constrain the age spreads satisfactorily (the 95 percent confidence range in DR15-C is the only one that suggest a constraint towards an age spread of 3.5 to 5 Myr). Still, given the embedded nature of these young star populations, we think it is little plausible that age spreads can be significantly larger than 5 Myr.
| Cluster | Mean Ageaa The number pairs inside the brackets indicate the range of model ages within the 2-sigma (68%) confidence level. The number listed before the bracket is the central value, which we list as the best estimate for the age/age spread of the cluster | Age Spreadaa The number pairs inside the brackets indicate the range of model ages within the 2-sigma (68%) confidence level. The number listed before the bracket is the central value, which we list as the best estimate for the age/age spread of the cluster | No. CIbbEstimated as number of sources of indicated class falling within the circle used for the KLF sample analysis | No. CIIbbEstimated as number of sources of indicated class falling within the circle used for the KLF sample analysis | No. CIIIbbEstimated as number of sources of indicated class falling within the circle used for the KLF sample analysis |
|---|---|---|---|---|---|
| [Myr] | |||||
| DR15-C | 3.0[2.5,3.5] | 4.5[3.5,5.0] | 1 | 8 | 4 |
| DR15-W | 3.5[2.5,4.5] | 4.5[1.0,5.0] | 2 | 16 | 5 |
| DR15-SE | 3.5[3.0,4.5] | 3.0[1.0,5.0] | 0 | 5 | 0 |
| DR15-SW | 4.5[4.0,5.0] | 3.0[1.0,5.0] | 0 | 11 | 2 |
| DR15-N | – | – | 15 | 21 | 6 |
| DR15-NE | – | – | 0 | 11 | 3 |
3.5 The slow removal of the DR15-C cluster molecular envelope
At 3 Myr of age, we could expect that the DR15-C cluster have removed a significant fraction of its molecular envelope, as it occurs in clusters of a similar age, e.g. IC-348 (Muench et al., 2003), IC 1795 (e.g. Oey et al., 2005, Román-Zúñiga et al 2015, in rev.). In fact our images show how other groups adjacent to DR15-C, like DR15-SE and DR15-SW, which our analysis suggests have similar ages, are associated with much less prominent molecular cloud features. Still, the molecular envelope of DR15-C appears as a well defined structure, both dense and compact, surrounding the cluster atop a dense molecular pillar.
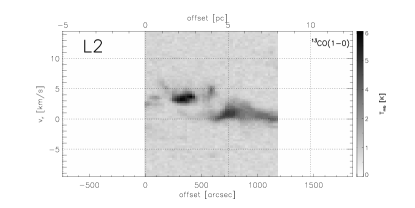
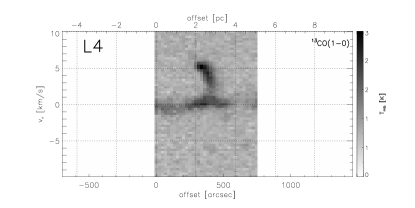
Using the 13CO(1-0) map of Schneider et al. (2011) we made two position-velocity (PV) cuts across the envelope of DR15-C. We used our extinction map and a zero moment (integrated intensity) integration of the 13CO(1-0) map as a guide. The first cut (L2) runs across the observable structure of the pillar in the region observed. The second cut (L4) runs almost perpendicular to L2. The L2 cut shows a component related to the neck of the pillar, almost 2 pc long with a radial velocity about 4 km/s away from the Cygnus OB2 system velocity (0 km/s). Near the center of the cut, coincidental with the envelope of DR15-C, the PV plot shows a hint of an elliptical shell structure, with a red component moving slightly above 4 km/s and a blue component near 0 km/s. The latter merges into the dark infrared cloud, which shows a very smooth gradient from 2 to 0 km/s. The L4 cut shows for the most part, gas with velocities near 0 km/s but also a much more clear elliptical shell structure at the envelope, which opens from 0 to 5 km/s. The elliptical shell structure corresponds to the expanding envelope of DR15-C.
We defined the area of the shell as a rectangle of 5.253.75 around the defined center of DR15C. Following the prescription by Estaella & Anglada (1999), we estimated the column density, N(H2) and the total mass of expanding gas within km/s, as 103.5 M⊙. Then we used the method described by (Qiu et al., 2009) to estimate the dynamical time of the component, yr. This implies a total mass loss rate of . At this rate, it would take about 3 Myr to remove the total mass of gas in the shell, which we estimate to be 1023 M⊙, using our extinction map, and a distance to the pillar of 1.4 kpc.
This result appears to be consistent with estimates of the mass loss rates in other molecular pillars. For instance, using integral field unit spectroscopy, Westmoquette et al. (2013) estimated a mass loss rate of 300 for the pillars of NGC 3603, which contain a total of about 700 M⊙ of gas. For the “Pillars of creation” in M16, an estimate by Mc Leod et al. (2015) is of 70 . In both cases, the removal timescales are of the order of 2-3 Myr. However, we need to point out that those estimates are based on models of photoevaporation, while our estimate comes from an estimation of a gas outflow rate from a zero moment map of molecular gas emission. The shell mass could be overestimated, due mainly to a large column density in the line of sight towards Cygnus-X, in which case we would be more consistent with the optical spectroscopy studies. However, what we consider important to note is that the removal of the envelope of DR15-C is relatively slow compared to other embedded cluster regions, where gas dispersal timescales are similar or shorter than the T Tauri timescale, i.e. less than 2 Myr .
4 Discussion
The main goal of this paper is to reconstruct the history of star formation in the Cygnus-X DR15 region. For this purpose, we made a) an analysis of the spatial distribution of YSO candidate sources classified by evolutionary classes, and b) a comparison of the observed KLF of several young star population samples in our region of study with those of artificial cluster samples drawn from pre-main sequence stellar evolution models.
The classification of YSO candidates and their spatial distribution reveals that several populations of young stars are present in the field of study. At the north/northeast part of our field we identified a very young cluster, DR15-N, hosting 15 Class 0/I sources. The cluster is forming within an infrared dark cloud that runs in the east-west direction at an estimated distance of 1400 pc (Rizzo et al., 2014; Palau et al., 2014). The cluster also contains a relatively large number (21) of Class II sources and thus it may host the youngest population in the region of study. For this cluster we were not able to construct an unbiased extinction-limited sample to construct a KLF. Instead, we constructed SEDs for all the Class I sources we identified within it, and we compared them to YSO models. We found that in most cases, the models with the best fits correspond to intermediate to high mass YSOs with ages of Myr. The mass of the IRDC, estimated from our NICEST extinction map is of , with an equivalent radii of 5.2 pc. These parameters are in good agreement with massive star forming IRDCs as defined by the analysis of Kauffmann & Pillai (2010).
The revised distance to Cygnus-X from the study of Rygl et al. (2012) is 1.4 kpc, in agreement with the estimations of Rizzo et al. (2014) and Palau et al. (2014). From our position-velocity cuts, we note that the emission along the structure of the dark infrared cloud has a null relative velocity compared to the Cygnus-X systemic velocity, same as the DR12-15 structure. It would be difficult to determine if the dark infrared cloud is located at the same distance than the DR15 pillar based only on a radial velocity difference argument. Also, it is important to notice that Rygl et al. could not confirm that Cygnus-X South structures are at the same distance as those in Cygnus-X North where most of their measurements were made. We also lack enough evidence to claim interaction between the DR15 pillar and the IRDC. Using purely morphological arguments we like to comment that the formation of molecular pillars like DR15 is thought to be the result of the interaction between the molecular cloud and the photoionization region formed by the ionizing radiation of the central cluster (Cygnus OB2 in our case), while the IRDC appears to be a highly dense and coherent structure, apparently less affected by the HII regions. Also, our images do not show any obvious pillar structures coincident with the IRDC. These arguments could work in favor of a scenario in which the IRDC could be located at a slightly different distance than the DR15 pillar.
According to our observations and our KLF simulation results, DR15-C is a young cluster with an age of about Myrs, but it has a low number of young sources, with only one identified Class I, 8 Class II and 4 Class III sources, all of this despite the presence of the thick, nebulous envelope evident in extinction and 13CO(1-0) integrated intensity maps. We know the DR15 pillar hosts an embedded cluster, as evidenced by well known far-infrared sources associated with the photodissociation region (Odenwald et al., 1990) and also from our KLF analysis, which indicates that 200 sources could be present within DR15-C, after background and foreground contamination corrections. We do not think the contamination by sources from the DR15-N cluster is too high, as most the density peak of that cluster is located to the northeast and it is more embedded. However, it cannot be fully discarded that some sources in DR15-C are actually sources from DR15-N (and viceversa). Also, there seems to be another YSO group in the filament, south of DR15-C, which reinforces the idea of star formation being active in the pillar.
Our evidence points to a scenario in which a) the star formation episode in DR15-C has probably reached its end or it is near its end and b) the parental gas has dissipated relatively slow, or at least slower that the dispersion time of circumstellar disks of its member stars. Our analysis of the 13CO(1-0) zero moment map indicates it would take up to 4 Myr to remove the cluster gaseous envelope. However, our observations in other cluster forming regions like the Rosette Molecular Cloud and W3 (e.g. Román-Zúñiga et al., 2008; Ybarra et al., 2013; Román-Zúñiga et al., 2015) suggest that clusters hosting intermediate to massive stars may remove their gas envelopes in periods shorter than the T Tauri timescale. Therefore, our analysis of DR15-C suggests that clusters forming in this kind of pillar structures, could dissipate their envelopes at slower rates.
As shown in recent studies like those of Westmoquette et al. (2013) and Mc Leod et al. (2015) the mass loss rates in pillars due to photoevaporation are of the order of , not too different from our estimations in the expanding gas shell. Clearly, we are comparing very different methods, that refer to very different processes (shell expansion vs. shell photo-erosion). It is important to notice that the DR15 pillar may not be the same kind of dusty pillar as those in M16, because extinction is too high to allow delineating the structure in DR15 using optical images. The molecular fragment located west of DR15 shows as a shadow with a pillar morphology in optical images, which make us think that DR15 could be a pillar too. Even so, the fact that the mass loss estimates for DR15 coincide in the order of magnitude of the effect with respect to M16 is interesting, and motivates further investigation. A detailed study of the removal of the DR15-C envelope is out of the scope of this paper, but it is the main topic in a close following study (Román-Zúñiga et al., in prep).
DR15-W, DR15-SE and DR15-SW appear to be slightly older populations ( Myrs) with much less gas and dust observed. However, we find evidence of remains of a structure that could have been similar to the pillar associated with DR15-C. It may be possible that the DR15-SE and DR15-SW groups belong to clusters formed before DR15-C, but their ages may not be much older, as evident from the presence of Class II and Class III sources. The estimated ages of the DR15-SW and SE samples suggest that the cluster evolution period, from formation to gas dispersal in the region could be around 5 Myr.
5 Summary
The Cygnus-X DR15 region presents a prominent gaseous pillar as well as an IRDC, both hosting clusters of young stars. In this investigation, we made a multi-wavelength study of the young stellar population in the region. For this purpose, we processed and analyzed deep, high quality near-IR images of the region, as well as X-ray images from the Chandra Observatory. Using these datasets we obtained photometry catalogs for all point sources we were able to detect. We combined these catalogs with the 3.6 to 24 m photometry catalog of the Cygnus-X Spitzer Legacy Survey, resulting in a master catalog containing almost 47 thousand individual sources. From our master catalog, we identified 226 young stellar sources, which we classified according to their evolutionary class related to the prominence of their circumstellar disks. We found that the young sources distribute into 26 Class 0/I, 156 Class II and 45 Class III sources.
From our near-IR we constructed an extinction map, which we used to study the spatial distribution of the young sources in the molecular cloud structure present in the region. We found that the youngest population of this region is currently forming at the IRDC, at the regions of highest column density. Combining this with maps of YSO surface density, we were able to identify several groups, possibly associated to distinct stellar clusters. We obtained extinction-limited samples of these groups in order to construct their K band luminosity functions (KLF). We compared the observed KLFs with those of artificial young cluster populations sampled from interpolation of pre-main sequence models. This allowed us to make first order estimations of the mean ages and age spreads of the cluster population samples.
We constructed SEDs for all Class I sources identified within the IRDC region, which allowed us to estimate their mass and disk accretion rates. These estimations are consistent with the formation of an intermediate mass star cluster, indicating that structures of this kind in Cygnus-X are possibly birth places of massive clusters.
Using the FCRAO 13CO(1-0) from the study of Schneider et al. (2011) we estimated the radial velocity distribution along the IRDC and the DR15 pillar, and we found that the nebulous envelope of the DR15-C cluster at the tip of the pillar is consistent with an expanding shell morphology. We estimated the mass loss rate of gas in this expanding shell and we deduced that the dissipation process of the DR15-C cluster gas envelope is relatively slow, compared to what we found in other studies of cluster forming regions, where the gas dispersal process is shorter than the T Tauri timescale. The mass loss rate we estimated is in the same order of magnitude as mass loss rates by photodissociation found in studies of other gas pillars using optical spectroscopy. This suggests that clusters forming in gas pillars like DR15-C could have a different evolution process than clusters forming at dense clumps in other giant molecular clouds.
The presence of other populations containing Class II and Class III sources at the regions flanking the DR15 pillar, and projected near less dense but still noticeable gaseous structures, with estimated ages of 4 to 5 Myr is suggestive of a process of cluster forming processes that take about that long to form an dissipate in the molecular cloud complex that surrounds the Cygnus-X HII region.
References
- Bertin & Arnouts (1996) Bertin, E. & Arnouts, S. 1996, A&AS, 117, 393
- Broos et al. (2010) Broos, P. S., Townsley, L. K., Feigelson, E. D., et al. 2010, ApJ, 714, 1582
- Campbell et al. (1982) Campbell, M. F., Niles, D., Nawfel, R., et al. 1982, ApJ, 261, 550
- Casertano & Hut (1985) Casertano, S. & Hut, P. 1985, ApJ, 298, 80
- D’Antona & Mazzitelli (1997) D’Antona, F. & Mazzitelli, I. 1997, Mem. Soc. Astron. Italiana, 68
- Di Francesco et al. (2008) Di Francesco, J., Johnstone, D., Kirk, H., MacKenzie, T., & Ledwosinska, E. 2008, ApJS, 175, 277
- Dotter et al. (2008) Dotter, A., Chaboyer, B., Jevremović, D., et al. 2008, ApJS, 178, 89
- Dutra & Bica (2001) Dutra, C. M., & Bica, E. 2001, A&A, 376, 434
- Estaella & Anglada (1999) Estalella, R. & G. Anglada. Introducción a la Física del Medio Interestelar. Number 50 in Textos Docents. Barcelona: Edicions Universitat de Barcelona, 1999.
- Fang et al. (2013) Fang, K., et al. 2013, ApJS, 207, 5
- Fruscione et al. (2006) Fruscione, A., et al. 2006, Proc. SPIE, 6270
- Gladwin et al. (1999) Gladwin, P. P., Kitsionas, S., Boffin, H. M. J., & Whitworth, A. P. 1999, MNRAS, 302, 305
- Gutermuth et al. (2008) Gutermuth, R. A., Myers, P. C., Megeath, S. T. et al. 2008, ApJ, 674, 336
- Gutermuth et al. (2009) Gutermuth, R. A., Megeath, S. T., Myers, P. C., et al. 2009, ApJS, 184, 18
- Hora et al. (2009) Hora, J., Gutermuth, R., Carey, S. et al. 2009, in Reionization to Exoplanets: Spitzer’s Growing Legacy, Ed. Ogle, P., ASP Conf. Ser., pp. 26-28
- Jiménez-Esteban et al. (2010) Jiménez-Esteban, F. M., Rizzo, J. R., & Palau, A. 2010, ApJ, 713, 429
- Kauffmann & Pillai (2010) Kauffmann, J., & Pillai, T. 2010, ApJ, 723, L7
- Kleinmann et al. (1979) Kleinmann, S. G., Sargent, D. G., Telesco, C. M., Joyce, R. R., & Gillett, F. C. 1979, ApJ, 227, 126
- Knödlseder (2000) Knödlseder, J. 2000, A&A, 360, 539
- Kryukova et al. (2012) Kryukova, E., Megeath, S.T., Gutermuth, R.A., et al. 2012, AJ, 144, 31
- Kryukova et al. (2014) Kryukova, E., Megeath, S.T., Hora, J.L., et al. 2014, AJ, 148, 11
- Kurtz et al. (1994) Kurtz, S., Churchwell, E., & Wood, D. O. S. 1994, ApJS, 91, 659
- Lada et al. (2013) Lada, C. J., Lombardi, M., Roman-Zuniga, C., Forbrich, J., & Alves, J. F. 2013, ApJ, 778, 133
- Lombardi & Alves (2001) Lombardi, M. & Alves, J. 2001, A&A, 377, 1023
- Mc Leod et al. (2015) Mc Leod, A. F., Dale, J. E., Ginsburg, A., et al. 2015, MNRASin press, arXiv:1504.03323
- Meyer et al. (1997) Meyer, M. R., Calvet, N., & Hillenbrand, L. A. 1997, AJ, 114, 288
- Muench et al. (2000) Muench, A. A., Lada, E. A., & Lada, C. J. 2000, ApJ, 533, 358
- Muench et al. (2003) Muench, A. A., Lada, E. A., Lada, C. J. et al. 2003, AJ, 125, 2029
- Odenwald et al. (1990) Odenwald, S. F., Campbell, M. F., Shivanandan, K., et al. 1990, AJ, 99, 288
- Oey et al. (2005) Oey, M. S., Watson, A. M., Kern, K., & Walth, G. L. 2005, AJ, 129, 393
- Oka et al. (2001) Oka, T., Yamamoto, S., Iwata, M., et al. 2001, ApJ, 558, 176
- Palau et al. (2014) Palau, A., Rizzo, J. R., Girart, J. M., & Henkel, C. 2014, ApJ, 784, LL21
- Piddington & Minnett (1952) Piddington, J. H., & Minnett, H. C. 1952, Australian Journal of Scientific Research A Physical Sciences, 5, 17
- Qiu et al. (2009) Qiu, K., Zhang, Q., Wu, J. & Chen, H.-R. 2009, ApJ, 696, 66
- Ragan et al. (2012) Ragan, S., Henning, T., Krause, O., et al. 2012, A&A, 547, AA49
- Reipurth & Schneider (2008) Reipurth, B., & Schneider, N. 2008, Handbook of Star Forming Regions, Volume I, 36
- Rieke et al. (1985) Rieke, G. H., Lebofsky, M. J., & Low, F. J. 1985, AJ, 90, 900
- Rizzo et al. (2008) Rizzo, J. R., Jiménez-Esteban, F. M., & Ortiz, E. 2008, ApJ, 681, 355
- Rizzo et al. (2014) Rizzo, J. R., Palau, A., Jiménez-Esteban, F., & Henkel, C. 2014, A&A, 564, AA2
- Robitaille et al. (2007) Robitaille, T. P., Whitney, B. A., Indebetouw, R., & Wood, K. 2007, ApJS, 169, 328
- Román-Zúñiga et al. (2008) Román-Zúñiga, C. G., Elston, R., Ferreira, B., & Lada, E. A. 2008, ApJ, 672, 861
- Román-Zúñiga et al. (2010) Román-Zúñiga, C. G., Alves, J. F., Lada, C. J., & Lombardi, M. 2010, ApJ, 725, 2232
- Román-Zúñiga et al. (2015) Román-Zúñiga, C. G., Ybarra, J. E., Megías, G. D., et al. 2015, AJ, 150, 80
- Rygl et al. (2012) Rygl, K. L. J., Brunthaler, A., Sanna, A., et al. 2012, A&A, 539, A79
- Sault et al. (1995) Sault, R. J., Teuben, P. J., & Wright, M. C. H. 1995, Astronomical Data Analysis Software and Systems IV, 77, 433
- Schneider et al. (2006) Schneider, N., Bontemps, S., Simon, R., et al. 2006, A&A, 458, 855
- Schneider et al. (2011) Schneider, N., Bontemps, S., Simon, R., et al. 2011, A&A, 529, AA1
- Taylor (2005) Taylor, M. B. 2005, in Astronomical Society of the Pacific Conference Series, Vol. 347, Astronomical Data Analysis Software and Systems XIV, ed. P. Shopbell, M. Britton, & R. Ebert, 29
- Teixeira et al. (2012) Teixeira, P. S., Lada, C. J., Marengo, M., & Lada, E. A. 2012, A&A, 540, AA83
- Westmoquette et al. (2013) Westmoquette, M. S., Dale, J. E., Ercolano, B., & Smith, L. J. 2013, MNRAS, 435, 30
- Ybarra et al. (2013) Ybarra, J. E., Lada, E. A., Roman-Zúñiga, C. G. et al. 2013, ApJ, 769, 140
Appendix A Young Sources Identified in the DR15 region
In Tables 2, 3 and 4 we list YSO sources identified as Class I, Class II and Class III in our region of study. The tables contain JHK photometry from Calar Alto (or 2MASS when pertinent, see section 2.1), 3.6 to 24 m photometry from the Spitzer CXLS, and when possible, median energy and total energy flux values for those sources detected with Chandra ACIS (that is the case for all Class III sources). Identifications and positions from our Calar Alto survey are listed for most cases. The remaining sources are listed with 2MASS or CXLS depending if they were detected in those surveys.
| Source | RA | DEC | J | H | K | [3.6] | [4.5] | [5.8] | [8.0] | [24 m] | Median Energy | Energy Flux | ||||||||
|---|---|---|---|---|---|---|---|---|---|---|---|---|---|---|---|---|---|---|---|---|
| [J2000] | [mag] | [keV] | [erg/cm2/s] | |||||||||||||||||
| CAHA_20322208_402017 | 20:32:22.08 | +40:20:17.2 | 18.827 | 9.999 | 18.101 | 0.02 | 12.026 | 0.02 | 7.411 | 0.015 | 6.021 | 0.015 | 5.066 | 0.015 | 4.136 | 0.015 | 0.395 | 0.018 | — | — |
| CAHA_20322856_401941 | 20:32:28.56 | +40:19:41.6 | 14.827 | 0.003 | 11.397 | 0.019 | 8.943 | 0.016 | 7.372 | 0.015 | 6.304 | 0.015 | 5.349 | 0.015 | 4.427 | 0.015 | 0.981 | 0.017 | — | — |
| CAHA_20321777_401408 | 20:32:17.77 | +40:14:08.2 | 15.139 | 0.015 | 12.744 | 0.014 | 10.647 | 0.014 | 8.162 | 0.015 | 7.323 | 0.015 | 6.455 | 0.015 | 4.864 | 0.015 | 1.412 | 0.016 | — | — |
| SSTCYGX_J203222.99_402021.4 | 20:32:22.99 | +40:20:21.4 | — | — | — | — | — | — | 13.706 | 0.17 | 11.445 | 0.106 | 9.627 | 0.041 | 7.858 | 0.033 | 1.662 | 0.019 | — | — |
| CAHA_20322060_401950 | 20:32:20.60 | +40:19:50.1 | — | — | — | — | 16.815 | 0.02 | 10.233 | 0.021 | 8.048 | 0.016 | 6.613 | 0.015 | 5.777 | 0.017 | 2.145 | 0.038 | — | — |
| CAHA_20323152_401352 | 20:32:31.52 | +40:13:53.0 | 20.457 | 0.042 | 14.909 | 0.008 | 14.374 | 0.089 | 8.519 | 0.016 | 7.417 | 0.015 | 6.565 | 0.017 | 5.96 | 0.03 | 2.229 | 0.111 | — | — |
| CAHA_20322113_402025 | 20:32:21.13 | +40:20:25.6 | 17.814 | 9.999 | 16.994 | 0.013 | 13.068 | 0.009 | 9.281 | 0.016 | 8.148 | 0.016 | 7.201 | 0.016 | 6.35 | 0.017 | 2.316 | 0.021 | 2.694 | 5.880E-15 |
| CAHA_20322194_401937 | 20:32:21.94 | +40:19:37.9 | — | — | 20.053 | 0.075 | 15.564 | 0.017 | 11.613 | 0.021 | 10.495 | 0.02 | 7.246 | 0.016 | 5.487 | 0.021 | 2.668 | 0.056 | — | — |
| CAHA_20322126_401601 | 20:32:21.26 | +40:16:01.8 | 18.458 | 0.023 | 14.213 | 0.007 | 11.565 | 0.018 | 8.827 | 0.015 | 7.851 | 0.015 | 7.005 | 0.015 | 6.26 | 0.017 | 3.036 | 0.18 | — | — |
| CAHA_20320254_401838 | 20:32:02.54 | +40:18:39.0 | — | — | — | — | 17.492 | 0.073 | 11.914 | 0.017 | 10.031 | 0.016 | 8.879 | 0.017 | 8.241 | 0.033 | 3.077 | 0.046 | — | — |
| CAHA_20322282_401940 | 20:32:22.82 | +40:19:40.9 | — | — | — | — | 16.245 | 0.038 | 12.171 | 0.03 | 10.362 | 0.019 | 9.161 | 0.021 | 8.26 | 0.059 | 3.583 | 0.118 | — | — |
| CAHA_20315797_401835 | 20:31:57.97 | +40:18:35.8 | 21.759 | 0.22 | — | — | — | — | 13.975 | 0.028 | 12.189 | 0.027 | 11.35 | 0.036 | 10.973 | 0.112 | 3.677 | 0.035 | — | — |
| SSTCYGX_J203153.84_401833.9 | 20:31:53.84 | +40:18:33.9 | — | — | — | — | — | — | 13.039 | 0.018 | 11.039 | 0.016 | 9.802 | 0.019 | 8.87 | 0.028 | 5.383 | 0.092 | — | — |
| CAHA_20322222_401955 | 20:32:22.22 | +40:19:56.0 | 18.432 | 9.999 | 16.975 | 0.008 | 13.395 | 0.005 | 10.72 | 0.016 | 9.534 | 0.016 | 8.519 | 0.018 | 7.538 | 0.025 | — | — | — | — |
| CAHA_20322014_401953 | 20:32:20.14 | +40:19:53.6 | 17.771 | 9.999 | 17.345 | 9.999 | 14.847 | 0.006 | 9.945 | 0.016 | 8.612 | 0.016 | 7.726 | 0.017 | 7.577 | 0.026 | — | — | — | — |
| CAHA_20322784_401942 | 20:32:27.84 | +40:19:42.4 | 19.796 | 0.037 | 15.484 | 0.007 | 12.902 | 0.005 | 10.559 | 0.017 | 9.733 | 0.018 | 8.976 | 0.021 | 8.266 | 0.062 | — | — | — | — |
| CAHA_20322033_402001 | 20:32:20.33 | +40:20:01.5 | 16.173 | 0.003 | 15.529 | 0.007 | 15.118 | 0.012 | 13.54 | 0.118 | 11.84 | 0.066 | 10.647 | 0.059 | 9.852 | 0.075 | — | — | — | — |
| CAHA_20322899_401821 | 20:32:28.99 | +40:18:21.2 | — | — | — | — | 16.45 | 0.03 | 14.072 | 0.062 | 13.326 | 0.036 | 12.328 | 0.117 | 11.479 | 0.24 | — | — | — | — |
| CAHA_20322111_402001 | 20:32:21.11 | +40:20:01.1 | — | — | — | — | 16.686 | 0.047 | 11.988 | 0.033 | 10.318 | 0.023 | 9.153 | 0.019 | 8.38 | 0.027 | — | — | — | — |
| CAHA_20322781_402032 | 20:32:27.81 | +40:20:32.7 | — | — | — | — | 18.385 | 0.1 | 14.168 | 0.022 | 12.909 | 0.018 | 12.075 | 0.042 | 11.14 | 0.069 | — | — | — | — |
| SSTCYGX_J203226.39_401847.4 | 20:32:26.39 | +40:18:47.4 | — | — | — | — | — | — | 14.761 | 0.051 | 13.612 | 0.028 | 12.252 | 0.112 | 11.323 | 0.185 | — | — | — | — |
| CAHA_20320404_401856 | 20:32:04.04 | +40:18:56.6 | 18.559 | 0.009 | 15.162 | 0.01 | 13.261 | 0.01 | 11.352 | 0.017 | 10.546 | 0.016 | 9.895 | 0.03 | 9.09 | 0.064 | 5.954 | 0.42 | 4.636 | 1.717E-14 |
| CAHA_20323480_401629 | 20:32:34.80 | +40:16:29.2 | 17.797 | 0.023 | 14.591 | 0.016 | 12.513 | 0.009 | 10.185 | 0.05 | 9.455 | 0.048 | 8.048 | 0.145 | — | — | — | — | 3.906 | 1.154E-14 |
| CAHA_20322210_401800 | 20:32:22.10 | +40:18:00.3 | 13.681 | 0.003 | 12.608 | 0.006 | 12.447 | 0.023 | 11.337 | 0.021 | 11.004 | 0.022 | 10.653 | 0.153 | 9.602 | 0.323 | — | — | 1.438 | 6.480E-15 |
| CAHA_20322358_401729 | 20:32:23.58 | +40:17:29.9 | 14.661 | 0.003 | 13.556 | 0.005 | 13.146 | 0.005 | 12.243 | 0.08 | 12.081 | 0.112 | 9.757 | 0.146 | — | — | — | — | 1.204 | 4.064E-15 |
| CAHA_20325161_401945 | 20:32:51.61 | +40:19:45.6 | 16.385 | 0.005 | 14.341 | 0.007 | 13.271 | 0.005 | 12.165 | 0.017 | 11.689 | 0.017 | 11.375 | 0.024 | 11.162 | 0.054 | — | — | 3.351 | 1.147E-14 |
| Source | RA | DEC | J | H | K | [3.6] | [4.5] | [5.8] | [8.0] | [24 m] | Median Energy | Energy Flux | ||||||||
|---|---|---|---|---|---|---|---|---|---|---|---|---|---|---|---|---|---|---|---|---|
| [J2000] | [mag] | [keV] | [erg/cm2/s] | |||||||||||||||||
| CAHA_20324212_401726 | 20:32:42.12 | +40:17:27.0 | 12.732 | 0.005 | 11.778 | 0.03 | 11.309 | 0.023 | 11.001 | 0.018 | 10.834 | 0.018 | 10.6 | 0.103 | 9.503 | 0.22 | 2.175 | 0.175 | — | — |
| TWOM_20322301_4019226 | 20:32:23.02 | +40:19:22.7 | 12.204 | 0.025 | 10.916 | 0.021 | 10.071 | 0.014 | 8.789 | 0.015 | 8.154 | 0.015 | 7.561 | 0.015 | 6.622 | 0.016 | 2.94 | 0.037 | — | — |
| CAHA_20323244_402105 | 20:32:32.44 | +40:21:05.1 | 13.473 | 0.003 | 11.578 | 0.018 | 10.661 | 0.017 | 10.131 | 0.015 | 9.936 | 0.015 | 9.751 | 0.016 | 9.249 | 0.024 | 3.358 | 0.043 | — | — |
| CAHA_20321111_401916 | 20:32:11.11 | +40:19:16.7 | 19.311 | 0.033 | 15.549 | 0.016 | 13.14 | 0.007 | 11.057 | 0.03 | 9.915 | 0.023 | 9.281 | 0.096 | 8.539 | 0.248 | 3.658 | 0.235 | — | — |
| CAHA_20321736_401949 | 20:32:17.36 | +40:19:49.5 | 19.194 | 0.02 | 15.036 | 0.006 | 12.555 | 0.004 | 10.287 | 0.017 | 9.536 | 0.016 | 8.877 | 0.063 | 8.238 | 0.205 | 3.748 | 0.159 | — | — |
| CAHA_20320319_402215 | 20:32:03.19 | +40:22:15.9 | 14.418 | 0.004 | 12.749 | 0.008 | 12.095 | 0.02 | 9.921 | 0.016 | 9.256 | 0.015 | 8.651 | 0.017 | 7.743 | 0.038 | 4.189 | 0.086 | — | — |
| CAHA_20324852_402104 | 20:32:48.52 | +40:21:04.8 | 13.849 | 0.003 | 12.805 | 0.005 | 12.1 | 0.021 | 10.642 | 0.015 | 9.731 | 0.015 | 9.054 | 0.016 | 8.221 | 0.021 | 4.79 | 0.046 | — | — |
| CAHA_20325574_402220 | 20:32:55.74 | +40:22:20.6 | — | — | 19.872 | 0.06 | 16.277 | 0.041 | 11.28 | 0.016 | 9.469 | 0.015 | 8.207 | 0.015 | 7.367 | 0.015 | 4.826 | 0.036 | — | — |
| CAHA_20315532_402216 | 20:31:55.32 | +40:22:16.8 | 14.671 | 0.003 | 13.231 | 0.008 | 12.382 | 0.006 | 11.501 | 0.016 | 11.015 | 0.016 | 10.594 | 0.019 | 9.544 | 0.026 | 4.841 | 0.196 | — | — |
| CAHA_20321148_401807 | 20:32:11.71 | +40:18:05.1 | 13.322 | 0.039 | 12.351 | 0.042 | 11.517 | 9.999 | 10.704 | 0.019 | 10.358 | 0.018 | 10.261 | 0.051 | 9.379 | 0.117 | 4.949 | 0.169 | — | — |
| CAHA_20320833_401604 | 20:32:08.33 | +40:16:04.7 | 13.914 | 0.004 | 12.784 | 0.005 | 12.356 | 0.023 | 11.52 | 0.019 | 11.226 | 0.017 | 10.55 | 0.061 | 9.419 | 0.111 | 5.031 | 0.162 | 1.774 | 1.365E-14 |
| CAHA_20321289_401257 | 20:32:12.89 | +40:12:58.0 | 14.167 | 0.011 | 12.895 | 0.021 | 12.215 | 0.02 | 11.591 | 0.016 | 11.367 | 0.016 | 11.211 | 0.04 | 10.694 | 0.089 | 5.4 | 0.076 | 2.069 | 9.625E-15 |
| CAHA_20324359_402121 | 20:32:43.59 | +40:21:21.3 | 14.853 | 0.003 | 12.584 | 0.007 | 11.295 | 0.017 | 9.688 | 0.015 | 9.134 | 0.015 | 8.61 | 0.015 | 7.939 | 0.016 | 5.42 | 0.07 | — | — |
| TWOM_20315270_4019059 | 20:31:52.71 | +40:19:06.0 | 17.14 | 0.217 | 14.15 | 0.042 | 12.799 | 0.029 | 12.079 | 0.019 | 11.8 | 0.026 | 11.499 | 0.045 | 10.641 | 0.084 | 5.502 | 0.245 | 2.373 | 9.074E-15 |
| CAHA_20315661_401614 | 20:31:56.61 | +40:16:14.0 | 12.979 | 0.005 | 12.093 | 0.019 | 11.357 | 0.016 | 10.733 | 0.016 | 10.412 | 0.016 | 10.187 | 0.034 | 9.427 | 0.073 | 5.586 | 0.221 | 1.511 | 1.315E-14 |
| CAHA_20320053_402026 | 20:32:00.53 | +40:20:27.0 | 15.688 | 0.003 | 13.881 | 0.005 | 12.739 | 0.005 | 11.66 | 0.017 | 10.921 | 0.016 | 10.346 | 0.027 | 9.495 | 0.049 | 5.696 | 0.133 | — | — |
| CAHA_20325540_402150 | 20:32:55.40 | +40:21:50.7 | 15.923 | 0.005 | 13.857 | 0.007 | 12.355 | 0.007 | 10.89 | 0.016 | 10.376 | 0.016 | 9.785 | 0.016 | 9.012 | 0.018 | 5.954 | 0.056 | — | — |
| CAHA_20330082_401800 | 20:33:00.82 | +40:18:00.2 | 13.978 | 0.007 | 12.929 | 0.012 | 12.615 | 0.026 | 11.539 | 0.016 | 11.08 | 0.016 | 10.769 | 0.018 | 9.75 | 0.022 | 6.142 | 0.09 | — | — |
| CAHA_20322395_402218 | 20:32:23.95 | +40:22:18.3 | 15.943 | 0.037 | 14.013 | 0.035 | 12.994 | 0.033 | 11.783 | 0.016 | 11.241 | 0.016 | 10.787 | 0.021 | 10.031 | 0.034 | 6.152 | 0.158 | — | — |
| CAHA_20321650_402141 | 20:32:16.50 | +40:21:41.1 | 18.196 | 0.012 | 15.382 | 0.016 | 13.564 | 0.021 | 12.04 | 0.017 | 11.356 | 0.016 | 10.867 | 0.029 | 10.155 | 0.057 | 6.186 | 0.177 | — | — |
| CAHA_20320880_402054 | 20:32:08.80 | +40:20:54.9 | 15.698 | 0.003 | 13.914 | 0.006 | 12.866 | 0.004 | 11.565 | 0.016 | 10.84 | 0.016 | 10.039 | 0.025 | 8.887 | 0.039 | 6.378 | 0.098 | — | — |
| CAHA_20324730_402217 | 20:32:47.30 | +40:22:17.9 | 14.143 | 0.004 | 13.131 | 0.006 | 12.514 | 0.006 | 11.697 | 0.016 | 11.226 | 0.016 | 10.764 | 0.019 | 10.016 | 0.021 | 6.462 | 0.123 | — | — |
| CAHA_20321184_401733 | 20:32:11.84 | +40:17:33.8 | 14.27 | 0.002 | 12.991 | 0.005 | 12.4 | 0.009 | 11.543 | 0.017 | 11.161 | 0.017 | 10.727 | 0.055 | 10.004 | 0.086 | 6.559 | 0.163 | — | — |
| CAHA_20325680_401223 | 20:32:56.80 | +40:12:23.3 | 15.594 | 0.015 | 13.946 | 0.017 | 12.806 | 0.017 | 11.997 | 0.016 | 11.55 | 0.016 | 11.297 | 0.021 | 10.649 | 0.029 | 6.835 | 0.132 | — | — |
| CAHA_20330112_401449 | 20:33:01.12 | +40:14:49.2 | 14.081 | 0.011 | 13.502 | 0.036 | 12.493 | 0.025 | 11.214 | 0.016 | 10.878 | 0.016 | 10.53 | 0.018 | 9.727 | 0.02 | 6.93 | 0.237 | — | — |
| CAHA_20330982_401154 | 20:33:09.82 | +40:11:54.6 | 14.388 | 0.01 | 13.128 | 0.012 | 12.538 | 0.024 | 11.265 | 0.016 | 10.82 | 0.016 | 10.411 | 0.017 | 9.723 | 0.017 | 6.99 | 0.199 | — | — |
| CAHA_20325220_402406 | 20:32:52.20 | +40:24:06.2 | 15.228 | 0.006 | 13.653 | 0.008 | 12.688 | 0.009 | 11.626 | 0.016 | 11.181 | 0.016 | 10.784 | 0.018 | 10.062 | 0.029 | 7.023 | 0.064 | — | — |
| CAHA_20324795_402214 | 20:32:47.95 | +40:22:14.2 | 18.103 | 0.007 | 15.928 | 0.007 | 14.661 | 0.007 | 13.505 | 0.038 | 12.873 | 0.032 | 12.302 | 0.053 | 11.42 | 0.07 | 7.027 | 0.246 | — | — |
| CAHA_20325444_401949 | 20:32:54.44 | +40:19:49.5 | 14.826 | 0.004 | 13.712 | 0.007 | 13.046 | 0.005 | 12.011 | 0.016 | 11.721 | 0.016 | 11.454 | 0.025 | 11.034 | 0.037 | 7.044 | 0.183 | — | — |
| CAHA_20320189_401007 | 20:32:01.89 | +40:10:07.8 | 16.296 | 0.009 | 14.641 | 0.011 | 13.655 | 0.049 | 12.911 | 0.02 | 12.625 | 0.02 | 12.386 | 0.049 | 11.962 | 0.109 | 7.045 | 0.217 | — | — |
| CAHA_20330546_401215 | 20:33:05.46 | +40:12:15.7 | 14.32 | 0.036 | 13.247 | 0.038 | 12.594 | 0.055 | 11.881 | 0.016 | 11.534 | 0.016 | 11.129 | 0.021 | 10.243 | 0.035 | 7.084 | 0.19 | 1.701 | 1.217E-14 |
| CAHA_20330798_401915 | 20:33:07.98 | +40:19:15.5 | 13.951 | 0.007 | 12.724 | 0.01 | 12.251 | 0.024 | 11.21 | 0.016 | 10.83 | 0.016 | 10.462 | 0.017 | 9.941 | 0.022 | 7.182 | 0.209 | — | — |
| CAHA_20321078_402356 | 20:32:10.78 | +40:23:56.0 | 16.728 | 0.005 | 14.42 | 0.011 | 12.906 | 0.005 | 11.646 | 0.016 | 10.951 | 0.016 | 10.453 | 0.017 | 9.679 | 0.019 | 7.496 | 0.154 | — | — |
| CAHA_20331260_402247 | 20:33:12.60 | +40:22:47.2 | 17.066 | 0.011 | 15.378 | 0.096 | 14.455 | 0.096 | 13.466 | 0.024 | 13.22 | 0.021 | 12.702 | 0.059 | 11.862 | 0.087 | 7.898 | 0.246 | — | — |
| CAHA_20321598_401023 | 20:32:15.98 | +40:10:23.5 | 14.683 | 0.013 | 13.6 | 0.014 | 12.856 | 0.033 | 12.218 | 0.016 | 11.902 | 0.016 | 11.536 | 0.023 | 11.097 | 0.04 | — | — | 1.467 | 1.295E-14 |
| CAHA_20323581_400914 | 20:32:35.81 | +40:09:14.3 | 16.045 | 9.999 | 14.927 | 0.018 | 13.921 | 0.023 | 13.471 | 0.021 | 13.326 | 0.022 | 12.951 | 0.121 | 12.124 | 0.243 | — | — | — | — |
| CAHA_20325027_401053 | 20:32:50.27 | +40:10:53.5 | 16.775 | 0.023 | 15.134 | 0.023 | 13.962 | 0.025 | 13.741 | 0.034 | 13.334 | 0.032 | 12.821 | 0.084 | 11.766 | 0.129 | — | — | — | — |
| CAHA_20320910_401441 | 20:32:09.10 | +40:14:41.7 | 15.85 | 0.006 | 13.621 | 0.006 | 12.556 | 0.021 | 11.916 | 0.019 | 11.779 | 0.018 | 11.381 | 0.052 | 10.657 | 0.113 | — | — | — | — |
| CAHA_20321210_401240 | 20:32:12.10 | +40:12:41.0 | 15.8 | 0.01 | 14.19 | 0.009 | 13.448 | 0.03 | 12.56 | 0.018 | 12.053 | 0.017 | 11.504 | 0.035 | 10.608 | 0.052 | — | — | — | — |
| CAHA_20320975_401131 | 20:32:09.75 | +40:11:31.3 | 17.666 | 0.01 | 15.457 | 0.011 | 14.374 | 0.035 | 13.816 | 0.027 | 13.654 | 0.033 | 13.254 | 0.131 | 12.599 | 0.17 | — | — | — | — |
| CAHA_20320721_401330 | 20:32:07.21 | +40:13:30.5 | 15.47 | 0.016 | 14.657 | 0.025 | 14.144 | 0.026 | 13.503 | 0.028 | 13.251 | 0.027 | 12.661 | 0.125 | 11.52 | 0.207 | — | — | — | — |
| CAHA_20320583_401139 | 20:32:05.83 | +40:11:39.8 | 17.571 | 0.012 | 15.648 | 0.011 | 14.458 | 0.035 | 13.53 | 0.022 | 13.079 | 0.02 | 12.704 | 0.065 | 12.004 | 0.105 | — | — | — | — |
| CAHA_20321307_401250 | 20:32:13.07 | +40:12:50.0 | 16.731 | 0.009 | 15.006 | 0.01 | 13.919 | 0.027 | 12.918 | 0.024 | 12.355 | 0.021 | 12.049 | 0.051 | 11.509 | 0.141 | — | — | — | — |
| CAHA_20321094_401157 | 20:32:10.94 | +40:11:57.3 | 14.802 | 0.01 | 13.906 | 0.009 | 13.395 | 0.03 | 13.259 | 0.022 | 13.186 | 0.025 | 12.688 | 0.096 | 11.88 | 0.237 | — | — | — | — |
| CAHA_20321434_401357 | 20:32:14.34 | +40:13:57.8 | 16.7 | 0.152 | 14.895 | 0.062 | 14.25 | 0.024 | 12.878 | 0.017 | 12.516 | 0.019 | 12.323 | 0.056 | 11.361 | 0.082 | — | — | — | — |
| CAHA_20320296_401350 | 20:32:02.96 | +40:13:50.9 | 17.226 | 0.009 | 14.281 | 0.007 | 12.922 | 0.024 | 12.062 | 0.018 | 11.914 | 0.019 | 11.574 | 0.078 | 10.965 | 0.228 | — | — | — | — |
| CAHA_20320488_401316 | 20:32:04.88 | +40:13:16.0 | 16.034 | 0.007 | 14.24 | 0.007 | 13.273 | 0.026 | 12.802 | 0.022 | 12.554 | 0.022 | 11.825 | 0.082 | 10.472 | 0.128 | — | — | — | — |
| CAHA_20320511_401231 | 20:32:05.11 | +40:12:31.7 | 19.14 | 0.027 | 15.766 | 0.01 | 14.088 | 0.03 | 13.316 | 0.027 | 13.068 | 0.026 | 12.75 | 0.106 | 11.833 | 0.237 | — | — | — | — |
| CAHA_20321626_401254 | 20:32:16.26 | +40:12:54.2 | 17.864 | 0.009 | 15.707 | 0.01 | 14.282 | 0.023 | 12.711 | 0.017 | 12.039 | 0.017 | 11.581 | 0.049 | 11.111 | 0.103 | — | — | — | — |
| CAHA_20323916_401223 | 20:32:39.16 | +40:12:23.2 | 14.6 | 0.018 | 12.759 | 0.022 | 12.049 | 0.022 | 11.536 | 0.017 | 11.475 | 0.019 | 11.083 | 0.083 | 10.366 | 0.216 | — | — | — | — |
| CAHA_20323223_401347 | 20:32:32.23 | +40:13:47.1 | 17.797 | 0.01 | 15.102 | 0.01 | 13.512 | 0.012 | 11.859 | 0.046 | 11.264 | 0.046 | 9.956 | 0.147 | 8.584 | 0.184 | — | — | — | — |
| CAHA_20323296_401334 | 20:32:32.96 | +40:13:34.5 | 14.659 | 0.008 | 12.915 | 0.021 | 12.118 | 0.022 | 10.675 | 0.024 | 10.098 | 0.021 | 9.251 | 0.097 | 8.062 | 0.161 | — | — | 1.920 | 1.205E-14 |
| CAHA_20323055_401356 | 20:32:30.55 | +40:13:56.2 | 18.796 | 0.015 | 15.275 | 0.01 | 13.144 | 0.017 | 11.272 | 0.046 | 10.48 | 0.033 | 9.671 | 0.127 | 8.665 | 0.228 | — | — | 3.059 | 1.572E-15 |
| CAHA_20323042_401221 | 20:32:30.42 | +40:12:21.1 | 17.321 | 0.015 | 15.434 | 0.015 | 14.292 | 0.022 | 13.077 | 0.045 | 12.658 | 0.028 | 11.364 | 0.121 | 10.082 | 0.182 | — | — | — | — |
| CAHA_20323549_401308 | 20:32:35.49 | +40:13:08.9 | 17.794 | 0.012 | 14.456 | 0.012 | 12.912 | 0.023 | 11.898 | 0.024 | 11.703 | 0.023 | 10.857 | 0.111 | 9.75 | 0.194 | — | — | — | — |
| CAHA_20325130_401150 | 20:32:51.30 | +40:11:50.8 | 17.119 | 0.016 | 15.336 | 0.016 | 14.289 | 0.016 | 13.299 | 0.03 | 12.742 | 0.021 | 12.286 | 0.049 | 11.36 | 0.058 | — | — | — | — |
| CAHA_20325783_401208 | 20:32:57.83 | +40:12:08.4 | 15.826 | 0.015 | 14.792 | 0.017 | 14.297 | 0.021 | 14.107 | 0.027 | 13.942 | 0.029 | 13.696 | 0.095 | 12.871 | 0.135 | — | — | — | — |
| CAHA_20330832_401317 | 20:33:08.32 | +40:13:17.2 | 15.914 | 0.01 | 15.062 | 0.016 | 14.513 | 0.029 | 14.045 | 0.026 | 13.567 | 0.027 | 13.146 | 0.07 | 12.456 | 0.114 | — | — | — | — |
| CAHA_20330731_401428 | 20:33:07.31 | +40:14:28.4 | 15.442 | 0.009 | 14.386 | 0.016 | 13.868 | 0.021 | 13.555 | 0.03 | 13.252 | 0.029 | 12.772 | 0.049 | 12.064 | 0.09 | — | — | — | — |
| CAHA_20330608_401211 | 20:33:06.08 | +40:12:11.6 | 14.922 | 0.01 | 13.97 | 0.015 | 13.365 | 0.036 | 13.081 | 0.023 | 12.807 | 0.023 | 12.479 | 0.048 | 11.86 | 0.058 | — | — | — | — |
| CAHA_20315908_401647 | 20:31:59.08 | +40:16:47.9 | 14.435 | 0.006 | 13.58 | 0.008 | 13.221 | 0.013 | 12.687 | 0.021 | 12.142 | 0.019 | 11.856 | 0.057 | 10.977 | 0.139 | — | — | 1.570 | 7.604E-15 |
| CAHA_20320234_401726 | 20:32:02.34 | +40:17:26.9 | 18.316 | 0.011 | 15.371 | 0.007 | 13.777 | 0.008 | 12.528 | 0.023 | 11.981 | 0.02 | 11.466 | 0.051 | 10.813 | 0.088 | — | — | — | — |
| CAHA_20320067_401621 | 20:32:00.67 | +40:16:22.0 | 14.559 | 0.004 | 13.399 | 0.006 | 12.684 | 0.014 | 12.3 | 0.024 | 12.007 | 0.023 | 11.448 | 0.053 | 10.343 | 0.062 | — | — | — | — |
| CAHA_20321121_401703 | 20:32:11.21 | +40:17:03.5 | 16.9 | 0.004 | 15.195 | 0.006 | 14.244 | 0.011 | 12.913 | 0.022 | 12.358 | 0.02 | 11.972 | 0.076 | 11.223 | 0.171 | — | — | — | — |
| CAHA_20321075_401624 | 20:32:10.75 | +40:16:24.8 | 13.638 | 0.004 | 12.659 | 0.006 | 11.911 | 0.018 | 11.199 | 0.016 | 10.843 | 0.016 | 10.509 | 0.019 | 10.005 | 0.057 | — | — | — | — |
| CAHA_20320290_401724 | 20:32:02.90 | +40:17:24.4 | 16.272 | 0.005 | 15.33 | 0.027 | 14.234 | 0.021 | 12.75 | 0.04 | 12.243 | 0.033 | 11.751 | 0.074 | 11.132 | 0.178 | — | — | — | — |
| CAHA_20320046_401506 | 20:32:00.46 | +40:15:06.1 | 15.626 | 0.006 | 13.109 | 0.009 | 12.109 | 0.018 | 11.339 | 0.023 | 11.244 | 0.023 | 10.875 | 0.043 | 10.259 | 0.107 | — | — | — | — |
| CAHA_20320665_401519 | 20:32:06.65 | +40:15:20.0 | 14.918 | 0.005 | 12.888 | 0.007 | 11.834 | 0.02 | 10.679 | 0.016 | 10.308 | 0.016 | 9.932 | 0.038 | 9.529 | 0.117 | — | — | — | — |
| CAHA_20320783_401636 | 20:32:07.83 | +40:16:36.3 | 15.209 | 0.004 | 14.078 | 0.007 | 13.417 | 0.014 | 12.87 | 0.019 | 12.576 | 0.019 | 12.233 | 0.058 | 11.23 | 0.176 | — | — | — | — |
| CAHA_20320403_401828 | 20:32:04.03 | +40:18:28.1 | 20.924 | 0.058 | 17.029 | 0.012 | 14.745 | 0.008 | 13.107 | 0.033 | 12.324 | 0.023 | 11.886 | 0.098 | 10.963 | 0.229 | — | — | — | — |
| CAHA_20320309_401738 | 20:32:03.09 | +40:17:38.4 | 19.014 | 0.018 | 15.72 | 0.007 | 13.95 | 0.009 | 12.491 | 0.021 | 11.803 | 0.02 | 11.231 | 0.048 | 10.465 | 0.089 | — | — | — | — |
| CAHA_20320807_401715 | 20:32:08.07 | +40:17:15.7 | 14.595 | 0.003 | 13.256 | 0.006 | 12.477 | 0.014 | 11.741 | 0.016 | 11.405 | 0.016 | 11.075 | 0.033 | 10.171 | 0.121 | — | — | — | — |
| CAHA_20320848_401550 | 20:32:08.48 | +40:15:50.7 | 16.506 | 0.003 | 15.376 | 0.006 | 14.944 | 0.015 | 14.359 | 0.061 | 14.224 | 0.063 | 12.389 | 0.102 | 10.463 | 0.09 | — | — | — | — |
| CAHA_20322058_401825 | 20:32:20.58 | +40:18:25.4 | 18.092 | 0.007 | 15.837 | 0.012 | 14.668 | 0.023 | 12.748 | 0.023 | 12.0 | 0.02 | 11.443 | 0.074 | 10.774 | 0.114 | — | — | — | — |
| CAHA_20322443_401818 | 20:32:24.43 | +40:18:18.4 | 16.859 | 0.024 | 14.573 | 0.024 | 13.207 | 0.024 | 11.911 | 0.021 | 11.259 | 0.02 | 10.694 | 0.083 | 9.749 | 0.196 | — | — | 2.913 | 1.306E-15 |
| CAHA_20322935_401844 | 20:32:29.35 | +40:18:44.7 | 14.703 | 0.003 | 13.689 | 0.005 | 13.172 | 0.004 | 12.806 | 0.021 | 12.618 | 0.024 | 12.336 | 0.124 | 11.746 | 0.24 | — | — | — | — |
| CAHA_20321655_401808 | 20:32:16.55 | +40:18:08.8 | 15.139 | 0.003 | 13.688 | 0.007 | 12.914 | 0.005 | 12.245 | 0.022 | 11.862 | 0.019 | 11.021 | 0.072 | 9.779 | 0.069 | — | — | — | — |
| CAHA_20323555_401840 | 20:32:35.55 | +40:18:40.3 | 18.715 | 0.015 | 15.218 | 0.005 | 13.545 | 0.006 | 12.638 | 0.022 | 12.426 | 0.023 | 12.034 | 0.112 | 11.721 | 0.239 | — | — | — | — |
| CAHA_20323489_401810 | 20:32:34.89 | +40:18:11.0 | 13.619 | 0.004 | 12.464 | 0.005 | 11.896 | 0.021 | 10.95 | 0.016 | 10.578 | 0.016 | 10.286 | 0.043 | 9.551 | 0.082 | — | — | 1.219 | 1.186E-15 |
| CAHA_20323249_401602 | 20:32:32.49 | +40:16:02.9 | 17.053 | 0.027 | 13.156 | 0.007 | 10.815 | 0.017 | 8.458 | 0.017 | 7.656 | 0.017 | 7.065 | 0.034 | 6.613 | 0.093 | — | — | — | — |
| CAHA_20323176_401616 | 20:32:31.76 | +40:16:16.5 | 14.715 | 0.005 | 11.98 | 0.018 | 10.456 | 0.017 | 9.25 | 0.031 | 8.842 | 0.054 | 7.789 | 0.142 | 5.961 | 0.131 | — | — | — | — |
| CAHA_20324131_401807 | 20:32:41.31 | +40:18:07.2 | 17.244 | 0.005 | 15.14 | 0.007 | 14.169 | 0.007 | 13.383 | 0.021 | 12.98 | 0.022 | 12.605 | 0.101 | 11.901 | 0.207 | — | — | — | — |
| CAHA_20323108_401608 | 20:32:31.08 | +40:16:08.6 | 16.236 | 0.009 | 13.524 | 0.005 | 12.042 | 0.032 | 10.022 | 0.044 | 9.314 | 0.046 | 8.55 | 0.133 | 6.872 | 0.167 | — | — | — | — |
| CAHA_20324014_401812 | 20:32:40.14 | +40:18:12.7 | 16.204 | 0.004 | 14.726 | 0.007 | 13.956 | 0.005 | 13.485 | 0.029 | 13.178 | 0.035 | 12.759 | 0.13 | 11.857 | 0.213 | — | — | — | — |
| CAHA_20323095_401649 | 20:32:30.95 | +40:16:49.6 | 13.021 | 0.004 | 10.756 | 0.022 | 9.763 | 0.017 | 9.074 | 0.032 | 8.531 | 0.031 | 7.958 | 0.127 | 6.609 | 0.208 | — | — | 2.708 | 6.967E-15 |
| CAHA_20323708_401737 | 20:32:37.08 | +40:17:37.5 | 13.577 | 0.004 | 11.519 | 0.031 | 10.529 | 0.026 | 9.853 | 0.023 | 9.483 | 0.027 | 8.839 | 0.084 | 7.252 | 0.093 | — | — | 2.110 | 3.729E-15 |
| CAHA_20323555_401605 | 20:32:35.55 | +40:16:05.8 | 13.195 | 0.007 | 10.399 | 0.022 | 8.493 | 0.017 | 6.322 | 0.016 | 5.666 | 0.015 | 5.036 | 0.021 | 4.051 | 0.038 | — | — | — | — |
| CAHA_20330586_401552 | 20:33:05.86 | +40:15:52.9 | 17.201 | 0.014 | 15.822 | 0.028 | 15.098 | 0.043 | 14.265 | 0.027 | 13.921 | 0.024 | 13.669 | 0.099 | 13.24 | 0.204 | — | — | — | — |
| CAHA_20320906_402043 | 20:32:09.06 | +40:20:43.0 | 14.099 | 0.002 | 12.956 | 0.006 | 12.338 | 0.004 | 12.017 | 0.017 | 11.927 | 0.018 | 11.576 | 0.078 | 10.78 | 0.15 | — | — | — | — |
| CAHA_20321381_401908 | 20:32:13.81 | +40:19:08.6 | 20.069 | 0.057 | 16.556 | 0.007 | 14.37 | 0.006 | 12.346 | 0.092 | 11.718 | 0.054 | 10.147 | 0.178 | 8.759 | 0.227 | — | — | — | — |
| CAHA_20322602_401904 | 20:32:26.02 | +40:19:04.3 | 18.818 | 9.999 | 16.463 | 0.008 | 14.207 | 0.005 | 12.653 | 0.017 | 12.093 | 0.017 | 11.66 | 0.049 | 11.05 | 0.116 | — | — | — | — |
| CAHA_20322626_402216 | 20:32:26.26 | +40:22:16.8 | 15.245 | 0.003 | 13.693 | 0.007 | 12.927 | 0.004 | 12.298 | 0.017 | 11.832 | 0.016 | 11.483 | 0.035 | 10.776 | 0.072 | — | — | — | — |
| CAHA_20322761_401914 | 20:32:27.61 | +40:19:14.5 | 20.543 | 0.057 | 16.125 | 0.006 | 13.617 | 0.005 | 12.102 | 0.017 | 11.45 | 0.017 | 11.021 | 0.045 | 10.301 | 0.058 | — | — | — | — |
| CAHA_20322942_401917 | 20:32:29.42 | +40:19:17.2 | 19.044 | 0.015 | 16.167 | 0.005 | 14.449 | 0.009 | 13.061 | 0.02 | 12.395 | 0.021 | 12.073 | 0.054 | 11.34 | 0.107 | — | — | — | — |
| CAHA_20322974_401906 | 20:32:29.74 | +40:19:06.3 | 18.843 | 0.012 | 16.098 | 0.007 | 14.651 | 0.007 | 13.529 | 0.025 | 12.964 | 0.023 | 12.437 | 0.067 | 11.733 | 0.081 | — | — | — | — |
| CAHA_20322536_402054 | 20:32:25.36 | +40:20:54.5 | 14.601 | 0.003 | 12.966 | 0.006 | 12.168 | 0.004 | 11.392 | 0.017 | 11.041 | 0.016 | 10.586 | 0.019 | 9.925 | 0.055 | — | — | — | — |
| CAHA_20322352_402035 | 20:32:23.52 | +40:20:35.2 | 19.808 | 0.038 | 16.256 | 0.007 | 14.394 | 0.007 | 13.064 | 0.023 | 12.391 | 0.02 | 11.636 | 0.059 | 10.866 | 0.08 | — | — | — | — |
| CAHA_20322337_402212 | 20:32:23.37 | +40:22:12.2 | 15.341 | 0.003 | 13.874 | 0.008 | 13.182 | 0.004 | 12.554 | 0.017 | 12.186 | 0.017 | 11.763 | 0.028 | 10.759 | 0.04 | — | — | — | — |
| CAHA_20321759_402226 | 20:32:17.59 | +40:22:26.4 | 17.119 | 0.006 | 15.531 | 0.008 | 14.738 | 0.006 | 13.952 | 0.028 | 13.531 | 0.024 | 13.111 | 0.081 | 12.349 | 0.072 | — | — | — | — |
| CAHA_20321778_401905 | 20:32:17.78 | +40:19:05.8 | 15.883 | 0.003 | 13.723 | 0.006 | 12.612 | 0.005 | 11.801 | 0.035 | 11.492 | 0.029 | 10.374 | 0.156 | 9.075 | 0.23 | — | — | — | — |
| CAHA_20321874_402003 | 20:32:18.74 | +40:20:03.2 | 19.097 | 0.014 | 16.012 | 0.007 | 14.24 | 0.007 | 12.801 | 0.018 | 12.146 | 0.023 | 11.508 | 0.063 | 10.417 | 0.126 | — | — | — | — |
| CAHA_20321559_402131 | 20:32:15.59 | +40:21:31.2 | 17.573 | 0.005 | 15.115 | 0.007 | 13.785 | 0.004 | 13.103 | 0.019 | 12.853 | 0.02 | 12.689 | 0.113 | 11.855 | 0.246 | — | — | — | — |
| CAHA_20323947_402116 | 20:32:39.47 | +40:21:16.5 | 15.868 | 0.003 | 14.169 | 0.006 | 13.308 | 0.005 | 12.546 | 0.018 | 12.045 | 0.017 | 11.555 | 0.034 | 10.922 | 0.063 | — | — | — | — |
| CAHA_20324423_401939 | 20:32:44.23 | +40:19:39.4 | 16.834 | 0.004 | 15.494 | 0.007 | 14.667 | 0.009 | 13.761 | 0.023 | 13.168 | 0.022 | 12.481 | 0.054 | 11.586 | 0.071 | — | — | — | — |
| CAHA_20323153_402048 | 20:32:31.53 | +40:20:49.0 | 18.767 | 0.018 | 15.671 | 0.006 | 14.18 | 0.009 | 13.323 | 0.02 | 13.097 | 0.021 | 12.761 | 0.058 | 12.403 | 0.122 | — | — | — | — |
| CAHA_20323570_402141 | 20:32:35.70 | +40:21:41.9 | 18.206 | 0.012 | 15.383 | 0.006 | 14.069 | 0.006 | 13.276 | 0.019 | 13.112 | 0.02 | 12.83 | 0.071 | 12.158 | 0.155 | — | — | — | — |
| CAHA_20323809_401943 | 20:32:38.09 | +40:19:43.7 | 18.638 | 0.015 | 15.449 | 0.006 | 13.945 | 0.007 | 13.14 | 0.02 | 12.916 | 0.02 | 12.593 | 0.078 | 12.069 | 0.157 | — | — | — | — |
| CAHA_20323774_401916 | 20:32:37.74 | +40:19:16.4 | 20.18 | 0.044 | 16.788 | 0.011 | 14.861 | 0.006 | 13.415 | 0.021 | 12.829 | 0.021 | 12.384 | 0.095 | 11.399 | 0.107 | — | — | — | — |
| CAHA_20325212_401914 | 20:32:52.12 | +40:19:14.8 | 17.619 | 0.004 | 15.916 | 0.008 | 15.151 | 0.012 | 14.45 | 0.043 | 13.974 | 0.038 | 13.495 | 0.118 | 12.946 | 0.175 | — | — | — | — |
| CAHA_20325635_402129 | 20:32:56.35 | +40:21:29.0 | 17.837 | 0.008 | 15.611 | 0.007 | 14.432 | 0.009 | 13.374 | 0.019 | 12.82 | 0.017 | 12.432 | 0.035 | 11.756 | 0.056 | — | — | — | — |
| CAHA_20315935_402411 | 20:31:59.35 | +40:24:11.4 | 15.12 | 0.006 | 13.917 | 0.012 | 13.485 | 0.043 | 12.841 | 0.018 | 12.476 | 0.017 | 12.116 | 0.032 | 11.572 | 0.049 | — | — | — | — |
| CAHA_20315954_402231 | 20:31:59.54 | +40:22:31.8 | 16.638 | 0.004 | 15.201 | 0.008 | 14.36 | 0.006 | 13.77 | 0.024 | 13.34 | 0.024 | 13.058 | 0.063 | 12.413 | 0.135 | — | — | — | — |
| CAHA_20320915_402301 | 20:32:09.15 | +40:23:01.9 | 16.366 | 0.004 | 14.708 | 0.009 | 13.754 | 0.004 | 12.628 | 0.022 | 12.111 | 0.019 | 11.678 | 0.047 | 10.876 | 0.095 | — | — | — | — |
| CAHA_20320939_402250 | 20:32:09.39 | +40:22:50.6 | 13.076 | 0.004 | 11.106 | 0.023 | 10.307 | 0.017 | 9.56 | 0.016 | 9.078 | 0.016 | 8.597 | 0.016 | 7.961 | 0.017 | — | — | 1.920 | 3.140E-14 |
| CAHA_20320112_402313 | 20:32:01.12 | +40:23:13.2 | 17.417 | 0.019 | 15.762 | 0.03 | 14.796 | 0.039 | 13.528 | 0.019 | 12.909 | 0.017 | 12.462 | 0.047 | 11.808 | 0.077 | — | — | — | — |
| CAHA_20322465_402329 | 20:32:24.65 | +40:23:29.2 | 17.824 | 0.008 | 15.397 | 0.009 | 14.258 | 0.006 | 13.65 | 0.023 | 13.479 | 0.023 | 13.182 | 0.062 | 12.632 | 0.166 | — | — | — | — |
| CAHA_20324555_402331 | 20:32:45.55 | +40:23:31.7 | 17.385 | 0.006 | 15.647 | 0.007 | 14.723 | 0.005 | 14.097 | 0.024 | 13.687 | 0.023 | 13.609 | 0.115 | 12.844 | 0.202 | — | — | — | — |
| CAHA_20324550_402231 | 20:32:45.50 | +40:22:31.7 | 16.875 | 0.004 | 15.837 | 0.007 | 15.174 | 0.005 | 14.419 | 0.038 | 13.977 | 0.033 | 13.046 | 0.059 | 12.014 | 0.091 | — | — | — | — |
| CAHA_20330316_402332 | 20:33:03.16 | +40:23:33.0 | 18.123 | 0.031 | 15.717 | 0.026 | 14.347 | 0.018 | 12.893 | 0.019 | 12.421 | 0.017 | 12.128 | 0.046 | 11.701 | 0.117 | — | — | — | — |
| TWOM_20324634_4009048 | 20:32:46.35 | +40:09:04.9 | 18.49 | 9.999 | 14.906 | 0.059 | 13.206 | 0.036 | 12.13 | 0.017 | 11.948 | 0.017 | 11.546 | 0.038 | 11.182 | 0.062 | — | — | — | — |
| TWOM_20315282_4012188 | 20:31:52.82 | +40:12:18.8 | 13.994 | 0.027 | 13.068 | 0.029 | 12.612 | 0.026 | 12.05 | 0.017 | 11.775 | 0.017 | 11.533 | 0.027 | 11.024 | 0.046 | — | — | — | — |
| TWOM_20322814_4017148 | 20:32:28.14 | +40:17:14.9 | 10.966 | 0.035 | 9.926 | 0.038 | 9.336 | 0.024 | 8.985 | 0.034 | 8.541 | 0.046 | 7.94 | 0.172 | 6.448 | 0.242 | — | — | — | — |
| TWOM_20331278_4018418 | 20:33:12.79 | +40:18:41.8 | 18.61 | 9.999 | 15.771 | 0.13 | 14.561 | 0.103 | 13.589 | 0.029 | 13.368 | 0.024 | 13.103 | 0.098 | 12.477 | 0.185 | — | — | — | — |
| CAHA_20325255_401152 | 20:32:52.55 | +40:11:52.0 | 19.187 | 0.034 | 17.342 | 0.018 | 16.09 | 0.017 | 14.485 | 0.027 | 13.904 | 0.024 | 13.684 | 0.111 | 12.616 | 0.157 | — | — | — | — |
| CAHA_20321844_401724 | 20:32:18.23 | +40:17:27.7 | 18.294 | 0.033 | 16.583 | 0.015 | 15.157 | 0.007 | 13.024 | 0.026 | 12.173 | 0.019 | 11.537 | 0.046 | 10.547 | 0.045 | — | — | — | — |
| CAHA_20322275_401739 | 20:32:22.75 | +40:17:39.6 | 20.249 | 0.058 | 18.616 | 0.064 | 17.053 | 0.089 | 12.84 | 0.153 | 12.698 | 0.187 | 9.895 | 0.171 | 8.093 | 0.184 | — | — | — | — |
| CAHA_20324785_401817 | 20:32:47.85 | +40:18:17.7 | 20.327 | 0.059 | 16.924 | 0.008 | 15.097 | 0.008 | 14.101 | 0.04 | 13.779 | 0.046 | 13.599 | 0.16 | 12.532 | 0.219 | — | — | — | — |
| CAHA_20324105_401849 | 20:32:41.05 | +40:18:49.3 | 18.836 | 0.017 | 16.75 | 0.007 | 15.68 | 0.012 | 14.572 | 0.041 | 14.287 | 0.038 | 13.87 | 0.173 | 12.149 | 0.14 | — | — | — | — |
| CAHA_20325040_401850 | 20:32:50.40 | +40:18:50.4 | 17.912 | 0.009 | 16.288 | 0.01 | 15.384 | 0.01 | 14.69 | 0.056 | 14.384 | 0.051 | 13.923 | 0.118 | 13.129 | 0.199 | — | — | — | — |
| CAHA_20322563_401850 | 20:32:25.63 | +40:18:50.8 | 20.371 | 0.064 | 17.687 | 0.01 | 16.093 | 0.02 | 14.339 | 0.037 | 13.47 | 0.029 | 13.026 | 0.19 | 11.419 | 0.218 | — | — | — | — |
| CAHA_20330273_401903 | 20:33:02.73 | +40:19:03.2 | 18.929 | 0.019 | 16.783 | 0.015 | 15.583 | 0.011 | 14.568 | 0.054 | 14.16 | 0.054 | 13.824 | 0.121 | 12.891 | 0.146 | — | — | — | — |
| CAHA_20323802_401934 | 20:32:38.02 | +40:19:34.4 | 20.414 | 0.051 | 17.149 | 0.012 | 15.2 | 0.009 | 13.652 | 0.023 | 13.145 | 0.021 | 12.602 | 0.075 | 11.952 | 0.115 | — | — | — | — |
| CAHA_20320973_402253 | 20:32:09.73 | +40:22:53.4 | 13.802 | 0.004 | 12.505 | 0.009 | — | — | 10.709 | 0.017 | 10.351 | 0.017 | 9.975 | 0.02 | 9.154 | 0.025 | — | — | — | — |
| CAHA_20315905_401755 | 20:31:59.05 | +40:17:56.0 | — | — | 18.606 | 0.03 | 16.205 | 0.017 | 14.226 | 0.057 | 13.447 | 0.055 | 12.447 | 0.145 | 11.06 | 0.236 | — | — | — | — |
| CAHA_20322723_401923 | 20:32:27.23 | +40:19:23.1 | — | — | 17.445 | 0.011 | 14.791 | 0.008 | 12.988 | 0.029 | 12.078 | 0.03 | 11.483 | 0.095 | 10.825 | 0.189 | — | — | — | — |
| CAHA_20321904_401942 | 20:32:19.04 | +40:19:42.4 | — | — | 17.846 | 0.011 | 14.913 | 0.009 | 12.756 | 0.017 | 12.021 | 0.018 | 11.126 | 0.068 | 9.878 | 0.125 | — | — | — | — |
| CAHA_20321823_402039 | 20:32:18.23 | +40:20:39.4 | — | — | 19.331 | 0.053 | 15.653 | 0.02 | 12.337 | 0.017 | 11.325 | 0.016 | 10.716 | 0.061 | 10.249 | 0.167 | — | — | — | — |
| CAHA_20321538_402356 | 20:32:15.38 | +40:23:56.9 | — | — | 17.495 | 0.023 | 15.832 | 0.034 | 14.414 | 0.024 | 13.942 | 0.025 | 13.44 | 0.08 | 12.978 | 0.241 | — | — | — | — |
| CAHA_20330081_401020 | 20:33:00.81 | +40:10:20.1 | — | — | — | — | 18.342 | 0.121 | 15.457 | 0.055 | 14.702 | 0.061 | 13.348 | 0.082 | 12.192 | 0.091 | — | — | — | — |
| CAHA_20322687_401910 | 20:32:26.87 | +40:19:10.3 | — | — | — | — | 12.997 | 0.006 | 11.497 | 0.016 | 10.941 | 0.016 | 10.605 | 0.031 | 10.164 | 0.069 | — | — | 1.832 | 3.097E-15 |
| CAHA_20322007_401933 | 20:32:20.07 | +40:19:33.6 | — | — | — | — | 16.563 | 0.02 | 13.016 | 0.041 | 11.857 | 0.027 | 11.221 | 0.13 | 9.785 | 0.223 | — | — | — | — |
| SSTCYGX_J203152.69_401840.5 | 20:31:52.68 | +40:18:40.5 | — | — | — | — | — | — | 13.805 | 0.022 | 12.985 | 0.021 | 12.558 | 0.048 | 12.053 | 0.175 | — | — | — | — |
| CAHA_20321015_401847 | 20:32:10.15 | +40:18:48.0 | — | — | 17.561 | 0.014 | 14.716 | 0.008 | 13.155 | 0.074 | 12.549 | 0.065 | 11.844 | 0.44 | 10.831 | 0.807 | — | — | 2.431 | 2.387E-15 |
| CAHA_20321798_401922 | 20:32:17.98 | +40:19:22.3 | 19.178 | 0.018 | 15.984 | 0.006 | 14.341 | 0.006 | 12.932 | 0.077 | 12.54 | 0.056 | 11.309 | 0.362 | — | — | — | — | 3.409 | 1.067E-14 |
| CAHA_20321061_401904 | 20:32:10.61 | +40:19:04.8 | — | — | — | — | 17.616 | 0.05 | 14.017 | 0.067 | 13.097 | 0.081 | 11.677 | 0.173 | — | — | — | — | 3.176 | 1.357E-14 |
| CAHA_20315867_401915 | 20:31:58.67 | +40:19:15.1 | 17.58 | 0.006 | 14.666 | 0.005 | 12.948 | 0.008 | 11.306 | 0.016 | 10.714 | 0.016 | 10.313 | 0.019 | 9.896 | 0.045 | 7.262 | 0.41 | 1.862 | 9.616E-15 |
| CAHA_20320503_401715 | 20:32:05.03 | +40:17:16.0 | 12.833 | 0.005 | 11.862 | 0.019 | 11.351 | 0.016 | 10.564 | 0.016 | 10.174 | 0.015 | 9.762 | 0.02 | 8.992 | 0.046 | 6.837 | 0.749 | 1.380 | 6.313E-15 |
| CAHA_20320542_402126 | 20:32:05.42 | +40:21:26.2 | 14.416 | 0.002 | 13.22 | 0.006 | 12.679 | 0.005 | 12.127 | 0.023 | 11.936 | 0.021 | 11.7 | 0.133 | 11.008 | 0.356 | 6.932 | 0.505 | 1.920 | 1.509E-14 |
| CAHA_20322109_401848 | 20:32:21.09 | +40:18:48.1 | 17.17 | 0.005 | 14.563 | 0.005 | 13.189 | 0.004 | 11.819 | 0.031 | 11.28 | 0.023 | 10.886 | 0.187 | 10.03 | 0.32 | — | — | 2.314 | 2.492E-15 |
| CAHA_20322641_401515 | 20:32:26.41 | +40:15:15.6 | 15.269 | 0.007 | 12.963 | 0.007 | 11.691 | 0.018 | 10.435 | 0.025 | 10.028 | 0.025 | 9.808 | 0.219 | 9.412 | 0.829 | — | — | 1.920 | 1.220E-15 |
| CAHA_20323239_401643 | 20:32:32.39 | +40:16:43.3 | 15.99 | 0.005 | 13.31 | 0.005 | 11.504 | 0.026 | 10.049 | 0.071 | 9.374 | 0.043 | 9.051 | 0.477 | — | — | — | — | 3.059 | 7.560E-15 |
| CAHA_20323582_401745 | 20:32:35.82 | +40:17:45.0 | 13.798 | 0.004 | 12.611 | 0.008 | 12.108 | 0.033 | 11.136 | 0.049 | 10.972 | 0.043 | 9.44 | 0.243 | — | — | — | — | 2.781 | 6.038E-15 |
| CAHA_20324487_401834 | 20:32:44.87 | +40:18:34.1 | 15.417 | 0.005 | 13.309 | 0.008 | 12.165 | 0.021 | 11.274 | 0.016 | 10.967 | 0.016 | 10.707 | 0.022 | 10.187 | 0.048 | 7.054 | 0.322 | 2.256 | 8.162E-15 |
| CAHA_20325504_401617 | 20:32:55.04 | +40:16:17.3 | 13.48 | 0.009 | 12.375 | 0.021 | 11.68 | 0.019 | 10.542 | 0.015 | 10.282 | 0.015 | 10.11 | 0.017 | 9.77 | 0.017 | 6.073 | 0.163 | 1.526 | 1.505E-14 |
| CAHA_20330681_401337 | 20:33:06.81 | +40:13:37.9 | 13.464 | 0.017 | 12.831 | 0.024 | 12.525 | 0.027 | 11.991 | 0.016 | 11.836 | 0.017 | 11.689 | 0.027 | 11.2 | 0.044 | 7.413 | 0.258 | 1.613 | 1.026E-14 |
| Source | RA | DEC | J | H | K | [3.6] | [4.5] | [5.8] | [8.0] | [24 m] | Median Energy | Energy Flux | ||||||||
|---|---|---|---|---|---|---|---|---|---|---|---|---|---|---|---|---|---|---|---|---|
| [J2000] | [mag] | [keV] | [erg/cm2/s] | |||||||||||||||||
| CAHA_20322152_401104 | 20:32:21.52 | +40:11:04.6 | 13.842 | 0.016 | 13.002 | 0.015 | 12.596 | 0.028 | 12.559 | 0.019 | 12.548 | 0.021 | 12.395 | 0.078 | 11.608 | 0.169 | — | — | 2.548 | 6.699E-15 |
| CAHA_20323285_401056 | 20:32:32.85 | +40:10:56.5 | 16.605 | 0.017 | 15.081 | 0.012 | 14.321 | 0.02 | 14.065 | 0.232 | 14.028 | 0.171 | — | — | — | — | — | — | 3.438 | 6.162E-15 |
| CAHA_20320491_401359 | 20:32:04.91 | +40:13:59.3 | 13.227 | 0.008 | 12.717 | 0.023 | 12.476 | 0.024 | 12.571 | 0.021 | 12.592 | 0.021 | 12.509 | 0.099 | — | — | — | — | 1.190 | 5.738E-15 |
| CAHA_20321916_401318 | 20:32:19.16 | +40:13:18.2 | 15.919 | 0.011 | 14.424 | 0.01 | 13.758 | 0.025 | 13.357 | 0.055 | 13.247 | 0.067 | 13.21 | 0.55 | — | — | — | — | 2.489 | 3.258E-15 |
| CAHA_20323784_401352 | 20:32:37.84 | +40:13:52.7 | 15.577 | 0.014 | 14.011 | 0.027 | 13.419 | 0.021 | 13.344 | 0.233 | 13.284 | 0.25 | — | — | — | — | — | — | 3.263 | 1.022E-14 |
| CAHA_20324208_401220 | 20:32:42.08 | +40:12:20.3 | 14.24 | 0.014 | 13.071 | 0.017 | 12.52 | 0.022 | 12.381 | 0.019 | 12.255 | 0.02 | 12.494 | 0.123 | — | — | — | — | 1.905 | 7.653E-15 |
| CAHA_20323075_401419 | 20:32:30.75 | +40:14:19.5 | 15.255 | 0.028 | 12.881 | 0.044 | 11.66 | 0.025 | 10.803 | 0.072 | 10.597 | 0.071 | — | — | — | — | — | — | 2.694 | 1.592E-14 |
| CAHA_20325387_401420 | 20:32:53.87 | +40:14:20.4 | 13.2 | 0.015 | 12.069 | 0.019 | 11.614 | 0.018 | 11.383 | 0.016 | 11.305 | 0.016 | 11.215 | 0.024 | 11.149 | 0.149 | — | — | 1.818 | 2.580E-14 |
| CAHA_20325533_401440 | 20:32:55.33 | +40:14:40.3 | 15.64 | 0.014 | 14.432 | 0.015 | 13.914 | 0.014 | 13.712 | 0.023 | 13.654 | 0.027 | 13.552 | 0.093 | — | — | — | — | 2.212 | 8.545E-15 |
| CAHA_20320256_401740 | 20:32:02.56 | +40:17:40.5 | 13.948 | 0.005 | 13.094 | 0.006 | 12.814 | 0.01 | 12.755 | 0.029 | 12.633 | 0.034 | 12.802 | 0.247 | — | — | — | — | 1.467 | 3.822E-15 |
| CAHA_20320237_401701 | 20:32:02.37 | +40:17:01.1 | 13.188 | 0.003 | 12.005 | 0.039 | 11.556 | 0.028 | 11.155 | 0.016 | 11.008 | 0.016 | 10.808 | 0.034 | 10.338 | 0.081 | — | — | 1.511 | 2.660E-14 |
| CAHA_20321032_401752 | 20:32:10.32 | +40:17:53.0 | 14.269 | 0.003 | 13.309 | 0.006 | 12.949 | 0.009 | 12.646 | 0.03 | 12.564 | 0.043 | 12.658 | 0.378 | 12.546 | 1.721 | — | — | 1.073 | 3.459E-15 |
| CAHA_20321962_401812 | 20:32:19.62 | +40:18:12.4 | 13.391 | 0.004 | 12.21 | 0.027 | 11.83 | 0.021 | 11.669 | 0.017 | 11.53 | 0.017 | 11.415 | 0.064 | 11.042 | 0.159 | — | — | 1.292 | 3.995E-15 |
| CAHA_20322560_401805 | 20:32:25.60 | +40:18:05.3 | 19.153 | 0.02 | 15.839 | 0.005 | 14.207 | 0.004 | 13.319 | 0.063 | 13.104 | 0.09 | 13.092 | 0.671 | — | — | — | — | 3.570 | 2.168E-13 |
| CAHA_20323482_401818 | 20:32:34.82 | +40:18:18.4 | 14.571 | 0.021 | 13.428 | 0.028 | 12.995 | 0.029 | 12.655 | 0.027 | 12.56 | 0.037 | 12.213 | 0.136 | — | — | — | — | 1.438 | 4.581E-15 |
| CAHA_20324203_401510 | 20:32:42.03 | +40:15:10.2 | 14.755 | 0.009 | 13.799 | 0.011 | 13.423 | 0.013 | 13.169 | 0.111 | 13.281 | 0.12 | — | — | — | — | — | — | 1.175 | 3.020E-15 |
| CAHA_20323083_401706 | 20:32:30.83 | +40:17:06.1 | 15.738 | 0.006 | 13.446 | 0.007 | 12.33 | 0.009 | 11.896 | 0.078 | 11.932 | 0.113 | — | — | — | — | — | — | 3.380 | 5.798E-14 |
| CAHA_20323043_401643 | 20:32:30.43 | +40:16:43.2 | 15.525 | 0.003 | 13.049 | 0.006 | 11.933 | 0.026 | 11.182 | 0.055 | 11.031 | 0.106 | — | — | — | — | — | — | 2.716 | 7.643E-15 |
| CAHA_20325412_401547 | 20:32:54.12 | +40:15:47.9 | 17.073 | 0.009 | 15.642 | 0.013 | 15.02 | 0.012 | 14.742 | 0.041 | 14.508 | 0.052 | — | — | — | — | — | — | 1.978 | 1.2521E-14 |
| CAHA_20325095_401520 | 20:32:50.95 | +40:15:20.2 | 14.535 | 0.01 | 13.575 | 0.013 | 13.178 | 0.008 | 12.989 | 0.022 | 12.938 | 0.028 | 12.74 | 0.112 | — | — | — | — | 1.219 | 8.092E-15 |
| CAHA_20315441_402153 | 20:31:54.41 | +40:21:53.2 | 13.824 | 0.005 | 12.53 | 0.009 | 12.024 | 0.018 | 11.721 | 0.016 | 11.667 | 0.016 | 11.605 | 0.027 | 11.665 | 0.093 | — | — | 1.745 | 8.670E-15 |
| CAHA_20315532_402127 | 20:31:55.32 | +40:21:27.6 | 14.938 | 0.002 | 13.572 | 0.008 | 12.999 | 0.005 | 12.716 | 0.02 | 12.601 | 0.021 | 12.687 | 0.105 | 12.069 | 0.322 | — | — | 1.657 | 3.869E-15 |
| CAHA_20320065_401931 | 20:32:00.65 | +40:19:31.8 | 17.586 | 0.005 | 15.52 | 0.006 | 14.493 | 0.008 | 13.831 | 0.039 | 13.648 | 0.036 | 13.508 | 0.404 | — | — | — | — | 2.022 | 5.032E-15 |
| CAHA_20320051_402020 | 20:32:00.51 | +40:20:20.2 | 13.538 | 0.002 | 12.756 | 0.006 | 12.468 | 0.005 | 12.438 | 0.033 | 12.417 | 0.044 | 12.317 | 0.12 | 11.485 | 0.299 | — | — | 1.365 | 5.296E-15 |
| CAHA_20320956_401901 | 20:32:09.56 | +40:19:01.3 | 18.248 | 0.009 | 13.633 | 0.006 | 11.067 | 0.016 | 9.439 | 0.017 | 8.995 | 0.017 | 8.7 | 0.039 | 8.721 | 0.137 | — | — | 2.533 | 4.274E-15 |
| CAHA_20320899_401937 | 20:32:08.99 | +40:19:37.3 | 13.226 | 0.003 | 12.039 | 0.021 | 11.586 | 0.016 | 11.278 | 0.021 | 11.204 | 0.029 | 11.309 | 0.203 | 12.854 | 3.984 | — | — | 1.803 | 3.219E-14 |
| CAHA_20321374_401856 | 20:32:13.74 | +40:18:57.0 | 18.195 | 0.007 | 14.942 | 0.007 | 13.283 | 0.005 | 12.483 | 0.081 | 12.185 | 0.058 | 11.035 | 0.227 | — | — | — | — | 2.548 | 1.6081E-14 |
| CAHA_20322030_401901 | 20:32:20.30 | +40:19:01.8 | 15.208 | 0.003 | 13.298 | 0.005 | 12.42 | 0.005 | 11.744 | 0.034 | 11.482 | 0.027 | 11.051 | 0.239 | — | — | — | — | 2.621 | 8.350E-15 |
| CAHA_20322943_401858 | 20:32:29.43 | +40:18:58.9 | 15.257 | 0.011 | 13.795 | 0.007 | 13.134 | 0.006 | 12.803 | 0.023 | 12.699 | 0.025 | 12.67 | 0.107 | 12.967 | 0.732 | — | — | 1.584 | 2.927E-15 |
| CAHA_20322803_401927 | 20:32:28.03 | +40:19:27.6 | 15.742 | 0.012 | 13.726 | 0.017 | 12.758 | 0.024 | 12.166 | 0.021 | 11.895 | 0.042 | 11.74 | 0.115 | — | — | — | — | 1.584 | 4.456E-15 |
| CAHA_20321720_401910 | 20:32:17.20 | +40:19:10.0 | 15.663 | 0.003 | 15.001 | 0.006 | 14.695 | 0.006 | 14.39 | 0.175 | 14.528 | 0.198 | — | — | — | — | — | — | 1.584 | 3.054E-15 |
| CAHA_20324072_402146 | 20:32:40.72 | +40:21:46.2 | 14.345 | 0.003 | 12.705 | 0.006 | 12.007 | 0.022 | 11.619 | 0.016 | 11.456 | 0.016 | 11.386 | 0.027 | 11.445 | 0.059 | — | — | 2.227 | 1.829E-14 |
| CAHA_20323427_401851 | 20:32:34.27 | +40:18:51.1 | 15.769 | 0.005 | 13.771 | 0.005 | 12.887 | 0.006 | 12.478 | 0.017 | 12.353 | 0.019 | 12.112 | 0.08 | 12.208 | 0.269 | — | — | 1.716 | 1.399E-15 |
| CAHA_20320116_402233 | 20:32:01.16 | +40:22:33.9 | 15.79 | 0.002 | 14.135 | 0.008 | 13.341 | 0.006 | 12.809 | 0.02 | 12.754 | 0.021 | 12.698 | 0.059 | 13.085 | 0.224 | — | — | 1.978 | 3.314E-15 |
| TWOM_20324184_4014001 | 20:32:41.84 | +40:14:00.2 | 11.113 | 0.021 | 10.838 | 0.018 | 10.789 | 0.017 | 10.793 | 0.019 | 10.816 | 0.021 | 10.639 | 0.116 | 10.248 | 0.302 | — | — | 0.883 | 4.458E-15 |
| TWOM_20330733_4014348 | 20:33:07.33 | +40:14:34.8 | 11.646 | 0.022 | 11.18 | 0.019 | 11.041 | 0.018 | 10.981 | 0.016 | 10.968 | 0.016 | 10.935 | 0.021 | 10.923 | 0.044 | — | — | 1.131 | 2.840E-14 |
| TWOM_20323631_4020142 | 20:32:36.32 | +40:20:14.3 | 11.918 | 9.999 | 11.508 | 0.027 | 11.443 | 0.026 | 11.432 | 0.016 | 11.48 | 0.017 | 11.409 | 0.073 | 11.268 | 0.231 | — | — | 0.986 | 3.822E-15 |
| TWOM_20330655_4022485 | 20:33:06.55 | +40:22:48.6 | 10.945 | 0.022 | 10.767 | 0.019 | 10.719 | 0.018 | 10.708 | 0.016 | 10.721 | 0.016 | 10.73 | 0.019 | 10.804 | 0.04 | — | — | 0.898 | 3.0744E-15 |
| CAHA_20321512_401714 | 20:32:15.12 | +40:17:14.8 | 14.779 | 0.003 | 13.287 | 0.005 | 12.676 | 0.008 | 12.291 | 0.019 | 12.159 | 0.022 | 12.094 | 0.135 | — | — | — | — | 1.789 | 5.472E-15 |
| CAHA_20320777_401759 | 20:32:07.77 | +40:17:59.4 | 16.206 | 0.092 | 13.979 | 0.038 | 13.316 | 0.009 | — | — | — | — | — | — | — | — | — | — | 4.417 | 2.468E-15 |
| CAHA_20323293_401511 | 20:32:32.93 | +40:15:11.6 | 17.384 | 0.011 | 15.979 | 0.01 | 15.275 | 0.011 | — | — | — | — | — | — | — | — | — | — | 2.650 | 1.288E-13 |
| CAHA_20322779_401512 | 20:32:27.79 | +40:15:12.4 | 18.761 | 0.011 | 16.498 | 0.009 | 15.323 | 0.011 | — | — | — | — | — | — | — | — | — | — | 5.351 | 4.285E-15 |
| CAHA_20330360_401707 | 20:33:03.60 | +40:17:07.4 | 20.784 | 0.065 | 19.02 | 0.044 | 18.445 | 0.094 | — | — | — | — | — | — | — | — | — | — | 2.562 | 7.871E-15 |
| CAHA_20315779_401717 | 20:31:57.79 | +40:17:17.9 | 15.757 | 0.004 | 14.392 | 0.006 | 13.699 | 0.015 | — | — | — | — | — | — | — | — | — | — | 1.920 | 3.300E-15 |
| CAHA_20324085_401304 | 20:32:40.85 | +40:13:04.7 | 20.26 | 0.069 | 17.919 | 0.041 | 17.023 | 0.049 | — | — | — | — | — | — | — | — | — | — | 1.949 | 2.980E-15 |