Advanced Data Visualization in Astrophysics: the X3D Pathway
Abstract
Most modern astrophysical datasets are multi-dimensional; a characteristic that can nowadays generally be conserved and exploited scientifically during the data reduction/simulation and analysis cascades. Yet, the same multi-dimensional datasets are systematically cropped, sliced and/or projected to printable two-dimensional (2-D) diagrams at the publication stage. In this article, we introduce the concept of the “X3D pathway” as a mean of simplifying and easing the access to data visualization and publication via three-dimensional (3-D) diagrams. The X3D pathway exploits the facts that 1) the X3D 3-D file format lies at the center of a product tree that includes interactive HTML documents, 3-D printing, and high-end animations, and 2) all high-impact-factor & peer-reviewed journals in Astrophysics are now published (some exclusively) online. We argue that the X3D standard is an ideal vector for sharing multi-dimensional datasets, as it provides direct access to a range of different data visualization techniques, is fully-open source, and is a well defined ISO standard. Unlike other earlier propositions to publish multi-dimensional datasets via 3-D diagrams, the X3D pathway is not tied to specific software (prone to rapid and unexpected evolution), but instead compatible with a range of open-source software already in use by our community. The interactive HTML branch of the X3D pathway is also actively supported by leading peer-reviewed journals in the field of Astrophysics. Finally, this article provides interested readers with a detailed set of practical astrophysical examples designed to act as a stepping stone towards the implementation of the X3D pathway for any other dataset.
Subject headings:
general: publications, bibliography – general: standards – methods: data analysis – techniques: miscellaneous1. Introduction
A large majority of datasets in modern Astrophysics, whether observational or theoretical, are multi-dimensional with a number of dimensions . The multi-dimensionality of a dataset can be intrinsic: for example the (reduced) three-dimensional (3-D) data cubes acquired by integral field spectrographs. Alternatively, the multi-dimensionality of a dataset can be the result of the combination of several subsets of data, for example when looking at the Fundamental Plane formed by elliptical galaxies (Springob et al., 2012). Understanding and characterizing the structure and content of these complex datasets across all their dimensions holds the key to improving our understanding of the physics at play in the Universe.
The computing power nowadays accessible to astronomers usually allows multi-dimensional datasets to be handled as such throughout the entire data reduction/simulation and analysis cascades. At the result publication stage however, multi-dimensional datasets are systematically sliced, compressed and/or projected: a “habit” largely driven by historical reasons. As dedicated scientific journals were physically printed on papers, it was a physical requirement for scientific diagrams (used as a mean of illustrating the content of complex datasets) to be printable.
Forcing a multi-dimensional dataset on a two-dimensional (2-D) diagram usually implies a loss of information. Such a loss of information is certainly not always detrimental, as it can help emphasize certain elements of interest in the data. In a growing number of cases however, the need to understand the full multi-dimensional structure of the data - and our ability as scientists to share such structures with the community - is directly and evidently affected by the current lack of suitable alternatives to the classical 2-D printable diagrams.
The exploration of alternative techniques for data visualization is not only warranted by the existing difficulties associated with sharing multi-dimensional datasets in a clear, concise and meaningful way, but also by the data “deluge” triggered by the most recent or forthcoming astronomy facilities. For example, data products from the Low-Frequency Array for Radio Astronomy (LOFAR) or the Square Kilometre Array (SKA) by 2020 can not be easily handled with current computing power and technologies. Visualizing and sharing such complex (and large) datasets with the community will inevitably require innovative solutions.
All major scientific journals dedicated to astrophysical sciences are now published online. Some, like the American Astronomical Society journals111The AAS journals include (at the time of submission of this article) the Astrophysical Journal (ApJ), Astrophysical Journal Letters (ApJL), Astrophysical Journal Supplement (ApJS) and Astronomical Journal (AJ). (AAS journals), have in fact abandoned the physically printed form altogether. It has also become usual for articles submitted to peer-reviewed publications to be uploaded to the arXiv online pre-print server. The emergence of supplementary online material, such as extensive data tables, is possibly the prime example of the benefits that have resulted (so far) from the implementation of electronic journals. New initiatives such as that of Research Objects222 http://www.researchobject.org aim at further exploiting online technologies to group more strongly scientific articles with their associated datasets, tools, workflows and methodologies (e.g. Hettne et al., 2012, 2013) in order to improve their identification, legacy and re-usability (see also Goodman et al., 2015).
Given a largely electronic publishing landscape, one may wonder why no well-established alternative(s) to the classical 2-D printable diagrams exist at this time. The problem of sharing and publishing multi-dimensional datasets has of course been identified in the past. Besides movies and animations, several alternative solutions have been discussed in recent years in the field of Astrophysics, including interactive PDF documents (Barnes & Fluke, 2008), stereo pairs (Vogt & Wagner, 2012), augmented reality (Vogt & Shingles, 2013), 3-D printing (Steffen et al., 2014; Vogt et al., 2014; Madura et al., 2015) and interactive HTML documents (Vogt et al., 2014). However, most of these propositions suffer from two distinct and equally severe flaws that hinder their expansion in the field of Astrophysics.
First, these techniques have been largely associated with specific software, some of which not open-source. In the case of the interactive PDF approach, Barnes & Fluke (2008) suggested the s2plot software (Barnes et al., 2006) for generating 3-D models, and relied on the commercial adobe acrobat professional software for the conversation of the model to the U3D file format: the only 3-D file format suitable for the inclusion of interactive 3-D models in PDF documents. Relying on specific software restricts the freedom of choice of the user, and often impedes on one’s ability to experiment with these new techniques. Software is also subject to very rapid changes and evolution, so that specific tools can become obsolete unexpectedly rapidly. In the case of interactive PDF for example, adobe acrobat professional stopped supporting the inclusion of U3D files in interactive documents in v10; a task that was then relegated to third party software.
Second, the degree to which these different methods are supported by the principal scientific journals in the field of Astrophysics varies widely, and no technique is currently “actively” supported and encouraged by all journals. The different visualization techniques mentioned above are therefore often regarded as experimental. The need for specific software to implement these different solutions certainly also reinforces this impression.
The present article introduces the concept of the “X3D pathway” as a new approach to visualizing, sharing and publishing multi-dimensional datasets that solves the above mentioned issues. Specifically, the X3D pathway suggests the utilization of the X3D file format as a centralized mean of implementing advanced visualization solutions via 3-D diagrams for astrophysical multi-dimensional datasets.
The primary goals of this article are: 1) to further demystify the use of advanced visualization techniques in the field of Astrophysics, 2) to introduce the X3D pathway as a viable and polyvalent approach to advanced multi-dimensional data visualization and 3) to provide a full set of dedicated astrophysical examples (including complete scripts, datasets and step-by-step instructions) to enable the interested readers to familiarise themselves and implement the X3D pathway rapidly and easily with their own datasets.
This article is structured as follows. The notion of the X3D pathway is introduced in Section 2 and example implementations are presented in Section 3. The demonstration datasets are described in Section 3.1. Each branch of the X3D pathway is then discussed individually, including: the creation of X3D models in Section 3.2, the creation of interactive HTML documents in Section 3.3, the connection of X3D to 3-D printing in Section 3.4 and the creation of high quality movies and animations in Section 3.5. We present our conclusions in Section 4. All uniform resource locators (URLs) provided in this article are valid as of the date of submission. Wherever available, digital object identifiers (DOI) are quoted instead.
Note to arXiv readers: although some DOIs remain to be minted by ApJ upon publication of the article, all the different scripts, instructions sets, movies, etc … mentioned in the text are already available in a dedicated Github repository. See https://github.com/fpavogt/x3d-pathway, and/or DOI:10.5281/zenodo.31953. For yet un-minted DOIs, a temporary URLs is provided instead.
2. The X3D pathway
The X3D (Extensible 3-D) file format is an International Standards Organization (ISO) ratified standard developed and maintained by the Web3D Consortium333http://www.web3d.org. A detailed description of this file format is provided by Daly & Brutzman (2007), to which we refer the interested reader for further information. Repeating verbatim the description provided by the Web3D Consortium, “X3D is a royalty-free open standards file format and run-time architecture to represent and communicate 3-D scenes and objects using XML”. The X3D file format has evolved from the Virtual Reality Modeling Language (VRML) format, with the intent to become the standard file format for the publication of 3-D graphics on the World Wide Web. While the X3D standard is still evolving, backwards compatibility of the file format is a key objective pursued by the Web3D Consortium (Daly & Brutzman, 2007). The Web3D Consortium has also established connection with the World Wide Web Consortium444 W3C; http://www.w3.org/ and other partners555 http://www.web3d.org/about/liaisons to ensure the compatibility of the X3D file format with the evolving World Wide Web.
The X3D file format uses a rectangular, right-handed coordinate system. It supports (among other elements) polygonal and parametric geometry, with data points and meshes represented via solid shapes and surfaces. The X3D standard also supports the inclusion of 2-D text in 3-D space, useful for annotating models, as well as lighting elements and materials. Volumetric rendering (with an emphasis on human anatomy representation) is being developed by the Medical Working Group for X3D666 http://www.web3d.org/working-groups/medical, with dedicated (and still limited) specifications included in ISO X3D v3.3. Several quality assurance tools developed alongside the X3D standard itself, for example X3D-Edit777 https://savage.nps.edu/X3D-Edit or the online X3D Validator888 https://savage.nps.edu/X3dValidator allow to easily inspect X3D files to ensure they contain no syntax errors and follow the X3D file format conventions.
The underlying idea of the X3D pathway is that the X3D file format lies at the core of different visualization solutions for multi-dimensional datasets via 3-D diagrams, including interactive HTML documents, 3-D printing and high-end movies and animations. A schematic guide to the implementation of these advanced visualization techniques (via the X3D standard) for multi-dimensional datasets is presented in Figure 1. The links forming the X3D pathway are marked with thick orange connections.
The X3D pathway is not software dependant. The software names connecting each nodes of the pathway in Figure 1 are existing and working solutions which we believe are currently the most suitable for astronomers with no prior experience in 3-D data visualization, and for which we provide dedicated examples as supplementary material to this article. But a wide range of software compatible with the X3D pathway exits, some intrinsically more complex and/or non-open source, but possibly more capable and/or familiar to specific users. Specific alternatives will be mentioned in Sections 3.2 to 3.5.
Rather than specific software, the X3D pathway is centred on file formats - and in particular on the X3D file format. Although file formats are not immune to change and evolution, such changes can be expected to be gradual and slow in comparison to the evolution of associated software. In fact, relying on file formats rather than specific software not only ensures the long-term stability of the X3D pathway, but also does not restrict the existing (or future) freedom of choice of astronomers to implement it. The X3D standard also brings the important features of re-usability and lasting legacy of the material, as backward compatibility is a key element of the X3D file format set by the Web3D consortium. Finally, the X3D standard is fully open source, a fact which acts as a guarantee that we (as a community) are able to directly influence its evolution to match our needs; for example via the hypothetic creation of a new Web3D working group999 http://www.web3d.org/working-groups dedicated to the promotion and development of new X3D specifications for the field of Astronomy and Astrophysics.
2.1. Interactive PDF and interactive HTML documents
Interactive PDF documents are a reader-friendly solution to sharing interactive 3-D models with the scientific community, as they do not require readers to have access to costly commercial software101010 Interactive PDF documents can be opened using recent versions of adobe acrobat reader, freely available online: https://get.adobe.com/reader/. Interactive PDF articles have been used successfully be several authors in recent years in the field of Astrophysics (see e.g. Springob et al., 2012; Putman et al., 2012; Springob et al., 2014; Miki et al., 2014; Steffen et al., 2014; Madura et al., 2015; Vogt et al., 2015). Of course, one of the main advantage of interactive PDF documents (from a scientist perspective) is that interactive models can be embedded directly inside the PDF of an article, thereby ensuring their long term accessibility. One pathway (as implemented by Vogt et al., 2015) leading to the U3D file required for the creation of an interactive PDF document is illustrated in Figure 1.
But interactive PDF documents also have two distinct drawbacks. First, interactive PDF documents can (at the time of submission of this article) only be opened using adobe acrobat reader v9.0 or above, as other PDF reading software (such as Apple’s preview) will only display a still cover image. As such, interactive PDF documents very strongly restrict the freedom of choice of the reader. Second, the U3D file format is non-straightforward to generate. For example, Vogt et al. (2015) used the commercial software pdf3dreportgen. meshlab 111111 http://meshlab.sourceforge.net/ is an open-source alternative often cited as the solution to the creation of U3D files. In reality, meshlab (v1.3.3) is suitable for creating U3D files only under very specific circumstances, as this software currently does not support semi-transparent layers, and is unable to conserve a complex model tree throughout the conversion process.
The idea of interactive HTML documents was recently used by Vogt et al. (2014) to publish an interactive model of a 3-D emission line ratio diagram. Unlike interactive PDF documents, interactive HTML documents do not strongly restrict the user’s freedom of choice (they are compatible with all major web browsers, see Section 3.3), and most importantly, the X3D file format (at the base of interactive HTML documents) can be freely created using open-source software (e.g. python). These publishing advantages are clear enough that the AAS journals are now actively supporting and promoting the use of interactive HTML documents to share multi-dimensional datasets, where Figure 1 in Vogt et al. (2014) was used as a proof-of-concept121212 DOI:10.1088/0004-637X/793/2/127/data. Interactive 3-D graphics are but one of a suite of plans for enhanced graphics and advances in publishing technology currently being discussed by the AAS journals131313 http://aas.org/posts/news/2015/02/changes-ahead-aas-journals.
Although we believe that the intrinsic advantages of interactive HTML documents render them more suitable for the field of Astrophysics than interactive PDF documents, we stress that these solutions are not mutually exclusive. Indeed, U3D files can be generated from X3D files (see Figure 1), so that interactive PDF documents in fact represent another branch of the X3D pathway tree. We shall not discuss interactive PDF in details in this article, as 1) their creation (using the media9 and/or the now obsolete movie15 LaTeXpackages) and features have already been discussed by Barnes & Fluke (2008), and 2) to the best of our knowledge the creation of U3D files remains a difficult problem to which no real open-source solution currently exists (modulo meshlab under specific circumstances).
3. Implementing the X3D pathway
In this Section, we implement a practical demonstration of how the X3D pathway can be used to aid in the visualization and publication of complex, multi-dimensional datasets in Astrophysics. Although the X3D pathway does not rely on specific software per se, software is certainly still required to exploit and implement it. Hence, this Section is also intended as a mean of providing complete and realistic scripts and step-by-step instructions to the interested reader. All the scripts are available in a dedicated Github repository141414 https://github.com/fpavogt/x3d-pathway, and for legacy purposes, a DOI was tied to the release v0.9 of the repository (DOI:10.5281/zenodo.31953; Vogt, 2015) using Zenodo. We set our focus on two specific tools: the mayavi151515 Throughout this article, when we refer to mayavi, we mean mayavi2, the second generation module developed and maintained by Enthought: http://docs.enthought.com/mayavi/mayavi/ module in python (Ramachandran & Varoquaux, 2011, used for the initial 3-D plotting of multi-dimensional datasets and the export to the X3D file format), and blender161616 http://www.blender.org (for the creation of high-end movies & animations and 3-D printable models).
The structure and content of the material inside the v0.9 release of the Github repository associated to this article is described in detail in Appendix A. The different scripts and sets of instructions provided in the repository are not discussed in details in the core of this article, aside of a general description, as such a description is not of direct importance to the concept of the X3D pathway itself. Furthermore, these scripts represent only one (among a few equivalent) ways to implement the X3D pathway, so that describing specific examples in details would unjustifiably emphasize specific software.
3.1. Demonstration datasets
3.1.1 Green and red dices
In order to provide series of examples of increasing complexity, we first use two basic 3-D structures: a green dice and a red dice. These models are designed with incremental complexity leading to the visualization of a datacube from the Very Large Array (VLA) (see Section 3.1.2). Screenshots of both the green and red dice examples (as drawn inside the mayavi interactive plotting window) are presented in Figure 2.
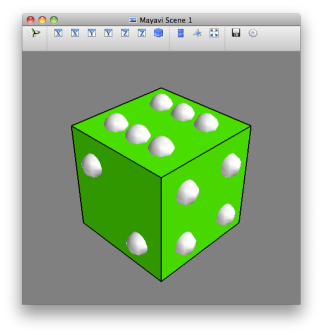
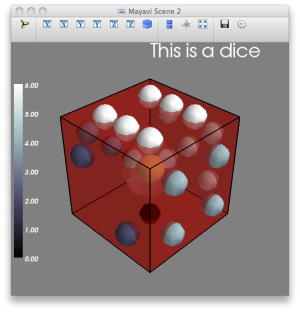
The green dice is our most simple example. It illustrates the basic, minimal steps required to visualize multi-dimensional data interactively using mayavi, publish it using interactive HTML documents, and animate it using blender. The red dice example contains a semi-transparent cube with two inner-spheres (white and yellow), some 3-D text and a colorbar. This example was designed to hit some of the current limitations associated with creating X3D files using mayavi while keeping the actual 3-D structure as simple as possible.
3.1.2 The H I gas content of HCG 91
Our realistic astrophysical example is based on the VLA observations of the H I gas distribution and kinematics around the galaxies inside the Hickson Compact Group (HCG) 91. The complexity of this VLA dataset makes it a prime example to illustrate how advanced visualization techniques such as interactive HTML documents, 3-D printing, and high-end animations (implemented via the X3D pathway) can help in visualizing, understanding, sharing and publishing the structural content of the data. Visualizing the cold gas distribution in and around galaxies to trace their evolution is also one of the main scientific drivers of the SKA, and 3-D diagrams can play an important role in the analysis of these datasets (see e.g. Punzo et al., 2015).
HCG 91 is a group of 4 galaxies first catalogued by Hickson (1982) at a distance of Mpc in the constellation of Piscis Austrinus. The H I cold gas distribution and kinematics in this group, which is a prime tracer of ongoing gravitational interactions between its member galaxies and of the overall evolutionary stage of the group (e.g. Verdes-Montenegro et al., 2001) was observed by the VLA in New Mexico (P.I.: L. Verdes-Montenegro, P.Id.: AV0285) on 2005 October 5. This dataset was used by Vogt et al. (2015) to characterize the evolutionary stage of the galaxy HCG 91c, and will be analyzed in details in Verdes-Montenegro et al. (in prep.) to which we refer the reader for further details on the scientific implications of these observations. Here, we restrict ourselves to a generic description of the data, which is used as a realistic and representative example of multi-dimensional astrophysical datasets.
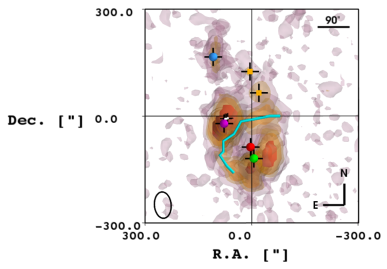
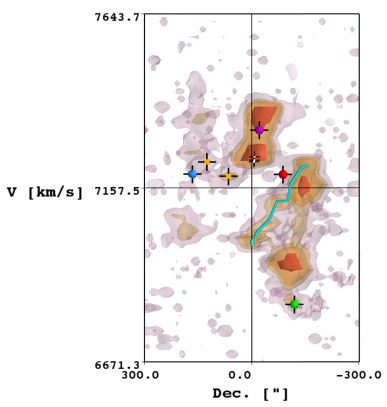
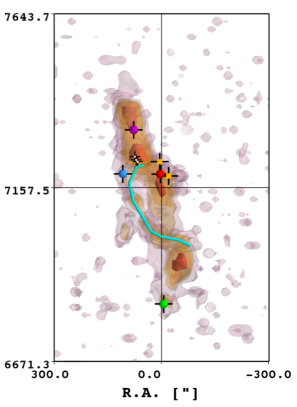
The datacube is in units of ([X]: arcsec; [Y]: arcsec; [v]: km s-1). A subset of the complete VLA cube, spanning 10 arcmin arcmin km s-1 and centered on HCG 91, is shown as a top-front-side projection triplet in Figure 3. Three semi-transparent and one opaque iso-contours are used to reveal the complex structure of the H I gas emission in this spatial-kinematic volume, alongside colored markers indicating the location of features of interest. In particular, the cyan line traces a tidal tail wrapping around the main group galaxy HCG 91a (marked by a green sphere) with a velocity extent of km s-1.
3.2. Creating X3D files
There exists many different software solutions to create X3D files given the central role that this data format is gaining on the World Wide Web scene for sharing 3-D graphics171717See e.g. http://www.web3d.org/x3d/content/examples/X3dResources.html#Applications. Here, we rely on the mayavi module in python (Ramachandran & Varoquaux, 2011) for three reasons.
First, the python programming language has been steadily growing in popularity within the Astrophysical community in recent years. A python solution to the problem of multi-dimensional data visualization will therefore be best suited to many astronomers. Second, mayavi offers a simple and rapid way to generate X3D files for non-experts with no a priori knowledge of the package. In particular, the mayavi syntax is extremely reminiscent of the popular matplotlib package (Hunter, 2007) dedicated to the creation of 2-D diagrams in python. Third, mayavi intrinsically provides an interactive view of the dataset without the need to export it first. In other words, mayavi is perfect to allow individual researchers to rapidly explore the content of a multi-dimensional dataset interactively and assess the need for and eventual benefit of additional forms of 3-D data visualization (e.g. in the form of interactive HTML documents) without having to implement them first. Detailed examples of the mayavi capabilities and associated syntax are accessible online181818 http://docs.enthought.com/mayavi/mayavi/auto/examples.html, to which we refer the interested reader for more information.
We do provide in the Github repository associated to this article the full python scripts used to generate the 3-D models of the green dice, red dice and H I datacube from the VLA (see Appendix A and DOI:10.5281/zenodo.31953). Figure 3 was generated using a slightly modified version of the latter script. We note that our examples do not explore the issue of mesh reduction or decimation, which may be required for specific models/structures before generating X3D files.
The ease of use of mayavi (and even more so for existing python users) is counter-balanced by specific drawbacks (e.g. the currently-imperfect underlying Visualization Toolkit (VTK) X3D exporter v0.9.1). Both the red dice and HCG 91 examples are specifically designed to hit the existing limitations of mayavi (see also Punzo et al., 2015), and offer possible solutions, including the creation of axes with ticks and labels, and/or the addition of a colorbar to the scene. The example scripts are clearly commented regarding these aspects, which we voluntarily do not discuss further in this article.
Punzo et al. (2015) presented a detailed comparison between mayavi and other software (paraview, 3dslicer and imagevis3D) with similar visualization capabilities (see also Taylor, 2015, regarding frelled). Among these, only paraview191919 http://www.paraview.org (Ahrens et al., 2005) is able to export models to the X3D file format. The yt project (Turk et al., 2011) represents another open-source alternative to mayavi to create X3D models.
3.3. From X3D to interactive HTML documents
The most straightforward application for X3D files (because of their design driver) is their inclusion in HTML documents on the World Wide Web. This article is not the first time that the use of the X3D file format for that specific purpose has been advocated in the field of Astrophysics. Fluke et al. (2009) already suggested the use of the X3D file format, in combination with a dedicated Flash plugin, for visualizing data products from the s2plot software (Barnes et al., 2006). However, the need for a specialized Flash plugin to access their interactive 3-D models on the web, albeit open-source, remained a negative factor affecting the expansion of this technology.
Fortunately, as part of the X3D version 4.0, full HTML5 support using the x3dom approach (Behr et al., 2009, 2010) is being implemented inside the X3D standard. In other words, interactive X3D models ought to be accessible directly (without the need for external plugins) by all web browsers in the near future. At the time of publication of this article, interactive 3-D models placed within HTML pages using the x3dom approach can already be loaded directly (without the need for any external plugins) with up-to-date versions of the firefox, chrome, safari and internet explorer web browsers that are webGL-enabled202020A detailed and up-to-date web browser compatibility list with the x3dom approach is available online: http://www.x3dom.org/?page_id=9.
The interactive HTML counterparts to Figures 2 and 3 are accessible using the respective DOIs: TBD and TBD. Software-wise, the creation of interactive HTML documents only requires a text editor to create the HTML script and a 3-D model as an X3D file.
For arXiv readers: the interactive diagrams are available here until publication: http://www.mso.anu.edu.au/fvogt/website/arXiv/ x3d/red_dice.html and http://www.mso.anu.edu.au/fvogt/ website/arXiv/x3d/HCG91.html .
We provide in the Github repository associated to this article a detailed walkthrough leading to the creation of the interactive HTML counterpart of Figures 2 and 3. The example HTML scripts also detail the creation of interaction buttons to set pre-defined views or display/hide specific datasets. Interaction buttons provide authors with an efficient tool to focus the reader’s attention to specific aspects of the interactive model without restricting the reader’s freedom to explore the content of the dataset. In the case of the H I gas location and kinematics in HCG 91 for example, the ability to show and/or hide different iso-contours can provide readers with a less obstructed view of the most intense H I emission around each galaxy. We note that our example scripts are applicable for the inclusion of any X3D model inside an HTML document, irrespective of the software used for their creation.
3.4. From X3D to 3-D printing
The concept of 3-D printing, formally known as additive manufacturing, has been recently suggested and used as a new way to share multi-dimensional datasets in Astrophysics (Steffen et al., 2014; Vogt et al., 2014; Madura et al., 2015). The emergence and increasing availability of reliable 3-D printers within universities and research institutes in recent years is facilitating researchers’ access to this technology, easing experimentation, and reducing the associated costs (both financially and time-wise).
Clearly, the concept of 3-D printing in Astrophysics is still in its infancy, and its future remains uncertain at this stage. The potential of 3-D printing at a professional level has been explored and discussed by Madura et al. (2015), who found that the technique can help better understand the structural content of complex numerical simulations. Using the physical model of a 3-D emission line ratio diagram created by Vogt et al. (2014), one of us also observed how 3-D printed diagrams can promote and facilitate “live” interactions and discussions around a complex dataset between researchers (e.g. in group meetings).
At the time of submission of this article, the most evident use for 3-D printing in Astrophysics most certainly lies within outreach activities. 3-D printed models provide a new pathway for researchers to share complex datasets and concepts with non-experts. Giving members of the general public the possibility to physically handle real astrophysical datasets enables them to use their kinaesthetic sense (and not solely their sight) to “visualize” astrophysical datasets in an un-precedented way. This diversification of senses used to “perceive” a given multi-dimensional dataset can lead to an improved understanding of its structure and of its associated parameters. The efforts undertaken at the Space Telescope Science Institute towards sharing Hubble images of the Universe with blind and vision-impaired members of the general public using 3-D printing are also particularly noteworthy (Christian et al., 2014).
Whichever future awaits 3-D printing technology in Astrophysics, the X3D pathway already provides astronomers with an efficient way to create 3-D printable models of 3-D diagrams. As a well-supported and well-defined 3-D data format, X3D models can be easily exported to specific file formats (e.g. STL) required by 3-D printers and associated software. For example, the conversion of an X3D file to an STL file can be achieved easily using the open-source software meshlab. Unlike for the creation of U3D files, transparency information and complex model trees are not required to be conserved inside STL files, so that meshlab offers a suitable solution in this case. For complex datasets, blender offers a significantly better way to convert 3-D diagrams from X3D to 3-D printable models while allowing the addition of support structures to hold free-floating elements.
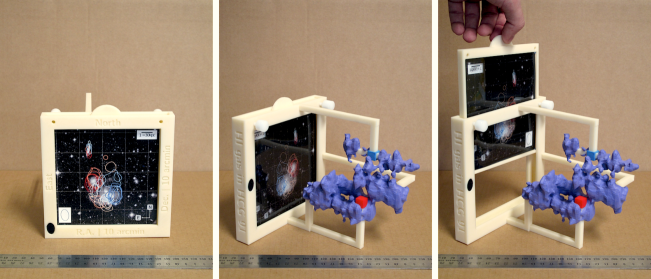
We have created a 3-D printable version of the H I gas distribution and kinematics in the compact group of galaxies HCG 91. Two demonstration prints (with a final model size of [15 cm 15 cm 19 cm] and [7.5 cm 7.5 cm 9.5 cm], respectively) were performed on the Fortus 400mc printer at the Research School of Astronomy and Astrophysics at the Australian National University. The larger print, after dissolution of the temporary support structures and manual reproduction of the color scheme of the model, is presented in Figure 4. The corresponding STL file (compatible with most 3-D printer currently available on the market) and the blender file used for the X3D to STL conversion process are both included in the Github repository associated to this article.
3.5. From X3D to high-end animations
Movies and animations have long been used in Astrophysics to share the content of multi-dimensional datasets, where time is being added as an extra-dimension to a given 2-D diagram. Generally speaking, movies consist in a series of still frames (e.g. PNGs) that are stacked together into an animation, for example using the open-source and polyvalent ffmpeg software. Certainly, the creation of PNGs does not require the prior creation of an X3D model, and can be achieved either using 2-D or 3-D plotting solutions with direct export to still PNGs, as illustrated in Figure 1.
In this Section, we specifically explore the possibility of implementing high-end animations of 3-D diagrams exported as X3D models using blender. blender is a free, open source, multi-platform (Windows, Mac, GNU/Linux) 3-D graphics and animation software package212121http://www.blender.org. The reader is referred to Kent (2013, 2015) for a thorough description of the software in the context of astrophysical data visualization.
blender is implemented with a python 3 application programming interface (API) which includes a built-in terminal and text windows for internal scripting, and the ability to write and execute external scripts without invoking the blender graphical user interface (GUI). This python API contains several major packages by default (e.g. numpy) and the ability to install additional external packages. For the large (and growing) fraction of astronomers already familiar with python, blender can be thought of as a new external visualization package. blender also supports the X3D file format by default.
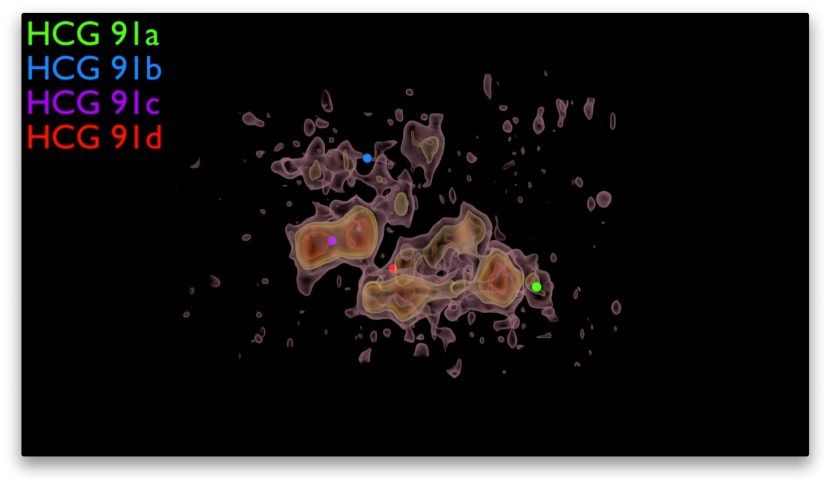
As a dedicated open-source 3-D creation suite software supporting “modelling, rigging, animation, simulation, rendering, compositing, motion tracking, video editing and game creation”222222 http://www.blender.org/about/, the number of options available for presentation and animation of X3D meshes in blender is extremely large. The many capabilities of this software lie at the core of its steep learning curve, so that using blender for the first time may appear as a formidable task. To ease the process and facilitate the first-time use of blender, we provide in the Github repository associated to this article annotated python scripts which automatically import X3D files generated using mayavi (see Section 3.2) and produce high quality ready-to-render animations. One final rendered movie frame is presented in Figure 5 for completeness.
We note that our example scripts only explore a very limited number of features of blender. We also include in the Github repository associated with this article a second animation of the VLA datacube generated using a more complex version of the HCG91_animation.py script (available on demand) to illustrate some additional features of blender. For more extensive examples and tutorials on how to use blender with astrophysical datasets (including different ways to import the data and by-passing the X3D file format altogether), we refer the interested reader to the astroblend project 232323 http://www.astroblend.com.
4. Conclusions
Most datasets in modern Astrophysics are multi-dimensional. Yet, despite a largely electronic publishing landscape, their visualization and publication in dedicated articles remains problematic. Here, we have introduced the concept of the X3D pathway as a new approach to the creation, visualization and publication of 3-D diagrams in scientific articles. The fact that the X3D open-source (and ISO standard) 3-D file format lies at the center of an advanced data visualization product tree that includes interactive HTML documents, 3-D printing, high-end animations (and possibly interactive PDF documents) forms the core of the X3D pathway.
The X3D pathway is designed to be “file format-dependant” rather than “software-dependant”, so that it is less prone to rapid and un-anticipated changes and evolution. In particular, although the X3D standard is not immune to any evolution, such evolution will always be slower than that of associated software. Backwards compatibility is also a core characteristic of the X3D standard. We note that the evolution of the X3D standard can be directly influenced by official working groups. As such, the hypothetical creation of a dedicated Astronomy and Astrophysics Web3D working group to promote and develop new X3D specifications for our field appears as an enticing idea.
The interactive HTML branch of the X3D pathway is actively supported by leading peer-reviewed journals within the field of Astrophysics. From this perspective, we believe that the X3D pathway has already evolved beyond an “experimental” status. The future of the 3-D printing branch remains to be defined at this stage, but the possibility of rapidly creating 3-D printable models from existing X3D files ought to allow and facilitate additional experimentation with this technology. Finally, the X3D file format also provides “regular” astronomers the means to implement scientifically accurate and visually compelling movies and animations to communicate the complex, multi-dimensional content of their datasets.
It has become increasingly evident that the large volume of modern multi-dimensional astrophysical datasets - either theoretical simulations or data products from existing/forthcoming observing facilities (e.g. the SKA) - require innovative alternatives to 2-D diagrams for their visualization and publication. We strongly believe that tackling this issue requires to move the focus away from specific software, and direct the discussion towards file formats. Here, we propose that the X3D pathway offers a viable framework to develop alternative visualization techniques (such as interactive HTML documents) while providing a single entry point connecting a growing range of advanced data visualization solutions.
The detailed examples included in the Github repository associated to this article demonstrate the current possibilities (and existing limitations) offered by the X3D pathway in terms of data visualization, and provide the interested readers with the means of testing and implementing the X3D pathway with their own datasets. As a complete and new framework for multi-dimensional data visualization, we believe that the X3D pathway also provides a useful reference and comparison point (in terms of capabilities, limitations and flexibility) for ongoing efforts and future propositions regarding the visualization and publication of complex multi-dimensional datasets.
References
- Ahrens et al. (2005) Ahrens, James, Geveci, et al. 2005, ParaView: An End-User Tool for large Data Visualization (Visualization Handbook, Elsevier)
- Astropy Collaboration et al. (2013) Astropy Collaboration, Robitaille, T. P., Tollerud, E. J., et al. 2013, A&A, 558, A33
- Barnes & Fluke (2008) Barnes, D. G., & Fluke, C. J. 2008, New A, 13, 599
- Barnes et al. (2006) Barnes, D. G., Fluke, C. J., Bourke, P. D., & Parry, O. T. 2006, PASA, 23, 82
- Behr et al. (2009) Behr, J., Eschler, P., Jung, Y., & Zöllner, M. 2009, in Proceedings of the 14th International Conference on 3D Web Technology, Web3D ’09 (New York, NY, USA: ACM), 127–135
- Behr et al. (2010) Behr, J., Jung, Y., Keil, J., et al. 2010, in Proceedings of the 15th International Conference on Web 3D Technology, Web3D ’10 (New York, NY, USA: ACM), 185–194
- Bouché et al. (2015) Bouché, N., Carfantan, H., Schroetter, I., Michel-Dansac, L., & Contini, T. 2015, ArXiv e-prints
- Christian et al. (2014) Christian, C. A., Nota, A., Grice, N. A., et al. 2014, in American Astronomical Society Meeting Abstracts, Vol. 223, American Astronomical Society Meeting Abstracts #223, 244.16
- Daly & Brutzman (2007) Daly, L., & Brutzman, D. 2007, IEEE Signal Processing Magazine, 24, 130
- Fluke et al. (2009) Fluke, C. J., Barnes, D. G., & Jones, N. T. 2009, PASA, 26, 37
- Goodman et al. (2015) Goodman, A., Pepe, A., Blocker, A. W., et al. 2015, 10 Simple Rules for the Care and Feeding of Scientific Data, accessed: 2015-04-27
- Hettne et al. (2012) Hettne, K., Wolstencroft, K., Belhajjame, K., et al. 2012, Semantic Web Applications and Tools for Life Sciences, 952, accessed: 2015-06-12
- Hettne et al. (2013) Hettne, K. M., Dharuri, H., Zhao, J., et al. 2013, ArXiv e-prints
- Hickson (1982) Hickson, P. 1982, ApJ, 255, 382
- Hunter (2007) Hunter, J. D. 2007, Computing In Science & Engineering, 9, 90
- Kent (2013) Kent, B. R. 2013, PASP, 125, 731
- Kent (2015) Kent, B. R. 2015, 3D Scientific Visualization with Blender®, 2053-2571 (Morgan & Claypool Publishers)
- Madura et al. (2015) Madura, T. I., Clementel, N., Gull, T. R., Kruip, C. J. H., & Paardekooper, J.-P. 2015, ArXiv e-prints
- Miki et al. (2014) Miki, Y., Mori, M., Kawaguchi, T., & Saito, Y. 2014, ApJ, 783, 87
- Punzo et al. (2015) Punzo, D., van der Hulst, J. M., Roerdink, J. B. T. M., et al. 2015, ArXiv e-prints
- Putman et al. (2012) Putman, M. E., Peek, J. E. G., & Joung, M. R. 2012, ARA&A, 50, 491
- Ramachandran & Varoquaux (2011) Ramachandran, P., & Varoquaux, G. 2011, Computing in Science & Engineering, 13, 40
- Springob et al. (2012) Springob, C. M., Magoulas, C., Proctor, R., et al. 2012, MNRAS, 420, 2773
- Springob et al. (2014) Springob, C. M., Magoulas, C., Colless, M., et al. 2014, MNRAS, 445, 2677
- Steffen et al. (2014) Steffen, W., Teodoro, M., Madura, T. I., et al. 2014, MNRAS, 442, 3316
- Taylor (2015) Taylor, R. 2015, ArXiv e-prints
- Turk et al. (2011) Turk, M. J., Smith, B. D., Oishi, J. S., et al. 2011, ApJS, 192, 9
- Verdes-Montenegro et al. (2001) Verdes-Montenegro, L., Yun, M. S., Williams, B. A., et al. 2001, A&A, 377, 812
- Vogt & Wagner (2012) Vogt, F., & Wagner, A. Y. 2012, Ap&SS, 337, 79
- Vogt (2015) Vogt, F. P. 2015, x3d-pathway: Pre-release: arXiv submission
- Vogt et al. (2015) Vogt, F. P. A., Dopita, M. A., Borthakur, S., et al. 2015, MNRAS, 450, 2593
- Vogt et al. (2014) Vogt, F. P. A., Dopita, M. A., Kewley, L. J., et al. 2014, ApJ, 793, 127
- Vogt & Shingles (2013) Vogt, F. P. A., & Shingles, L. J. 2013, Ap&SS, 347, 47
Appendix A Structure & content of the Github repository associated to this article
We include in a dedicated Github repository (see https://github.com/fpavogt/x3d-pathway, and/or DOI:10.5281/zenodo.31953) a series of scripts, data files and instruction sets (released as free software under the GNU General Public License version 3) designed to provide a stepping stone for the reader interested in implementing the X3D pathway. As an example, some of these scripts aided in the creation of the interactive counterpart to Figure 3(c) in Bouché et al. (2015).
A global overview of the structure and content of Github repository (at the time of publication of this article) is provided in Figure 6. The material is divided in four sections dedicated to the creation of X3D files, the creation of interactive HTML documents, the creation of high-end animations and 3-D printing. The scripts described in this article are contained in the release v0.9 associated with this Github directory. All scripts provided are commented in detail to help in their understanding.
The different examples build on one another: for example, the X3D files created using the python scripts are used as input material for the HTML visualization scripts. Included are three examples of incremental complexity. The “green dice” examples (green_dice.py, green_dice.html and green_dice_animation.py) are the most basic. The red dice examples were designed to hit some of the limitations associated with mayavi to export X3D files. The third set of examples (HCG91.py, HCG91.html and HCG91_animation.py) are the most complex, and do not shy away from the additional intricacies associated with visualizing real astrophysical datasets, including the use of World Coordinate System units.