Resonance Retrieval of Stored Coherence in a Radiofrequency-optical Double Resonance Experiment
Abstract
We study the storage of coherences in atomic rubidium vapor with a three-level coupling scheme with two ground states and one electronically excited state driven by one optical (control) and one radiofrequency field. We initially store an atomic ground state coherence in the system. When retrieving the atomic coherence with a subsequent optical pulse, a second (signal) optical beam is created whose difference frequency to the control field is found to be determined by the atomic ground states Raman transition frequency.
pacs:
42.50.Gy, 03.65.-w, 06.20.-f, 07.55.GeIn the past decades quantum coherence effects have been a topic of intense scientific research. Light-matter interactions that induce coherent effects have a remarkable capability of being able to alter optical properties of atomic media. Of crucial importance in many fields, e.g. in quantum information, is the ability to coherently manipulate atomic states and retrieve previously mapped photon states. Electromagnetically induced transparency (EIT) M.Fleischhauer et al. (2005) and coherent population trapping Alzetta et al. (1976) are widely used tools that allow for reversible storage of light in atomic ensembles Liu et al. (2001); Phillips et al. (2001), where stored photonic information can be controlled in a coherent manner Mair et al. (2002). Based on the EIT effect, it has been reported that non-classical states of light, like squeezed and single-photon states, have been reversibly stored in atomic ensembles Appel et al. (2008); Eisaman et al. (2005); Honda et al. (2008). Application of EIT in quantum devices and generation of photonic qubits has also been proposed Chaneliere et al. (2005); Vewinger et al. (2007). Besides the EIT phenomenon, many different storage techniques have been proposed, such as off-resonant Raman interaction Nunn et al. (2007) or gradient echo memories (GEM) Alexander et al. (2006) schemes in both gaseous atomic samples Nunn et al. (2008); Hétet et al. (2008) and ion-doped crystals Nilsson and Kröll (2005). The possibility to prepare narrow resonances using EIT Brandt et al. (1997); Budker et al. (1998) makes it a valuable tool for magnetometry Scully and Fleischhauer (1992); Katsoprinakis et al. (2006); Shah et al. (2007) and optical clocks. State-of-the-art magnetometry that surpasses the precision of superconducting quantum interference devices has been reported Kominis et al. (2003). Of furhter interest is the application of coherent population trapping in the measurement of the frequency difference between two hyperfine atomic states allowing for miniature atomic clocks Vanier (2005); Knappe et al. (2005). While many experiments use continuous signal read out, other work has used free spin precessing for atomic magnetometry, resulting in a Ramsey-like scheme Grujić et al. (2015).
In the present manuscript, we examine the eigenfrequency of the retrieved atomic coherence following initial storage of coherence, inspired by light storage experiments in dark state media Phillips et al. (2001). In previous works using light storage we have demonstrated that the difference frequency of the regenerated signal beam to the control beam used for storage oscillated at an atomic eigenfrequency Karpa et al. (2008, 2009). It is well known that atomic ground state coherences can be created also in an optical-radiofrequency double resonance configuration He et al. (1992). Here, we demonstrate resonance retrieval of atomic coherence in an optical-radiofrequency double resonance experiment. Our experiment uses an atomic three-level system, and the setup is based on hot atomic rubidium vapor used for the storage. After the retrieval of the stored coherence, a beating that matches the energy difference between the two ground levels is observed. Within our experimental uncertainty, the observed beat frequency is insensitive to a wide range of variations of both the drive frequency and the amplitude of the radiofrequency (rf) field. The observed effect is robust with respect to variations of the Rabi frequencies of both optical control and rf fields.
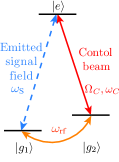
For a simple model of our experimental method, consider an ensemble of three-level atoms as depicted in Fig. 1 with two stable ground states , and one electronically excited state that is spontaneously decaying. The transition between the states and is coupled coherently via the optical control laser beam with Rabi frequency , while the rf field at frequency couples the ground levels and . Without the presence of the rf coupling, the system is pumped into the ground state . Adding of the rf field coupling creates a coherence among ground levels and together with the simultaneous driving of the optical transition induces coherence between levels and , that in turn produces a coherent optical signal field collinear with the control laser beam. During the rf excitation of the system, the generated signal field beats with the transmitted laser field at the frequency . We show that after the simultaneous switching off of the optical and rf excitation fields, and the later resonant retrieval of the stored coherence, the retrieved light beats at the difference frequency of the ground state levels .
In our experimental apparatus (Fig. 2) a grating stabilized diode laser is used as a source of the optical control beam. The diode laser is locked with dichroic atomic vapor laser lock procedure Yashchuk et al. (2000) to the (see Fig. 3) hyperfine component of the rubidium D1 line near 795 nm. Its emission passes an acousto-optic modulator, is spatially filtered with a fiber, and then with linear polarization sent to a magnetically shielded 50 mm long rubidium buffer gas cell. The cell itself contains 1 Torr xenon buffer gas and is heated up to C, resulting in a rubidium atom number density of . To lift the degeneracy of the Zeeman sublevels of the ground state, a magnetic bias field is applied in a direction parallel to the control beam polarization.
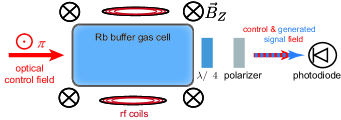
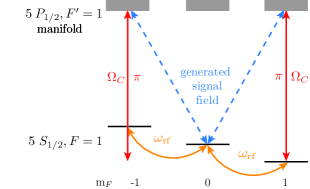
The splitting between the adjacent Zeeman sublevels of the ground state is , where is the Bohr magneton, and the hyperfine factor equals 1/2. In our experimentally used level scheme, the ground state sublevels and correspond to the states and of the three-level model presented in the Fig. 1 respectively, and of the electromagnetically excited state to . The -polarized optical field drives the transition to , whereas the generated signal beam is polarized and tuned near the to transition. The rf field coherently couples the Zeeman states of the ground state manifold. This field is generated by a radio-frequency antenna mounted close to the rubidium cell. In the absence of a radiofrequency field, the linearly polarized control field pumps the atomic population into the ground state sublevel. After leaving the rubidium cell, the control field and the generated signal field are projected onto the same polarization using a polarizer and the resulting beat signal between the two fields is detected using a fast photodiode. The amplitude of the detected beat signal can be adjusted by a mounted wave plate in front of the polarizer.
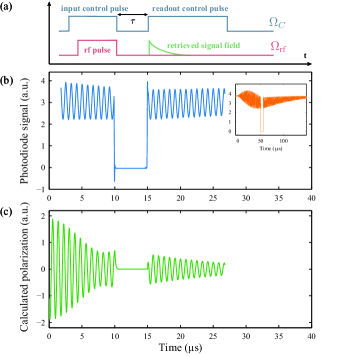
The control laser power was on a 5 mm beam diameter typically set to 200 W. The frequency of the applied radiofrequency was tuned to the Zeeman splitting between adjacent Zeeman sublevels near 1.2 MHz at the used level of the magnetic bias field, and the Rabi frequency of the rf field was approximately kHz. Our experimental cycle, see Fig. 4(a), begins by initially activating the linearly polarized control laser beam, so that population is pumped into the component of the electronic ground state. We then in addition activate the resonant radiofrequency pulse which creates an atomic ground state coherence, after which the optical control field and the radiofrequency field are simultaneously turned off. After a 5 s long period with no external driving fields applied, only the control field is reactivated, which retrieves the stored coherence and causes emission of a signal beam pulse Oberst et al. (2007). This beam is generated by the coherence oscillating at the to transition of the simplified level scheme of Fig. 1, or to of the full level scheme (Fig. 3), and upon reactivating the control beam emission of a second optical beam collinear to the control beam is possible. The blue line in Fig. 4(b) shows typical experimental data for the observed beat signal between the control and the signal beam. Fig. 4(b) shows that a beat signal, as understood from emission of a signal field, is not only present during the retrieval of the coherence, but also during the preparation stage, where both the radiofrequency field and the control beam are active. As in that phase we deal with a driven system, we expect that before the storage the beat frequency will be determined by the frequency of the rf field, which in the presence of a finite detuning differs from the atomic eigenfrequency. The frequency of the detected beat, both during the rf pulse and after the coherent retrieval, was determined by fitting the signal with a sinusoidal function.
To allow for a comparison with expected results, we have carried out numerical simulations of our system using time-dependent density matrix calculations. In the simulations, a 6 level system, corresponding to the ground and excited states of the experimentally used transition, was considered. The time evolution of the density matrix is calculated by using the Liouville equation:
| (1) |
where H is the Hamiltonian of the system that includes interactions with the optical control field, the external DC magnetic field and the rf field. The superoperator incorporates both a dephasing rate and population relaxation rate in a phenomenological way. For the decoherence rate of our Rb buffer gas system, in the calculations we used the experimental value derived from EIT resonance measurements, as in Figueroa et al. (2006). To mimic the experimentally existing population losses from the excited hyperfine level to the level , one additional element of the density matrix is introduced phenomenologically. As usual, the diagonal elements of the density matrix give the population of the states, while off-diagonal elements can be used to calculate the complex polarization of the medium M.Fleischhauer et al. (2005). A typical result is shown in Fig. 4(c), for parameters corresponding to the experimental settings.
In our experiments, we have detected the beat signal of control and generated optical signal beam for different values of both the magnetic bias field and the frequency of the rf coupling. When the magnetic bias field was varied, the frequency of the rf field was kept constant and vice versa. Typical data for the shift in the beat frequency after the resonance retrieval, as a function of the bias field and the frequency of the rf field is shown by orange dots and blue squares in Fig. 5(a). Here, the variable magnetic bias field is expressed in terms of Zeeman splitting of two neighboring ground states. Both parameters were scanned for the same frequency range, and each shown data point represents the averaged value for ten different measurements. These two data sets are fitted by a linear function, showing the linear dependence of the beat frequency on the size of the Zeeman splitting (Fig. 5(a) solid orange line) with a slope of . Within our experimental accuracy the beat frequency between optical control and generated signal fields thus equals the separation of adjacent Zeeman components of the hyperfine ground state.
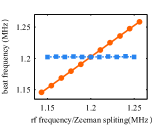
The data points corresponding to different values of the frequency of the rf field can well be described by linear behavior (Fig. 5(a) blue dashed line) with a slope of that vanishes within the experimental uncertainty, which is consistent with the assumption that the frequency of the rf coupling not having a noticeable influence on the value of the retrieved beat frequency. As expected, during the rf excitation, the difference of the detected beat frequency is given by when varying either magnetic bias field or the rf frequency.
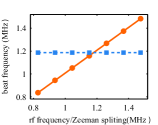
Fig. 4(c) shows calculated results for the coherences between the states , where the eigenfrequency was measured with respect to the frequency of the optical control field. The corresponding polarization is responsible for the emission of the signal beam, and the shown oscillation is to serve as a numerical estimation of the expected time-dependence of the experimentally observed beat between signal and control optical fields respectively. Fig 5(b) shows the corresponding calculated values of the oscillation frequency of the atomic polarization with respect to the control field frequency, versus the frequency of the rf field (blue squares) and the frequency splitting between adjacent Zeeman sublevels (orange dots). For determination of the corresponding frequency from the numerical values for the polarization, a Fast Fourier transform procedure, implemented in a MATLAB environment, was used. The calculated results are in good agreement with the corresponding experimental observation (Fig. 4(b) and Fig. 5(a)). The experimentally measurable beat frequency range is several times smaller than the frequency range acquired by simulations, which is attributed to the experimentally limited detection sensitivity.
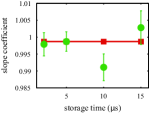
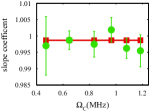
We have also investigated the resonance retrieval effect for different storage times of the atomic coherence. The green dots in Fig. 5(c) show the measured slope of the observed beat signal upon variation of the Zeeman splitting between adjacent sublevels versus the storage time, and within experimental uncertainties no deviation from the expected value unity is observed. In red, results of the numerically calculated dependence is shown. Finally, we tested for the robustness of the effects by performing measurements for different intensities of the optical control field. Fig. 5(d) shows the observed (green dots) slope of the beat frequency upon variation of the Zeeman splitting versus the control field Rabi frequency, and in red results of a corresponding calculation are shown. For the used parameter range, within experimental uncertainties no frequency shift from the ac Stark shift was observed. Similarly, within experimental uncertain no dependence on the retrieved frequency difference was observed when varying the Rabi frequency of the rf field up to approximately a level of kHz.
To conclude, we have investigated the storage of atomic coherence in a thermal vapor of rubidium atoms by an optical control field, and a radiofrequency field, followed by its coherent resonant retrieval. We observe that independently of the used frequency for storage, the difference frequency between the retrieved optical signal field and the control field matches the atomic ground state difference frequency. This is attributed to the atomic coherence in the absence of driving oscillating at an atomic eigenfrequency, i.e. that only phase (and amplitude), but no frequency information is stored. The here investigated optical-rf excitation scheme represents an experimental simplification with respect to schemes based on driving the atomic ensemble with different optical driving fields. Both our experimental and theoretical results demonstrate that the retrieved difference frequency in good accuracy is solely determined by the Zeeman splitting of atomic ground state sublevels. It is to be assumed that our experimental procedure can be used in measurements of the atomic transition frequencies without precise knowledge of the driving frequencies. Our results hold prospects for the development of simple and robust atomic clocks. Prospective applications in atomic magnetometry are also anticipated.
We acknowledge funding by the Deutsche Forschungsgemeinschaft (We 1748-11).
References
- M.Fleischhauer et al. (2005) M.Fleischhauer, A.Imamoglu, and J. P. Marangos, Rev. Mod.Phys 77, 633 (2005).
- Alzetta et al. (1976) G. Alzetta, A. Gozzini, L. Moi, and G. Orriols, Il Nuovo Cimento B (1971-1996) 36, 5 (1976).
- Liu et al. (2001) C. Liu, Z. Dutton, C. H. Behroozi, and L. V. Hau, Nature (London) 409, 490 (2001).
- Phillips et al. (2001) D. F. Phillips, A. Fleischhauer, A. Mair, R. L. Walsworth, and M. D. Lukin, Phys. Rev. Lett. 86, 783 (2001).
- Mair et al. (2002) A. Mair, J. Hager, D. F. Phillips, R. L. Walsworth, and M. D. Lukin, Phys. Rev. A 65, 031802 (2002).
- Appel et al. (2008) J. Appel, E. Figueroa, D. Korystov, M. Lobino, and A. I. Lvovsky, Phys. Rev. Lett. 100, 093602 (2008).
- Eisaman et al. (2005) M. D. Eisaman, A. Andre, F. Massou, M. Fleischhauer, A. S. Zibrov, and M. D. Lukin, Nature (London) 438, 837 (2005).
- Honda et al. (2008) K. Honda, D. Akamatsu, M. Arikawa, Y. Yokoi, K. Akiba, S. Nagatsuka, T. Tanimura, A. Furusawa, and M. Kozuma, Phys. Rev. Lett. 100, 093601 (2008).
- Chaneliere et al. (2005) T. Chaneliere, D. N. Matsukevich, S. D. Jenkins, S.-Y. Lan, T. A. B. Kennedy, and A. Kuzmich, Nature (London) 438, 833 (2005).
- Vewinger et al. (2007) F. Vewinger, J. Appel, E. Figueroa, and A. I. Lvovsky, Opt. Lett. 32, 2771 (2007).
- Nunn et al. (2007) J. Nunn, I. A. Walmsley, M. G. Raymer, K. Surmacz, F. C. Waldermann, Z. Wang, and D. Jaksch, Phys. Rev. A 75, 011401 (2007).
- Alexander et al. (2006) A. L. Alexander, J. J. Longdell, M. J. Sellars, and N. B. Manson, Phys. Rev. Lett. 96, 043602 (2006).
- Nunn et al. (2008) J. Nunn, K. Reim, K. C. Lee, V. O. Lorenz, B. J. Sussman, I. A. Walmsley, and D. Jaksch, Phys. Rev. Lett. 101, 260502 (2008).
- Hétet et al. (2008) G. Hétet, M. Hosseini, B. M. Sparkes, D. Oblak, P. K. Lam, and B. C. Buchler, Opt. Lett. 33, 2323 (2008).
- Nilsson and Kröll (2005) M. Nilsson and S. Kröll, Optics Communications 247, 393 (2005).
- Brandt et al. (1997) S. Brandt, A. Nagel, R. Wynands, and D. Meschede, Phys. Rev. A 56, R1063 (1997).
- Budker et al. (1998) D. Budker, V. Yashchuk, and M. Zolotorev, Phys. Rev. Lett. 81, 5788 (1998).
- Scully and Fleischhauer (1992) M. O. Scully and M. Fleischhauer, Phys. Rev. Lett. 69, 1360 (1992).
- Katsoprinakis et al. (2006) G. Katsoprinakis, D. Petrosyan, and I. K. Kominis, Phys. Rev. Lett. 97, 230801 (2006).
- Shah et al. (2007) V. Shah, S. Knappe, S. D. Jenkins, P. D. D. Schwindt, and J. Kitching, Nature Photonics 1, 649 (2007).
- Kominis et al. (2003) I. K. Kominis, T. W. Kornack, J. C. Allred, and M. V. Romalis, Nature (London) 422, 596 (2003).
- Vanier (2005) J. Vanier, Applied Physics B 81, 421 (2005).
- Knappe et al. (2005) S. Knappe, P. Schwindt, V. Shah, L. Hollberg, J. Kitching, L. Liew, and J. Moreland, Opt. Express 13, 1249 (2005).
- Grujić et al. (2015) Z. Grujić, P. Koss, G. Bison, and A. Weis, The European Physical Journal D 69, 135 (2015), 10.1140/epjd/e2015-50875-3.
- Karpa et al. (2008) L. Karpa, F. Vewinger, and M. Weitz, Phys. Rev. Lett. 101, 170406 (2008).
- Karpa et al. (2009) L. Karpa, G. Nikoghosyan, F. Vewinger, M. Fleischhauer, and M. Weitz, Phys. Rev. Lett. 103, 093601 (2009).
- He et al. (1992) X.-F. He, P. T. Fisk, and N. B. Manson, Journal of Luminescence 53, 68 (1992).
- Yashchuk et al. (2000) V. V. Yashchuk, D. Budker, and J. R. Davis, Review of Scientific Instruments 71 (2000).
- Oberst et al. (2007) M. Oberst, F. Vewinger, and A. I. Lvovsky, Opt. Lett. 32, 1755 (2007).
- Figueroa et al. (2006) E. Figueroa, F. Vewinger, J. Appel, and A. I. Lvovsky, Opt. Lett. 31, 2625 (2006).