Unveiling a Rich System of Faint Dwarf Galaxies in the Next Generation Fornax Survey
Abstract
We report the discovery of 158 previously undetected dwarf galaxies in the Fornax cluster central regions using a deep coadded and -band image obtained with the DECam wide-field camera mounted on the 4-meter Blanco telescope at the Cerro Tololo Interamerican Observatory as part of the Next Generation Fornax Survey (NGFS). The new dwarf galaxies have quasi-exponential light profiles, effective radii kpc and average effective surface brightness values mag arcsec-2. We confirm the existence of ultra-diffuse galaxies (UDGs) in the Fornax core regions that resemble counterparts recently discovered in the Virgo and Coma galaxy clusters. We also find extremely low surface brightness NGFS dwarfs, which are several magnitudes fainter than the classical UDGs. The faintest dwarf candidate in our NGFS sample has an absolute magnitude of mag. The nucleation fraction of the NGFS dwarf galaxy sample appears to decrease as a function of their total luminosity, reaching from a nucleation fraction of at luminosities brighter than mag to at luminosities fainter than mag. The two-point correlation function analysis of the NGFS dwarf sample shows an excess on length scales below kpc, pointing to the clustering of dwarf galaxies in the Fornax cluster core.
Subject headings:
galaxies: clusters: individual (Fornax) — galaxies: dwarf — galaxies: elliptical and lenticular, cD1. Introduction
The Fornax cluster is the most nearby southern galaxy overdensity and an excellent laboratory for studying the formation and evolution of galaxies and other dense stellar systems, such as globular clusters (GCs) and dwarf galaxies. In comparison to its northern counterpart, the Virgo galaxy cluster, the Fornax cluster has twice the central galaxy density, half the velocity dispersion, and a distinctly lower mass (, e.g. Schuberth et al., 2010). Furthermore, the core of Fornax is dynamically more evolved (Churazov et al., 2008) and its early-type galaxy fraction is significantly larger than that of Virgo. Overall, these properties make the Fornax cluster an excellent target for studies of galaxy evolution processes in dense cluster environments.
Probing deeper into the galaxy luminosity function allows us to put more stringent constraints on galaxy formation models (e.g. Bovill & Ricotti, 2009, 2011a, 2011b; Brooks et al., 2011; Pfeffer et al., 2014; Vogelsberger et al., 2014; Mistani et al., 2015; Burkert, 2015). In addition to the rich populations of low-surface brightness dwarf galaxies in the Local Volume (McConnachie, 2012), there have been recent and surprising discoveries of ultra-diffuse galaxies (UDGs) in the Coma and Virgo galaxy clusters (van Dokkum et al., 2015; Koda et al., 2015; Mihos et al., 2015). The extremely low stellar masses of UDGs () combined with their large radii () translate into very low surface brightness values in the range mag arcsec-2, making them extremely difficult to detect. The existence of this mysterious new dwarf galaxy class in dense galaxy cluster environments prompts the obvious question of whether there might be similar populations in other galaxy clusters. In this letter we use multi-passband, wide-field observations conducted by us with the Dark Energy Camera (DECam, Flaugher et al., 2015) at the 4-meter Blanco telescope at Cerro Tololo Interamerican Observatory as part of The Next Generation Fornax Survey (NGFS) to search for faint dwarf galaxies in the Fornax galaxy cluster central regions ( kpc) and measure their structural parameters and spatial distribution.
Throughout this work, we adopt a Fornax distance modulus of mag ( Mpc) based on the surface-brightness fluctuations method from Blakeslee et al. (2009).
| ID | aaAssuming a distance modulus of mag (Blakeslee et al., 2009). | bbSérsic index (Sérsic, 1968; Caon et al., 1993). | aaAssuming a distance modulus of mag (Blakeslee et al., 2009). | TypeccMorphological galaxy type classification: =nucleated, =non-nucleated dwarf galaxy. | Reference | ||||
|---|---|---|---|---|---|---|---|---|---|
| [mag] | [mag] | [arcsec] | [kpc] | ||||||
| NGFS033301-353635 | 03:33:00.83 | 35:36:34.59 | 17.70 | 13.81 | 0.89 | 5.397 | 0.523 | ||
| NGFS033309-352349 | 03:33:08.63 | 35:23:49.02 | 19.18 | 12.33 | 0.81 | 7.088 | 0.687 | FCC114 | |
| NGFS033311-353956 | 03:33:10.93 | 35:39:56.17 | 20.56 | 10.95 | 0.63 | 8.950 | 0.868 | ||
| NGFS033316-353551 | 03:33:15.98 | 35:35:50.90 | 21.00 | 10.51 | 0.69 | 2.554 | 0.248 | ||
| NGFS033322-353620 | 03:33:22.18 | 35:36:20.20 | 18.70 | 12.81 | 0.88 | 4.439 | 0.430 | ||
| NGFS033331-352654 | 03:33:31.41 | 35:26:54.00 | 22.74 | 8.77 | 0.47 | 2.427 | 0.235 | ||
| NGFS033332-353942 | 03:33:32.11 | 35:39:42.21 | 19.86 | 11.65 | 1.00 | 8.258 | 0.801 |
Note. — Table 1 is published in its entirety in the electronic edition of the Astrophysical Journal. A portion is shown here for guidance regarding its form and content.
2. Observations and Image Processing
The Next Generation Fornax Survey (NGFS) is an ongoing multi-wavelength survey of the central 30 deg2 of the Fornax galaxy cluster (Ferguson, 1989). We are using Blanco/DECam for doing near-ultraviolet (NUV) and optical photometry as well as VISTA/VIRCam (Sutherland et al., 2015) for doing near-infrared (NIR) photometry of the same field. The NGFS survey is aimed at detecting point-sources at S/N=5 over the PSF area with , and AB mag. Below we offer a summary of the NGFS features most salient for this letter, and defer a detailed description of the characteristics and data reduction to a subsequent paper.
The current NGFS mosaic consists of nine contiguous tiles, and the present work is based on the optical imaging of the central tile. Our dithering pattern is based on the Elixir-LSB technique developed by Jean-Charles Cuillandre for the Next Generation Virgo Survey (NGVS; see Ferrarese et al., 2012), which is designed to detect low-surface brightness structures. The raw images were processed by the DECam Community Pipeline (v2.5.0), including bias calibration, crosstalk correction, linearity correction, flat fielding and gain calibration. We apply our own sky background subtraction and stacking recipes via an iterative procedure of object masking and sky modelling using the Astromatic software111http://www.astromatic.net/software (Sextractor v2.19.5, Scamp v2.0.1 and Swarp v2.38.0). Our astrometric and photometric calibrations are based on 2MASS Point Source Catalog (Skrutskie et al., 2006) reference stars and Sloan Digital Sky Survey stripe 82 standard star frames taken under photometric conditions, respectively.
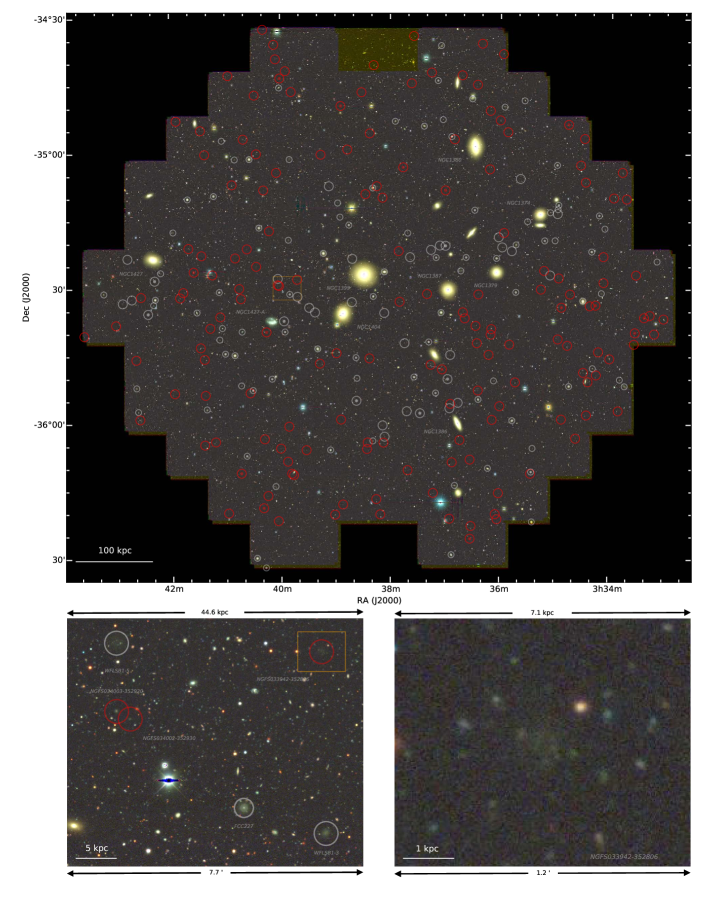
In this letter we present the analysis of the central 3 deg2 (Figure 1), covering the Fornax cluster core out to kpc radius from NGC 1399, corresponding to 25% of the Fornax cluster virial radius (1.4 Mpc; Drinkwater et al., 2001). We created a RGB image from the processed images, which was visually inspected by several of us (RPM, PE, THP, YO, KAM, KXR) to independently identify low-surface brightness dwarf galaxy candidates. Table 1 includes 284 dwarf galaxy candidates that were identified by every person on the search team, 264 of which we derived structural parameters for by analyzing their surface brightness profiles (see §3).
We compared our sample with objects flagged as “likely members” in the FCC catalogue (Ferguson, 1989), finding 92 matches with a maximum separation of . Out of these galaxies, there are 47 matched non-nucleated and 45 nucleated dwarfs. We also find 27 non-nucleated and 7 nucleated dwarfs not present in the FCC catalogue, but flagged as likely members in the Mieske et al. (2007) catalogue. We fail to recover 6 objects from the Mieske et al. catalogue, which we visually confirm from Figure 1 to be background galaxies.
3. Structural parameters of the dwarf candidates
We estimate the structural parameters of each dwarf candidate in Table 1 using the software package galfit (v3.0.5; Peng et al., 2010). We approximate one-component fits to the 2-dimensional galaxy surface brightness distribution assuming a Sérsic profile (Sérsic, 1968; Caon et al., 1993). We split the fitting procedure into several steps: We create individual postage stamp images for each dwarf candidate and construct their segmentation maps using SExtractor (Bertin & Arnouts, 1996). These segmentation maps are then used to create bad pixel masks for each dwarf, masking any non-dwarf sources above a 3 threshold, that produce dwarf-only images on which we perform the model fits. We then characterize the dwarfs as either nucleated or non-nucleated.
The non-nucleated dwarfs are fit by a single Sérsic profile, while the nucleated dwarfs are approximated by two components. The robustness of the fitting procedure is estimated from a few systematically differing initial guesses for all model parameters. For 88 non-nucleated dwarfs, all varying initial guesses immediately converged to the same solution and are thus considered to be robust fits. On the other hand, for 114, mostly fainter objects, galfit could not find a stable solution, so we refine the fitting by adopting the following iterative procedure. First, we estimate the total galaxy luminosity from SExtractor MAG_AUTO values using the corresponding segmentation maps. These magnitudes are then used as initial guesses for the galfit Sérsic models and kept fixed during the fit. In this way, the fits are stabilized so that the remaining model parameters can be derived. Next, the newly estimated parameters are kept fixed and the galaxy luminosity is recomputed with galfit. In the final step of the procedure, the newly determined magnitude is again fixed to recompute the other parameters. In this way, all non-nucleated dwarfs were successfully fit, and each galaxy model and residual image were visually inspected to ensure the derived parameters are statistically robust and provide reliable approximations.
To achieve consistent and meaningful fits for the nucleated dwarfs, we modified the procedure to properly account for the excess light in the nuclei. We first attempted to fit a galaxy model with two components, e.g. a Nuker or King profile for the nucleus and a Sérsic profile for the extended, diffuse galaxy spheroid. However, very few stable solutions were found for the nuclei due to their small sizes. As a solution to this problem, we instead mask the nuclei and then fit a single Sérsic to the outer diffuse galaxy spheroid. From the residual images (including the galaxy nuclei) we generate improved masks for the nuclei and any other sources contaminating the diffuse components of the dwarfs. This procedure resulted in stable fits for the diffuse spheroids of all nucleated dwarf galaxy candidates. Again, the residual and model images for each galaxy were visually inspected to validate the robustness of the computed model parameters.
For 20 galaxies in our sample we could not obtain stable fits mostly due to their locations near bright stars or simply being too faint. All remaining 264 dwarfs can be reliably fit with a Sérsic model with and show a well-defined peak around . This is consistent with previous measurements (e.g. Côté et al., 2007) which show that the main bodies of galaxies are well defined by a Sérsic profile with Sérsic indices that vary smoothly from (deVaucouleurs profile) in the most massive systems to (exponential profiles) in the lowest mass galaxies.
4. Discussion
In this section we explore various parameter spaces of the newly expanded Fornax dwarf galaxy population. We first compare them to other galactic systems in the context of their respective size-luminosity relations, and then provide an overall view of their spatial distributions with respect to both each other, and the population of giant elliptical galaxies in the Fornax cluster core.
4.1. Size-Luminosity Relation
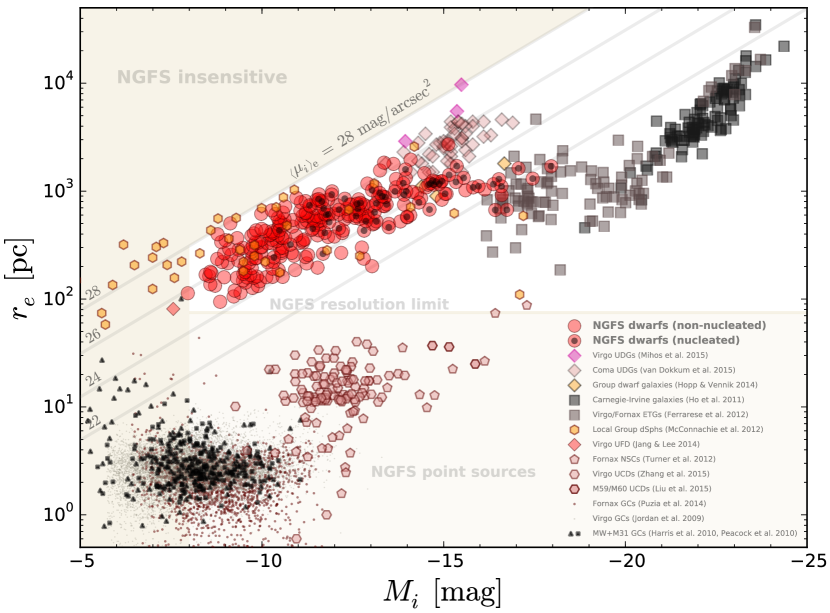
Figure 2 shows the effective radii vs. absolute -band magnitudes for our NGFS sample dwarf galaxies in relation to other stellar systems in the nearby Universe. The detected Fornax dwarfs range mainly between values of mag arcsec-2, with absolute luminosities down to approximately mag – similar to the Virgo ultra-faint dwarf (UFD) recently detected by Jang & Lee (2014) – and half-light radii from pc up to kpc. For the 92 galaxies in common between our NGFS and the FCC catalogue, we find good agreement between the magnitudes and effective radii, confirming the robustness of our measurements. The measured luminosities and structural parameters are provided in Table 1.
At the bright end of the NGFS sequence in Figure 2 we find dwarf galaxies that resemble ultra-diffuse galaxies identified by Mihos et al. (2015) in Virgo and van Dokkum et al. (2015) in the Coma cluster. We therefore confirm that UDGs also exist in the central regions of the Fornax galaxy cluster and are not confined to massive galaxy clusters alone. However, at a given luminosity the Fornax dwarfs are significantly smaller than the Coma and Virgo UDGs. The existence of such galaxies has been predicted and observed by Dalcanton et al. (1997). At the faint end of the NGFS dwarf sequence, the lowest surface brightness dwarfs find analogues in Local Group galaxies such as the Draco, Ursa Major, and Andromeda XXVII dwarf spheroidals (McConnachie, 2012). Overall the NGFS dwarf sequence appears very similar to the size-luminosity relation of Local Group dwarf spheroidal galaxies. However, within the photometric completeness limits of our data we detect a small offset towards a higher average surface brightness of NGFS dwarfs compared with Local Group dwarfs. This might be due to either i) sample statistics of the Fornax dwarf population, ii) the harsher ram-pressure stripping and tidal environment in Fornax which at a given total luminosity can render galaxies more compact (Mayer et al., 2006) or/and iii) different star formation histories and stellar population properties of NGFS dwarfs (e.g. Guérou et al., 2015). We will discuss these relations in detail in a subsequent paper.
4.2. Nucleation Fractions
We divide our sample into nucleated and non-nucleated dwarf galaxies, which was an obvious classification for almost all galaxies. Those very few galaxies, with initially uncertain classification were also easily assigned to either of the categories after subtraction of their spheroid light component. We find that the nucleated dwarfs are on average significantly brighter than their non-nucleated counterparts. Both nucleated and non-nucleated sub-samples clearly show a size-luminosity relation, in the sense of increasing size with increasing galaxy luminosity. However, the slope of this trend is significantly shallower for the nucleated dwarfs.
We investigate how the nucleation fraction () changes as a function of galaxy luminosity. Figure 2 shows that is a strong function of galaxy luminosity in the sense that fainter dwarfs show systematically lower . We find that many FCC dwarfs had wrong nucleation flags and we revised their classification. We note that FCC galaxies are, on average, brighter than our newly detected dwarfs, and that 45 out of 92 reclassified FCC galaxies show a nucleus, i.e. %, which is consequence of the higher spatial resolution222Note that Côté et al. (2006) find also a much higher nucleation fraction in Virgo compared to the Virgo Cluster Catalog (Binggeli et al., 1985).. For the newly detected NGFS dwarfs only 15 out of 158 (%) are nucleated. In any case, Figure 2 clearly shows a trend of increasing nucleation fraction with galaxy spheroid luminosity. For luminosities fainter than mag, we observe , whereas for those galaxies brighter than mag, increases to %.
From HST/ACS imaging analysis, Turner et al. (2012) find an average nucleus-to-galaxy luminosity ratio, , for bright Fornax early-type galaxies of 0.41%, which corresponds to a magnitude difference of 6 mag. Considering our approximate point-source detection limit at mag, we should not be detecting nuclei in galaxies fainter than mag, which we clearly do. This indicates that for those intermediate luminosity galaxies, i) the galaxy spheroids are too faint for their nuclei, e.g. due to tidal stripping of their halos, or ii) the nuclei are brighter than what would be expected from of brighter early-type galaxies, i.e. hosting younger and/or lower-metallicity stellar populations, or iii) the formation of the nuclei was more efficient, i.e at higher redshifts when the environmental density was higher. We will discuss this interesting result in an upcoming paper.
4.3. Spatial Distribution
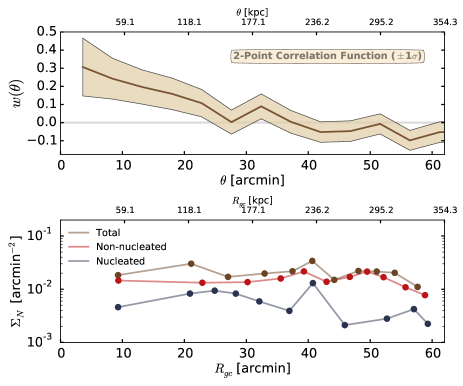
A comprehensive view of the new dwarf candidate spatial distribution is illustrated in Figure 3, where the dwarfs have been limited to those within 60′ ( kpc) of NGC 1399 to ensure uniform angular representation. The result of a two-point angular correlation function (Landy & Szalay, 1993) analysis of the NGFS dwarf sample is shown in the top-left panel along with 1- bounds. On length scales below kpc, an intriguing excess appears, indicating the clustering of dwarf galaxies. This may point to i) dwarf-giant galaxy clustering or/and ii) bound dwarf galaxy groups that survive in the galaxy cluster environment on those or smaller spatial scales. Interestingly, such dwarf galaxy clustering has been reported in high-resolution numerical simulations (Kravtsov et al., 2004; Weinberg et al., 2008; van Daalen et al., 2014; Wheeler et al., 2015). We will investigate this result and its interpretation in a dedicated future paper.
The bottom-left panel of Figure 3 shows the projected radial surface number density () profiles for the non-nucleated dwarfs (red), nucleated fraction (blue), and total population (brown). The values show the number of dwarfs per arcmin2 within adaptively sized annuli containing 20 galaxies each for the total sample, and appropriately scaled for the two subsamples such that similar total data points are obtained, i.e. 15 and 5 galaxies per bin for the non-nucleated and nucleated samples, respectively. Cluster centric distances corresponding to annuli mid-points are shown along the top- and bottom axes in physical and angular units. The non-nucleated sample and total population are both consistent with having flat distributions of out to , whereas the nucleated dwarf population (noting the much smaller sample) appears to decline outside of . However, this result requires confirmation with a larger sample from the full NGFS survey footprint.
The distributions in azimuthal angles are shown in the right-hand panel of Figure 3, where the color opacity has been decreased to show where the samples overlap. The smooth curves indicate non-parametric Epanechnikov-kernel probability density estimates based on the discrete data, and each curve exhibits several distinct peaks. For all curves, there is a noteworthy over density along the direction, which coincides with the inter-cluster medium between the giant galaxies NGC 1427 and NGC 1399 (see Figure 1). The non-nucleated population appears much more stochastic, but with a notable broad distribution in the range , with individual peaks that closely follow the distributions of the other giant galaxies in the Fornax core, e.g. NGC 1386 (), NGC 1387, and 1379 (), and NGC 1374 (). While the total number of nucleated dwarf candidates prohibit making definitive statements, their distribution tends to follow the same general East-West bimodality, but without the discrete over densities shown by the populous samples. Thus, while they are likely to trace the interactions between the dominant galaxies of Fornax, their broader distributions limit what can be concluded regarding specific associations at this point. The full NGFS survey dataset will expand this result to a larger-scale analysis.
References
- Bertin & Arnouts (1996) Bertin, E., & Arnouts, S. 1996, A&AS, 117, 393
- Binggeli et al. (1985) Binggeli, B., Sandage, A., & Tammann, G. A. 1985, AJ, 90, 1681
- Blakeslee et al. (2009) Blakeslee, J. P., Jordán, A., Mei, S., et al. 2009, ApJ, 694, 556
- Burkert (2015) Burkert, A. 2015, ApJ, 808, 158
- Bovill & Ricotti (2009) Bovill, M. S., & Ricotti, M. 2009, ApJ, 693, 1859
- Bovill & Ricotti (2011a) Bovill, M. S., & Ricotti, M. 2011a, ApJ, 741, 17
- Bovill & Ricotti (2011b) Bovill, M. S., & Ricotti, M. 2011b, ApJ, 741, 18
- Brooks et al. (2011) Brooks, A. M., Solomon, A. R., Governato, F., et al. 2011, ApJ, 728, 51
- Caon et al. (1993) Caon, N., Capaccioli, M., & D’Onofrio, M. 1993, MNRAS, 265, 1013
- Churazov et al. (2008) Churazov, E., Forman, W., Viklinin, A., et al. 2008, MNRAS, 388, 1062
- Côté et al. (2006) Côté, P., Piatek, S., Ferrarese, L., et al. 2006, ApJS, 165, 57
- Côté et al. (2007) Côté, P., Ferrarese, L., Jordán, A., et al. 2007, ApJ, 671, 1456
- Dalcanton et al. (1997) Dalcanton, J. J., Spergel, D. N., & Summers, F. J. 1997, ApJ, 482, 659
- Drinkwater et al. (2001) Drinkwater, M. J., Gregg, M. D., Holman, B. A., & Brown, M. J. I. 2001, MNRAS, 326, 1076
- Ferguson (1989) Ferguson, H. C. 1989, AJ, 98, 367
- Ferrarese et al. (2012) Ferrarese, L., Côté, P., Cuillandre, J.-C., et al. 2012, ApJS, 200, 4
- Flaugher et al. (2015) Flaugher, B., Diehl, H. T., Honscheid, K., et al. 2015, arXiv:1504.02900
- Guérou et al. (2015) Guérou, A., Emsellem, E., McDermid, R. M., et al. 2015, ApJ, 804, 70
- Harris (2010) Harris, W. E. 2010, arXiv:1012.3224
- Ho et al. (2011) Ho, L. C., Li, Z.-Y., Barth, A. J., Seigar, M. S., & Peng, C. Y. 2011, ApJS, 197, 21
- Hopp & Vennik (2014) Hopp, U., & Vennik, J. 2014, Astronomische Nachrichten, 335, 992
- Jang & Lee (2014) Jang, I. S., & Lee, M. G. 2014, ApJ, 795, L6
- Jordán et al. (2009) Jordán, A., Peng, E. W., Blakeslee, J. P., et al. 2009, ApJS, 180, 54
- Koda et al. (2015) Koda, J., Yagi, M., Yamanoi, H., & Komiyama, Y. 2015, ApJ, 807, L2
- Kravtsov et al. (2004) Kravtsov, A. V., Berlind, A. A., Wechsler, R. H., et al. 2004, ApJ, 609, 35
- Landy & Szalay (1993) Landy, S. D., & Szalay, A. S. 1993, ApJ, 412, 64
- Liu et al. (2015) Liu, C., Peng, E. W., Toloba, E., et al. 2015, arXiv:1508.07373
- Mayer et al. (2006) Mayer, L., Mastropietro, C., Wadsley, J., Stadel, J., & Moore, B. 2006, MNRAS, 369, 1021
- McConnachie (2012) McConnachie, A. W. 2012, AJ, 144, 4
- Mieske et al. (2007) Mieske, S., Hilker, M., Infante, L., & Mendes de Oliveira, C. 2007, A&A, 463, 503
- Mihos et al. (2015) Mihos, J. C., Durrell, P. R., Ferrarese, L., et al. 2015, ApJ, 809, L21
- Mistani et al. (2015) Mistani, P. A., Sales, L. V., Pillepich, A., et al. 2015, arXiv:1509.00030
- Peacock et al. (2010) Peacock, M. B., Maccarone, T. J., Knigge, C., et al. 2010, MNRAS, 402, 803
- Peng et al. (2010) Peng, C. Y., Ho, L. C., Impey, C. D., & Rix, H.-W. 2010, AJ, 139, 2097
- Puzia et al. (2014) Puzia, T. H., Paolillo, M., Goudfrooij, P., et al. 2014, ApJ, 786, 78
- Pfeffer et al. (2014) Pfeffer, J., Griffen, B. F., Baumgardt, H., & Hilker, M. 2014, MNRAS, 444, 3670
- Schuberth et al. (2010) Schuberth, Y., Richtler, T., Hilker, M., et al. 2010, A&A, 513, 52
- Sérsic (1968) Sérsic, J. L. 1968, Cordoba, Argentina: Observatorio Astronomico, 1968
- Skrutskie et al. (2006) Skrutskie, M. F., Cutri, R. M., Stiening, R., et al. 2006, AJ, 131, 1163
- Sutherland et al. (2015) Sutherland, W., Emerson, J., Dalton, G., et al. 2015, A&A, 575, A25
- Turner et al. (2012) Turner, M. L., Côté, P., Ferrarese, L., et al. 2012, ApJS, 203, 5
- van Daalen et al. (2014) van Daalen, M. P., Schaye, J., McCarthy, I. G., Booth, C. M., & Dalla Vecchia, C. 2014, MNRAS, 440, 2997
- van Dokkum et al. (2015) van Dokkum, P. G., Abraham, R., Merritt, A., et al. 2015, ApJ, 798, L45
- Vogelsberger et al. (2014) Vogelsberger, M., Zavala, J., Simpson, C., & Jenkins, A. 2014, MNRAS, 444, 3684
- Weinberg et al. (2008) Weinberg, D. H., Colombi, S., Davé, R., & Katz, N. 2008, ApJ, 678, 6
- Wheeler et al. (2015) Wheeler, C., Oñorbe, J., Bullock, J. S., et al. 2015, MNRAS, 453, 1305
- Zhang et al. (2015) Zhang, H.-X., Peng, E. W., Côté, P., et al. 2015, ApJ, 802, 30