Quantifying the plasmonic character of optical excitations in nanostructures
Abstract
The identification of plasmons in systems below 10 nm in size is a tremendous challenge. Any sharp distinction of the excitation character (non-plasmonic vs plasmonic) becomes blurred in this range of sizes, where quantum effects become important. Here we define a plasmonicicty index that quantifies the plasmonic character of selected optical excitations in small nanostructures, starting from first principles calculations, based on (TD)DFT. This novel approach allows us to overcome the aforementioned problems, providing a direct and quantitative classification of the plasmonic character of the excitations. We show its usefulness for model metallic nanoparticles, a prototypical C-based molecule and a paradigmatic hybrid system. Our results indicate that the plasmonicity index can be exploited to solve previously unsolvable problems about the plasmonic character of complex systems, not predictable a priori.
Localized surface plasmon resonances in nanostrucures interact strongly with light allowing the confinement of electromagnetic energy down to deep subwavelength regionsTame et al. (2013); Savage et al. (2012). This, together with their easy tunabilityLinic et al. (2015), robustnessGarcía de Abajo and Manjavacas (2015) and field enhancement propertiesAlonso-González et al. (2014), provides a powerful tool to manipulate light at the nanoscale, below the diffraction limit. Thus, plasmons have become of paramount importance for a wide range of applicationsHalas et al. (2011); Li et al. (2015); Zheng et al. (2014) spanning from light harvestingAtwater and Polman (2010) to biosensingMayer and Hafner (2011). In general terms, plasmons can be defined as electronic collective excitations that arise when the Coulomb interaction between excited states is switched onBernadotte et al. (2013). However, their theoretical description at the microscopic level is still an open and controversial issuede Abajo et al. (2015). In large nanoparticles optical and plasmonic properties are generally described by electrodynamics of continuous media, exploiting semiclassical models of the frequency-dependent dielectric functionWoo ; Kre ; Sal and the identification of plasmons is straightforward. This description has been very useful for designing applications, but fails to convey a microscopic understanding of what plasmons are. Nanoparticles and their excitations are composed of electrons and nuclei like ordinary molecules. Therefore, it must be possible to understand their excited states, including plasmons, in terms of the same elementary electron and hole excitations routinely used to interpret molecular excited states. Notably, such a microscopic description is mandatory when the system size reaches 1-2 nanometers, where the dielectric description breaks down and quantum finite-size effectsSavage et al. (2012); Thongrattanasiri et al. (2012) as well as the details of the atomic structureZhang et al. (2014) play a crucial role. However, at the nanoscale, single-particle and plasmonic excitations are intrinsically mixedZheng et al. (2015), and how to recognize a plasmonic excitation is still an unsolved problem.
A few approaches have been recently proposed attempting to classify the plasmonic character of the excitations of nanosystems.Bernadotte et al. (2013); Guidez and Aikens (2013); Townsend and Bryant (2014); Guidez and Aikens (2014); Bursi et al. (2014); Krauter et al. (2014); Townsend et al. (2015) In particular, Bernadotte et al.Bernadotte et al. (2013) formulated, in the framework of time-dependent density-functional theory (TDDFT), a scaling approach based on the different dependence of the energies of the excitations of nanosystems on the Coulomb kernel. Along this line, Krauter et al.Krauter et al. (2014) demonstrated that the electronic wave function of plasmons, at the time-dependent Hartree-Fock level, is described by the superposition of several electron configurations, i.e. Slater determinants, while this is not the case for non-plasmonic excitations.
However, all the aforementioned approaches lack a simple quantification of the relative plasmonic character of the electronic excitations. Frequently, especially at the nanoscale, a sharp classification of the excitations of a physical system in two categories, i.e. plasmonic or non-plasmonic, becomes ambiguous since plasmonic and non-plasmonic excitations with similar energies and similar symmetries mixBernadotte et al. (2013). In this letter, we present an approach, based on the quantitative assessment of the plasmonic character of the excitations, which allows us to overcome this problem. To this end, we define an index that quantifies the plasmonicity of a given excitation. In particular we will focus on light-induced optical excitations, that are the ones typically of interest in nanosystems.
When a monochromatic external scalar potential is applied to a physical system, its equilibrium charge density modifies as a response to the perturbation. This modification is the induced charge density which in turn generates an induced potential . Here the external density response function and the Coulomb kernel have been introduced. The superposition of the external and the induced potential gives the total potential and can be rewritten in terms of through the irreducible response function as . From the previous expressions, the well-known Dyson-like integral equation for the response functions can be obtainedFet
| (1) | ||||
The poles of the external response function, which correspond to the zero modes of ,
| (2) |
are the electronic excitations of the system. In Eq.(2), is the transition density for the excitation. Introducing the dielectric function Mar ; Sal , Eq.(2) can be rewritten as . Considering the above equations and according to the typical classification adopted in solid-state physics(Egri, 1985; Fet, ; Bernadotte et al., 2013), the poles of can be divided into two types: (i) those corresponding to the zero modes of , identified as plasmons and (ii) those originated from the poles of , hereafter called non-plasmonic excitations.
However, the concept of for molecules and nanoparticles is not straightforward. To link the plasmonic character to a more intuitive quantity, here we follow an alternative approach. From Eq.(1) we derive the relation
| (3) |
Substituting Eq.(3) in Eq.(2), we obtain
| (4) |
where is the induced potential generated by . In the same spirit of the analysis done above, we can classify the character of the excitation looking at the zeros of Eq.(4). Non-plasmonic excitations correspond to the poles of the irreducible response function, i.e. to zero modes of , and therefore at the frequency of an excitation of this kind, the first term of Eq.(4) vanishes. Since Eq.(4) still holds, also the induced potential in the case of a non-plasmonic excitation should in principles vanish. Plasmons, instead, do not correspond to zero modes of , as we previously recalled, and thus the first term of Eq.(4) does not vanish, at the frequency of a plasmonic excitation. Therefore, the potential induced by a plasmon should remain finite, in order to satisfy Eq.(4). The measure of how much the induced potential deviates from 0 can thus be interpreted as the measure of the plasmonic character of the excitation. We therefore introduce a plasmonicity index as
| (5) |
In the light of the above considerations, the higher is , the more plasmonic is the excitation of frequency . The direct relation between the plasmonic nature of an excitation and the intensity of the relative induced potential is physically sound, as plasmons are typically connected with the local enhancement of the electromagnetic field. We choose the normalization of in Eq.(5) to remove the trivial dependence of on the normalization of . We also explored the use of an index with a different normalizationSM ; the results, in line with those obtained by exploiting Eq.(5), are given in Ref.SM .
Within this letter, we calculate the plasmonicity index for four paradigmatic molecular systems. We consider a linear Na20 chain and a tetrahedral Ag20 cluster as model plasmonic metallic nanosystemsBernadotte et al. (2013); Yan et al. (2007); Chen et al. (2013), a naphthalene molecule as an example of molecular system that hosts “molecular plasmons”Guidez and Aikens (2013); Manjavacas et al. (2013); Bursi et al. (2014); Lauchner et al. (2015) and a coupled system composed of a tetrahedral Ag20 cluster and a pyridine molecule which represents a prototypical hybrid systemZhao et al. (2006) mixing plasmonic and molecular portions. Their electronic structures and absorption spectra have been obtained from first principles simulations carried out by means of the Quantum ESPRESSOGiannozzi et al. (2009) (QE) suite of codes, based on density-functional theory (DFT). We adopt the PBEPerdew et al. (1996) Generalized Gradient Approximation (GGA) to the exchange-correlation (xc) functional and the electronic structure calculations are performed at the point of the Brillouin zone. Within QE, wavefunctions and charge density are expanded in plane wavesnot and the simulation exploits periodically repeated supercells, each containing the molecular system under study in central position and a suitable amount of vacuum ( Å at least) to separate adjacent replica in the three spatial directions. This representation ensures also well converged optical spectra. The molecular structures of our systems are relaxed under the effect of the interatomic forces, with the exception of the hybrid system where the Ag20 cluster and pyridine were relaxed separately. The optical absorption spectra and the response charge densities are computed exploiting the turboTDDFT codeGe et al. (2014), also part of the QE distribution, which implements, in the frequency domain, the Liouville-Lanczos approach to linearized TDDFTMar and allows the calculation of the spectra in a relatively large energy range and in a computationally efficient way. This approach provides the induced densities rather than the transition densities required in Eq.(5). We approximate the latter as a function of the formerSM .
Starting from the first principles results, we computed the plasmonicity index defined by Eq.(5). When TDDFT methods are used, Eq.(1) also contains the xc kernel, in addition to the Coulomb kernel. In this case it is still possible to relate plasmonic excitation to SM .
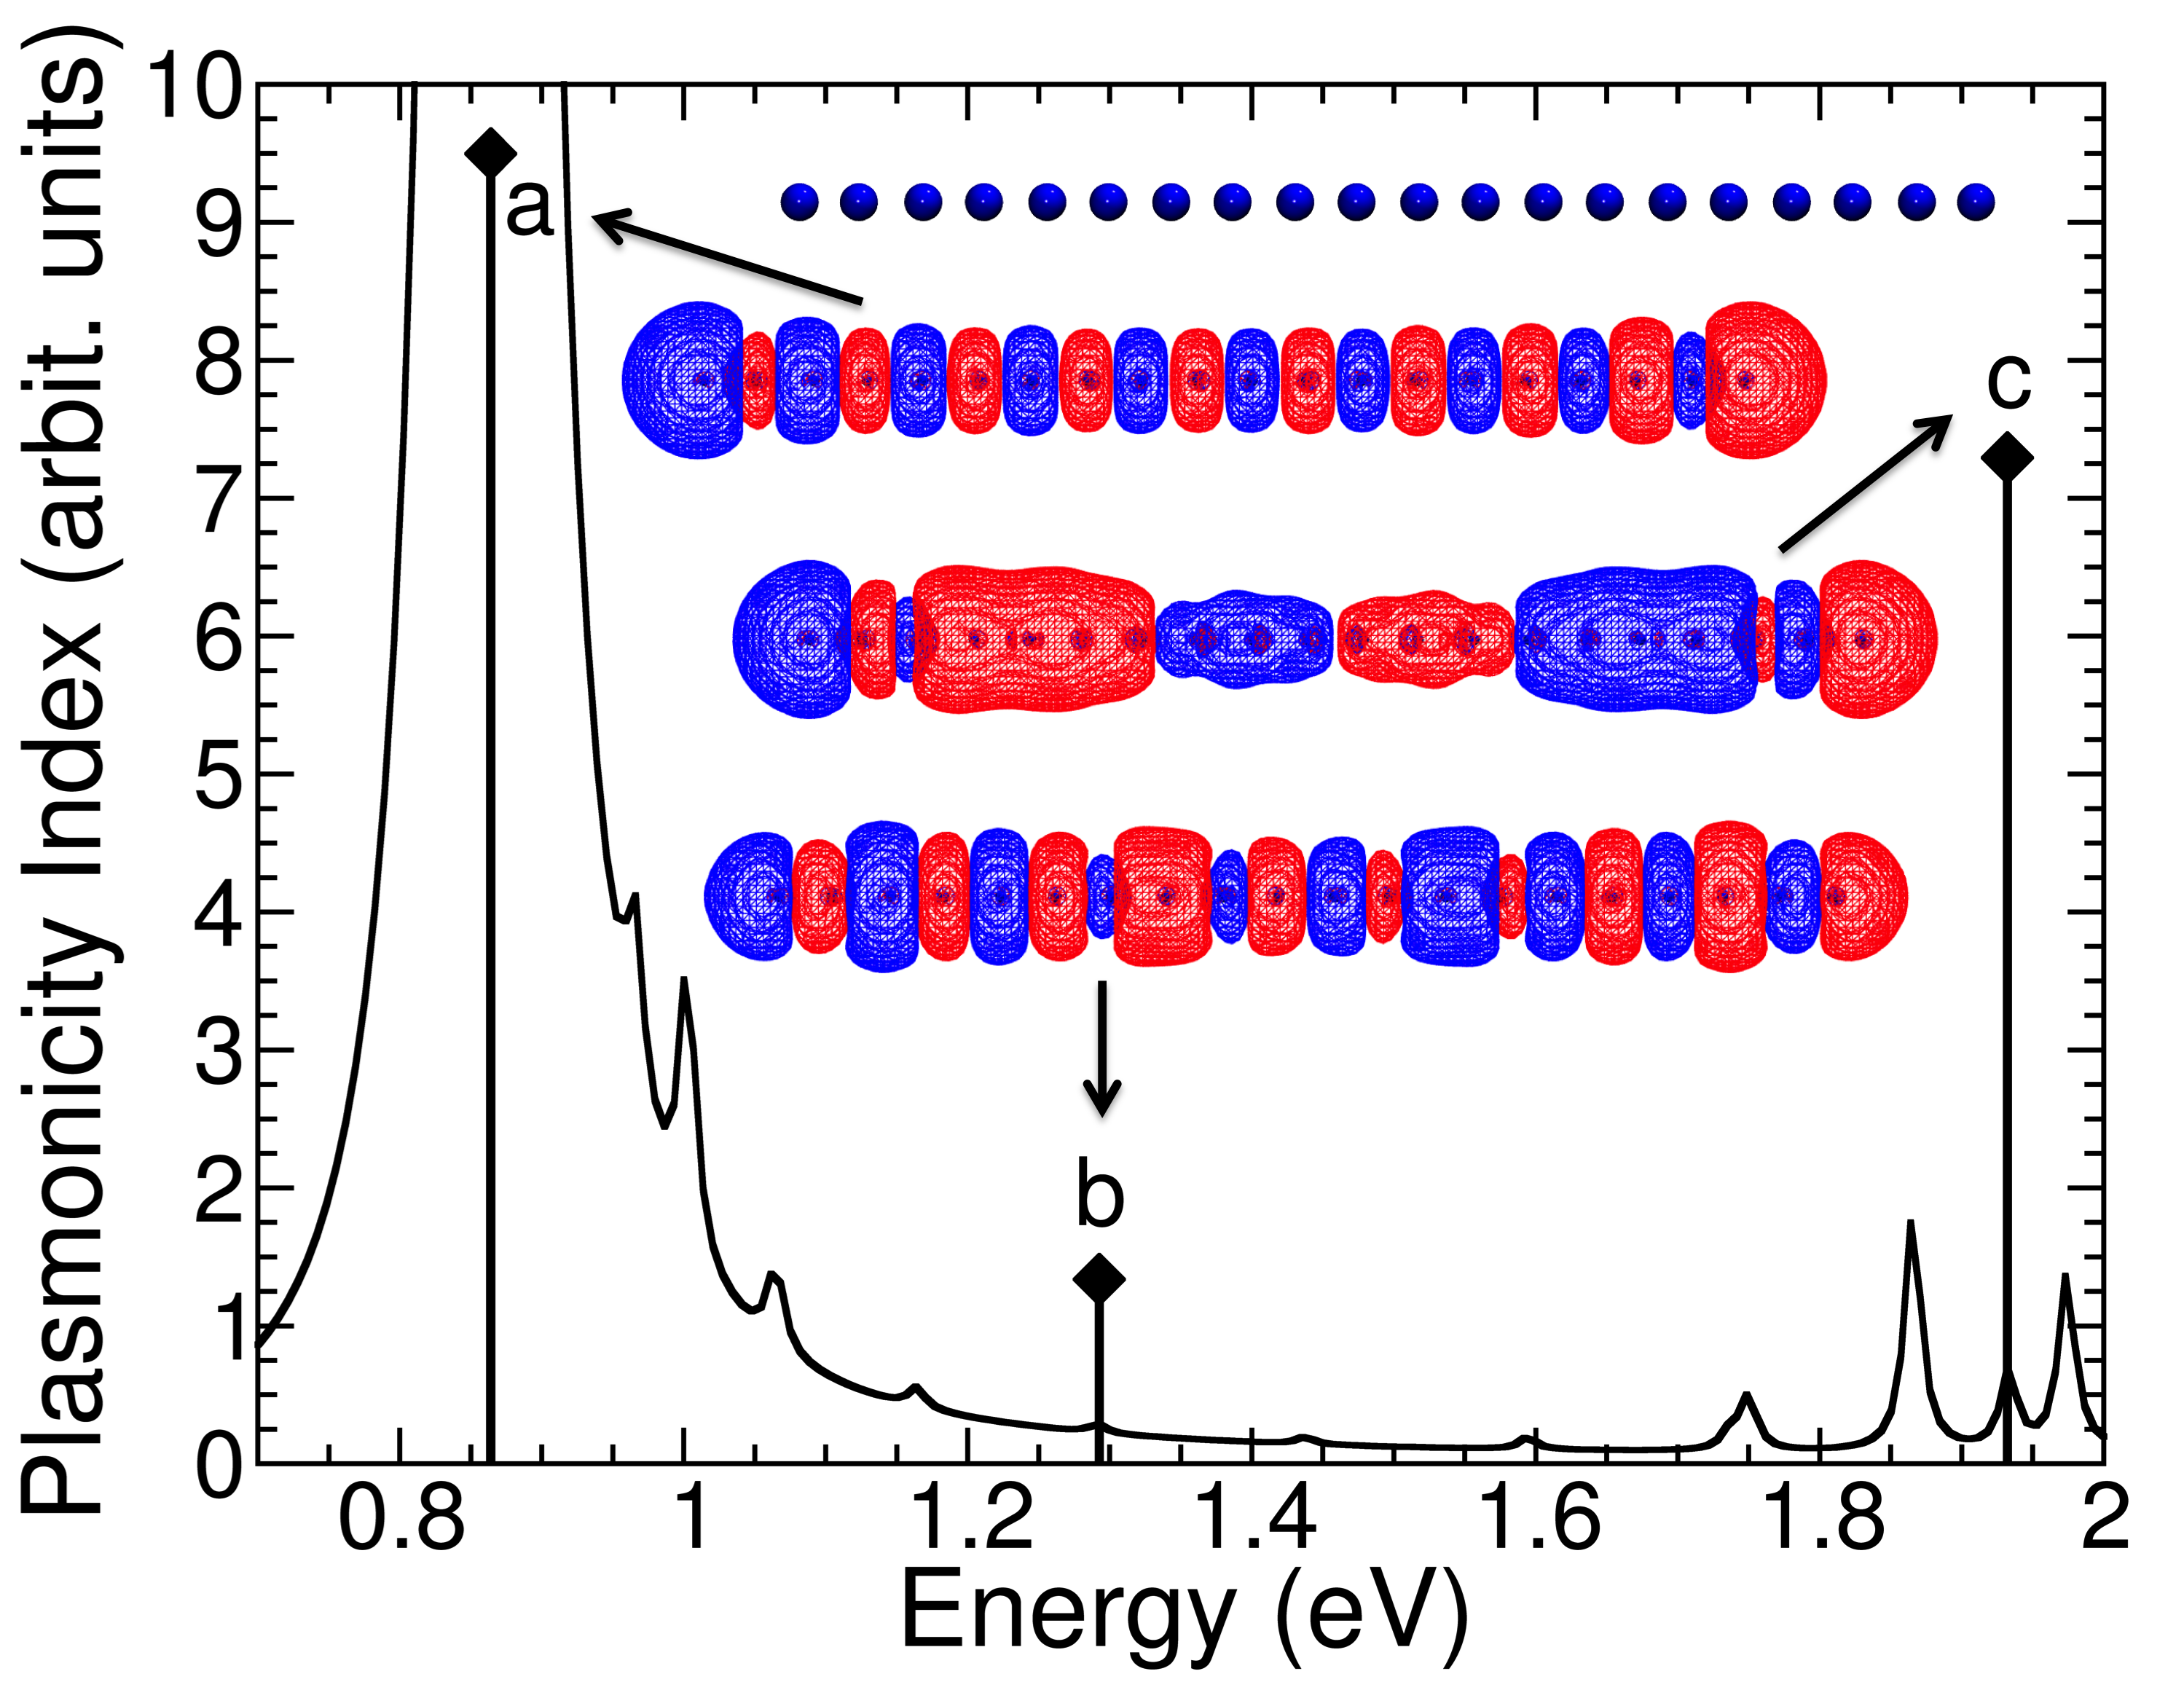
Na20. In Fig.1, the TDDFT absorption spectrum (black solid line) of the Na20 chain (the atomic structure is shown as an inset) is dominated by an intense peak labelled with a in the low energy region. By using the same example as benchmark, Bernadotte et al.Bernadotte et al. (2013) have investigated the plasmonic properties of this system on the basis of the comparison with the 1D free-electron gas plasmons, identifying the transitions here labelled a and c as plasmons and peak b as non-plasmonic. We computed the TDDFT response charge density and the plasmonicity index for peaks a - c (Fig.1). Some more excitations are analysed in Ref.SM . The response charge densities of a and b tend to be localized at the edges of the chain, leaving a charge depletion in the center, thus showing a dipolar character. This feature may indicate a plasmon resonance in a quasi-1D molecular systemBursi et al. (2014), but it is still an ambiguous indication and it is not always sufficient to discriminate the plasmonic character. By plotting, instead, the values of the plasmonicity index (black diamonds in Fig.1) as a function of the energy, we obtain a “plasmonic spectrum” (black vertical lines in Fig.1) that spots plasmonic and non-plasmonic excitations. First of all, we note that the value of is not trivially related to the oscillator strength of the peak. In particular, peak c results almost as plasmonic as peak a, despite its oscillator strength is negligible in comparison. Secondly, the plasmonicity index of peaks a and c is markedly greater than that of peak b, identifying those excitations as plasmonic, in agreement with the independent assignment of Bernadotte et al.Bernadotte et al. (2013). This is an important finding, as it shows that correctly reproduces the results of more complex approaches, when they are applicable.
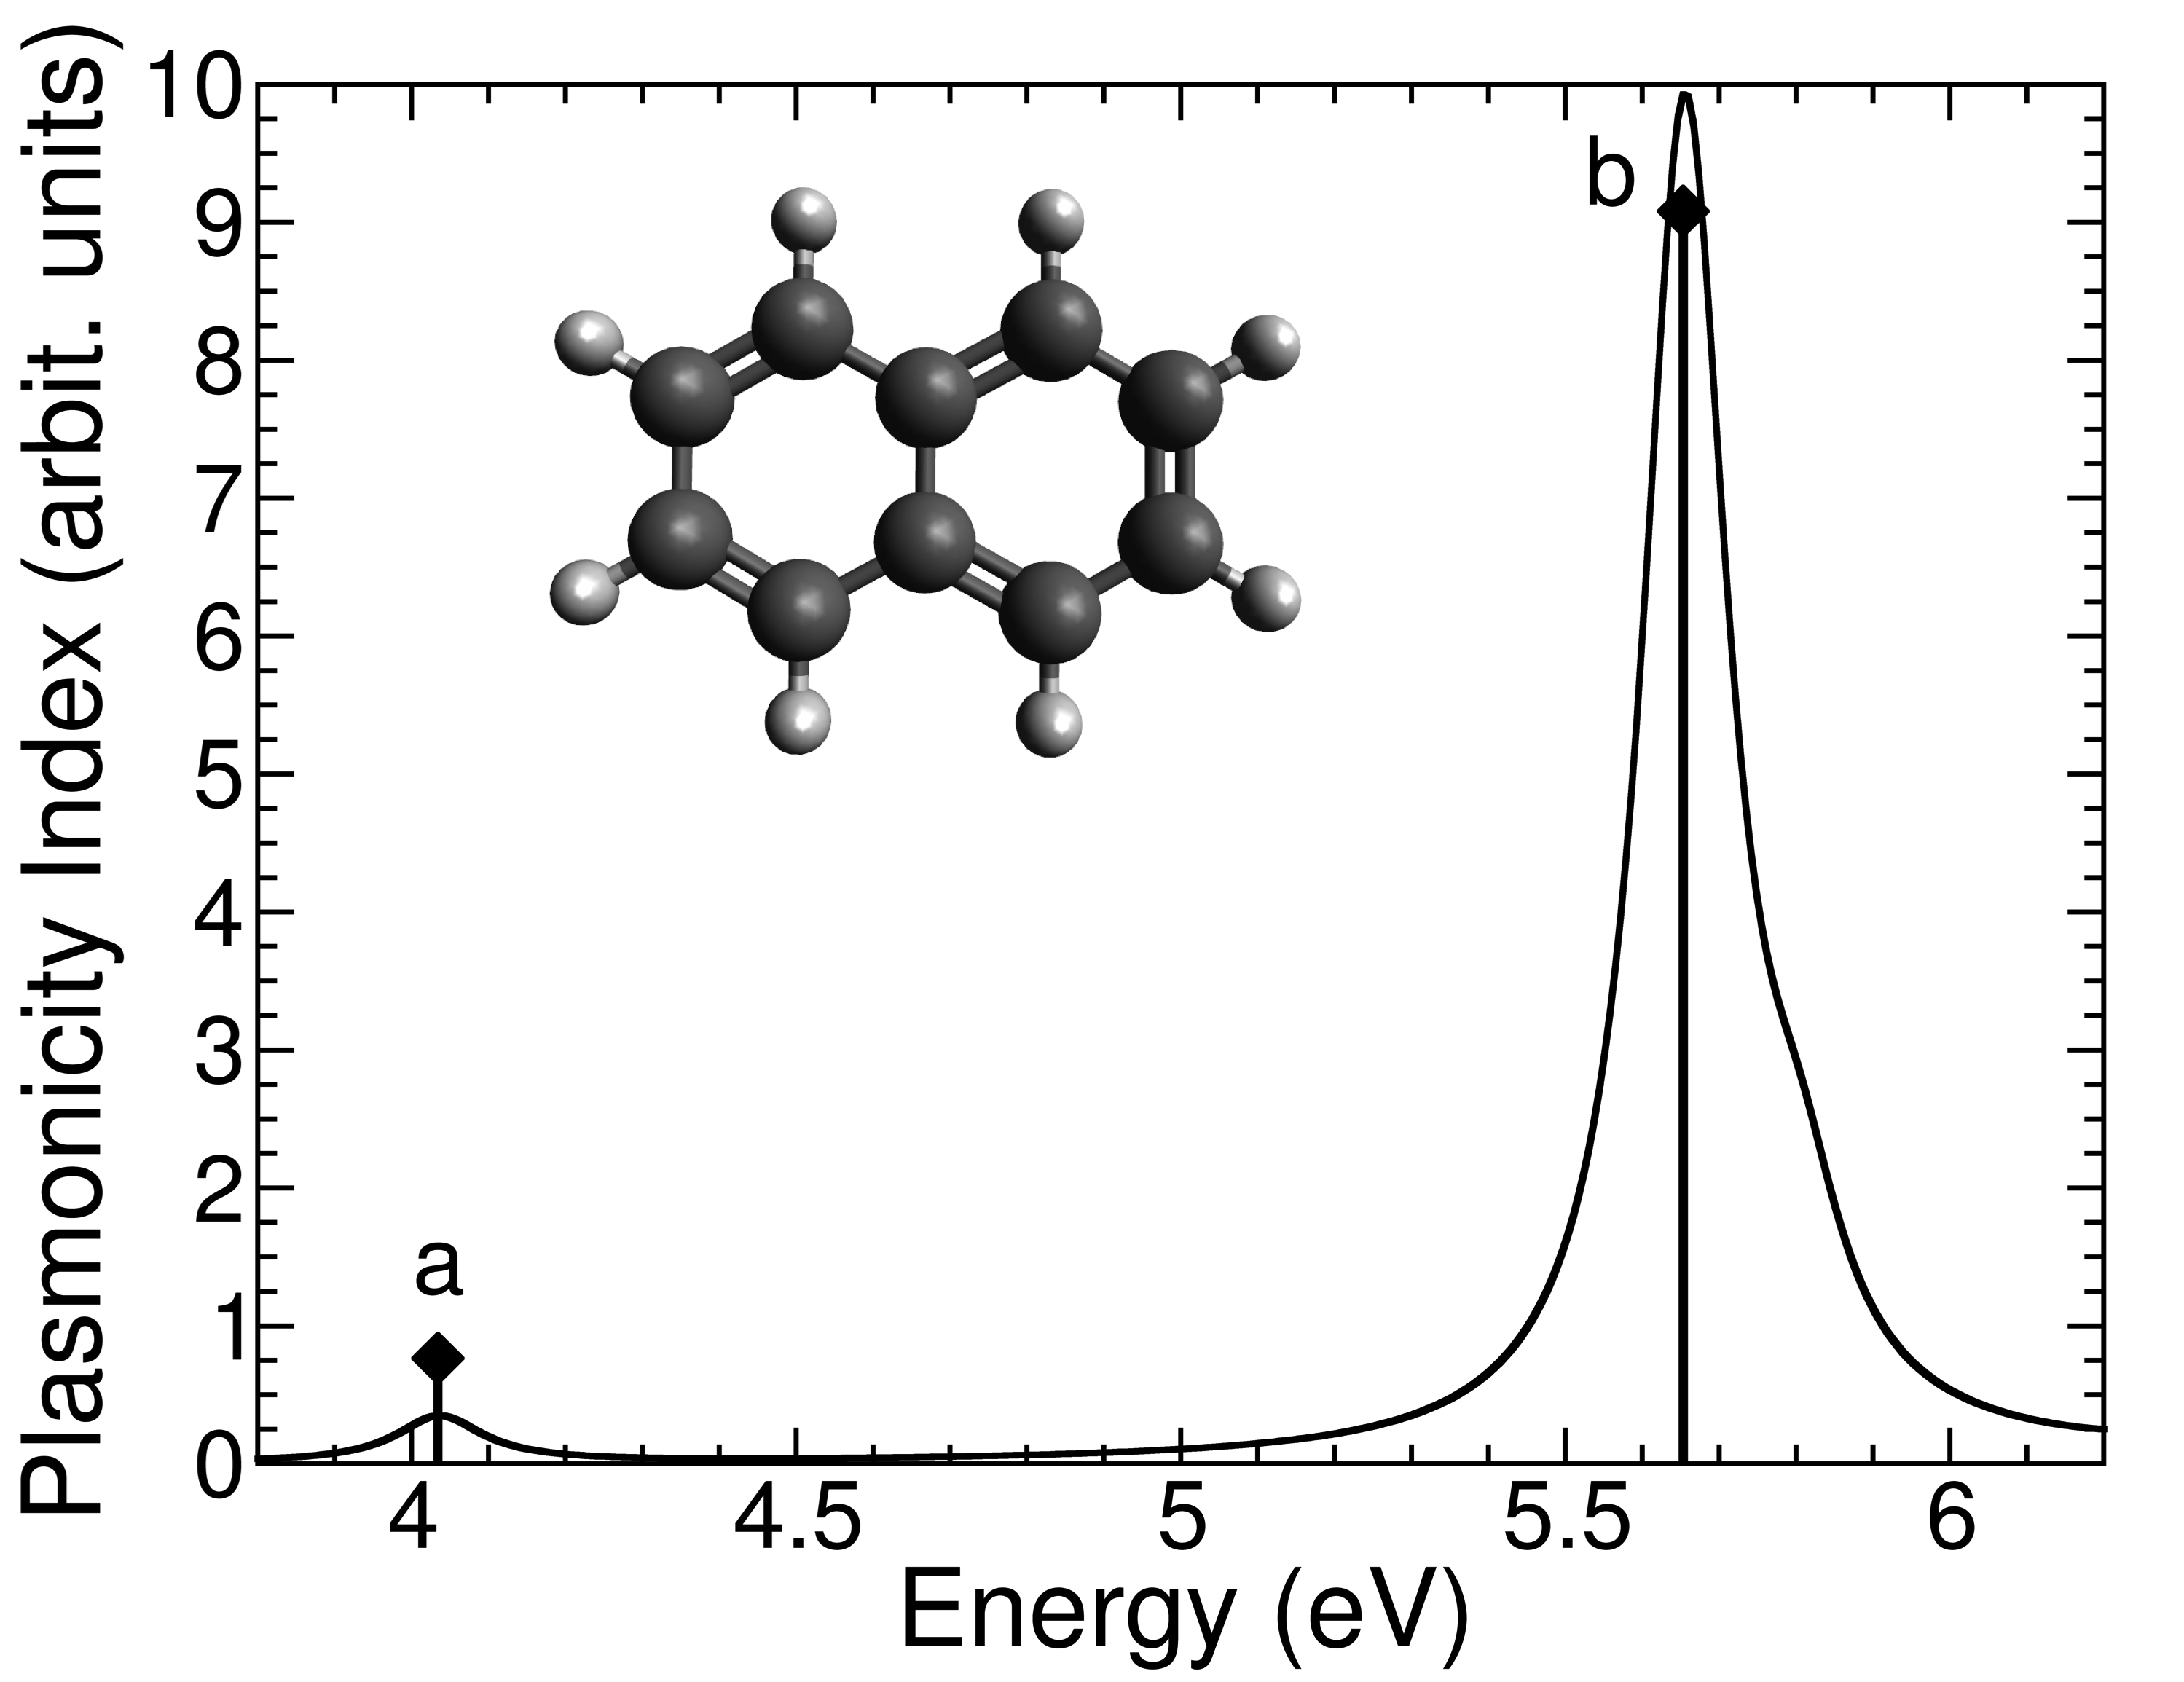
Naphthalene. Now we consider a carbon-based molecular system where only a few transitions can be observed in the low energy region of absorption. The spectrum of naphthalene in Fig.2 (where also the molecular structure is shown as inset) shows two bands, namely the most intense peak b and the weaker peak a at lower energyGuidez and Aikens (2013); Bursi et al. (2014). We have studied the electronic, optical absorption, plasmonic and local field enhancement properties of this system elsewhereBursi et al. (2014) with the same computational procedure and we refer to that for further details. In previous works, b has been identified as a molecular plasmon. The plasmonicity index analysis is in agreement with the picture just described, showing its usefulness also for truly non-metallic molecular systems.
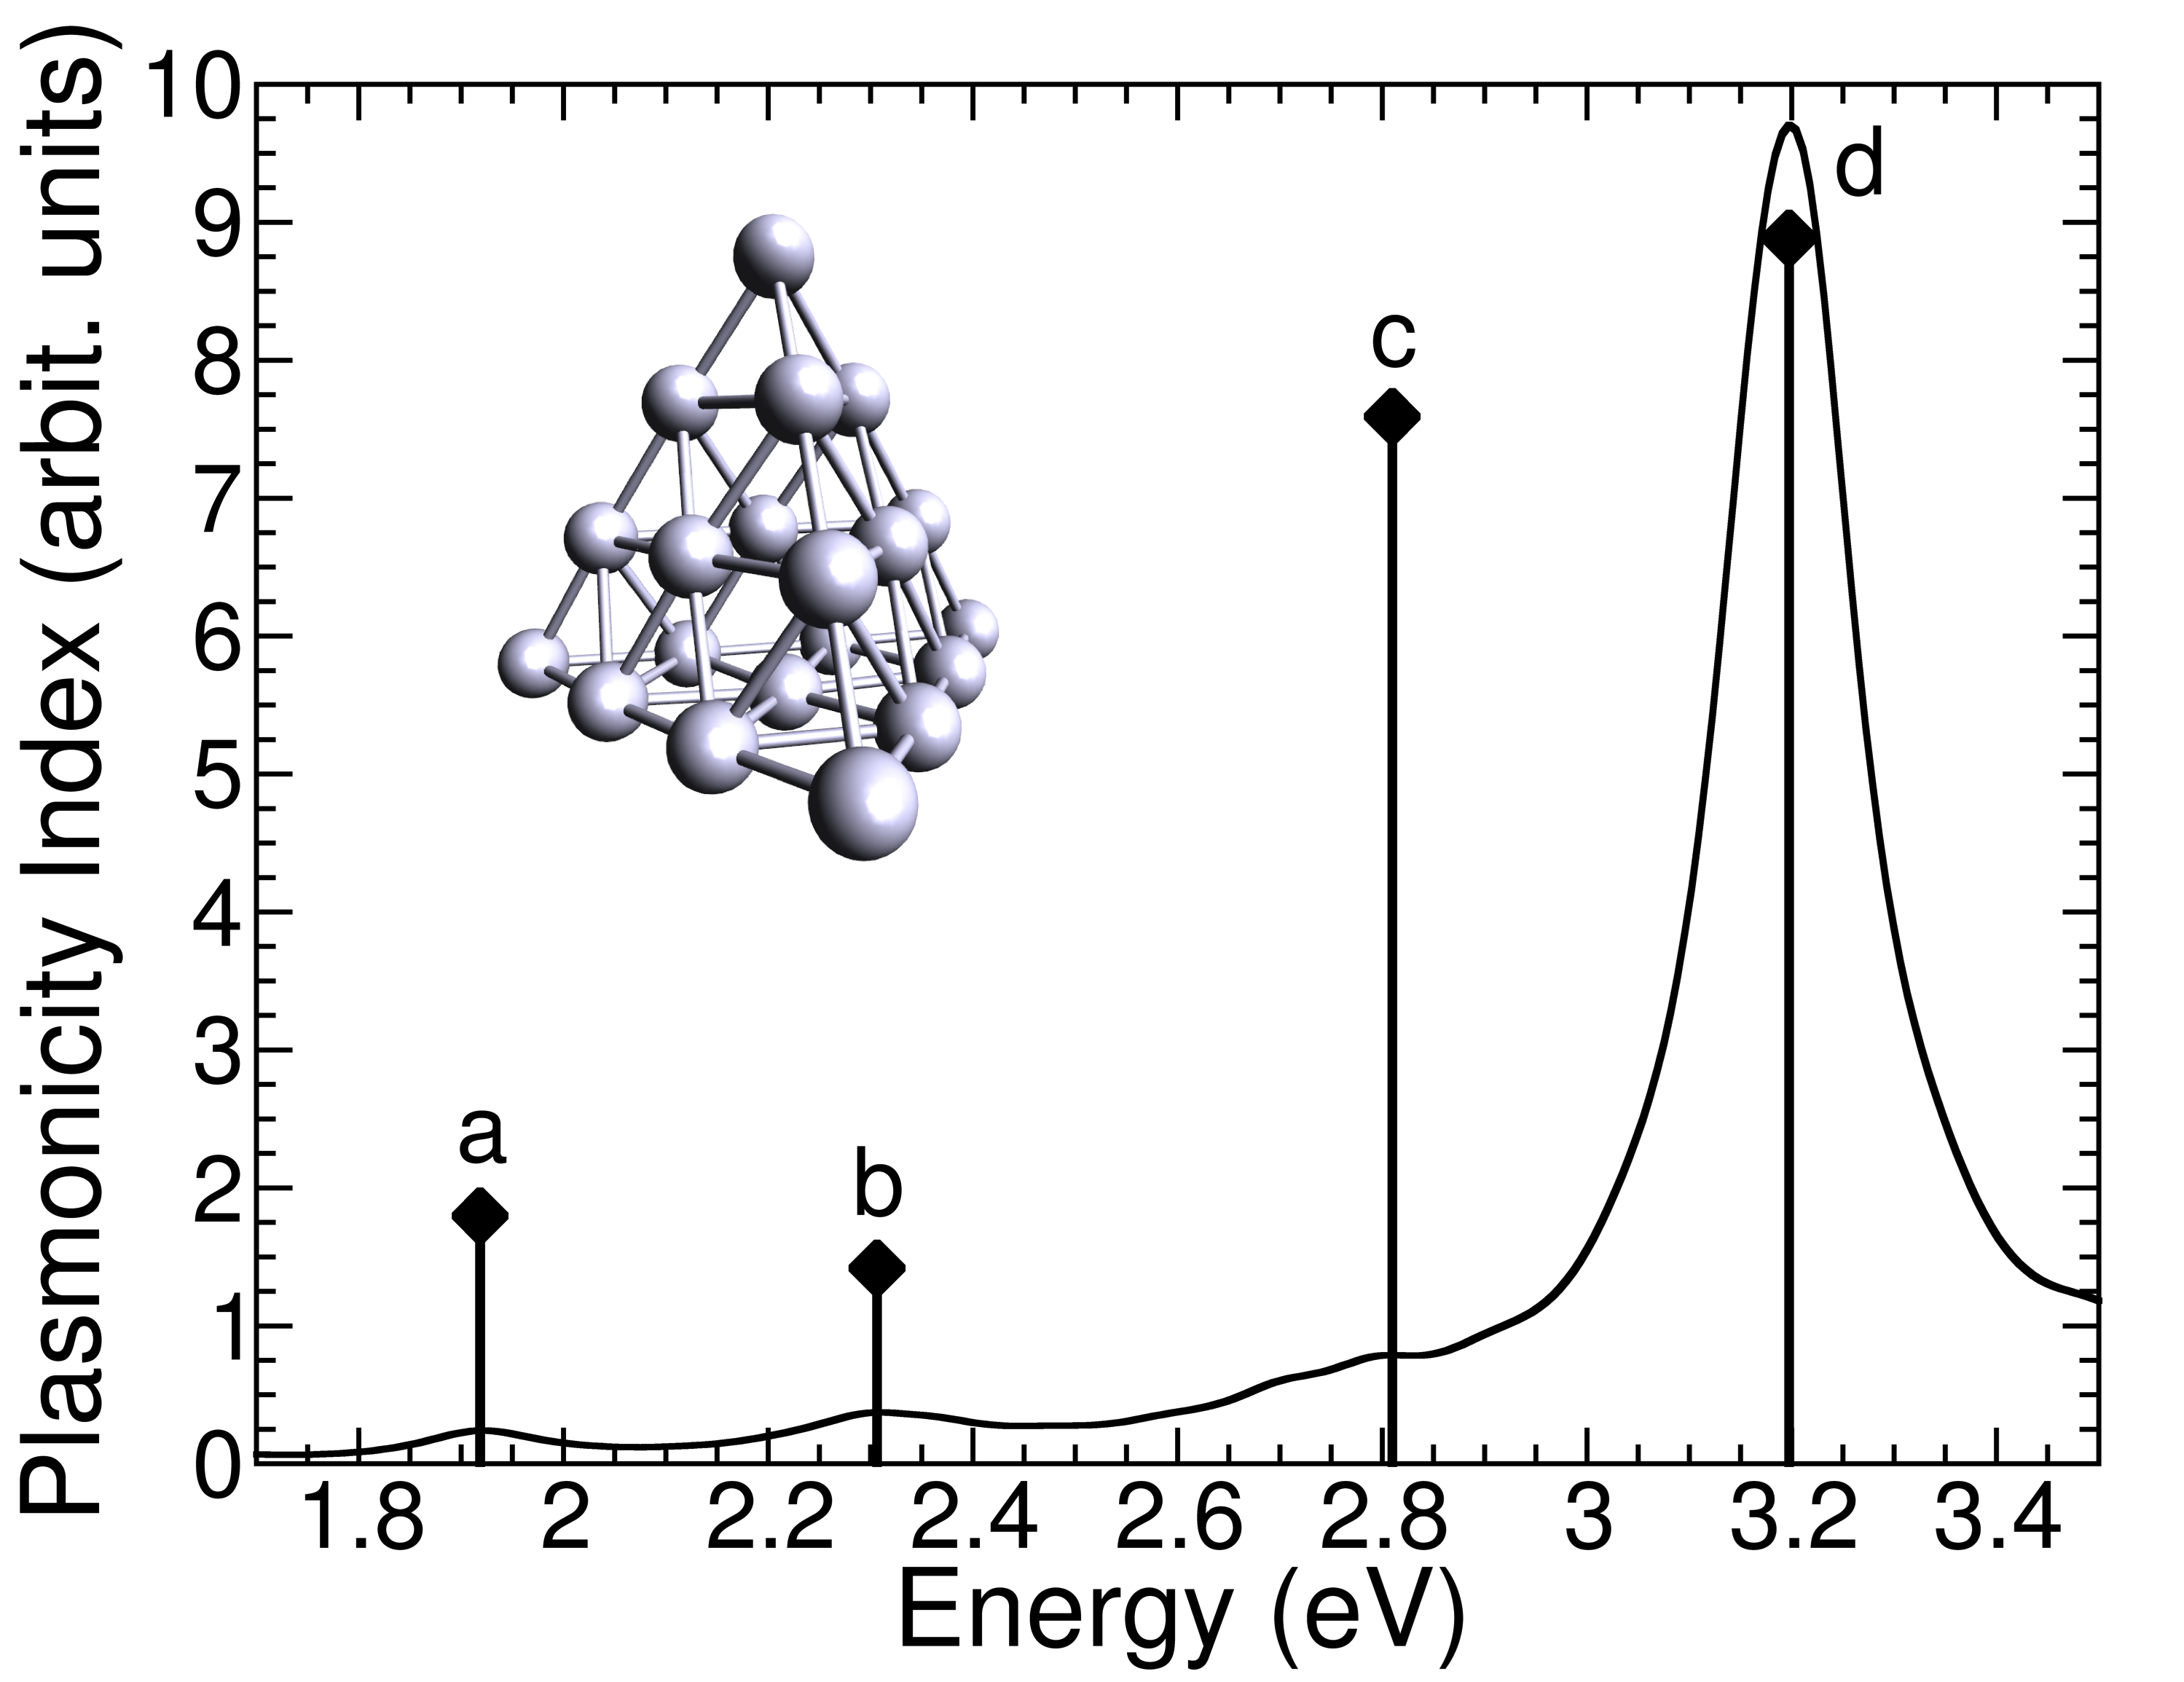
Ag20. is especially useful in the characterization of the plasmonic properties of systems where the visual inspection of the response charge density does not give straightforward indications, as the tetrahedral Ag20 cluster (the atomic structure is shown in the inset of Fig.3). The latter is a well known plasmonic systemBernadotte et al. (2013); Chen et al. (2013); Zhao et al. (2006), despite its small number of atoms. An intense peak dominates the low energy region of the adsorption spectrum of this cluster (see Fig.3) and, according to Bernadotte et al.Bernadotte et al. (2013), in correspondence to that peak, plasmonic and non-plasmonic excitations mix not allowing an easy identification of their character. In this case, the most plasmonic excitation, according to the index, is the one responsible for the most intense peak d, as expected, but also peak c shows an intense plasmonic character. This can be interpreted as a consequence of the mixed character of the excitation c, as discussed by Bernadotte et al.Bernadotte et al. (2013). But most importantly, this result demonstrates that the plasmonicity index provides a quantitative classification of the excitations which works also for an excitation showing a mixed character.
Ag20 pyridine. One of the objectives of the definition of is its application to hybrid systems mixing plasmonic and molecular components, where the analysis of the plasmonic properties is often not straightforward. To this aim, we considered Ag20 coupled to a pyridine molecule (the atomic structure is shown in the inset of Fig.4), which is a venerable model system for surface enhanced spectroscopyZhao et al. (2006). The TDDFT absorption spectra of Ag20, pyridine and Ag20 pyridine are shown in Fig.4 together with the plasmonicity index computed only for the most intense peaks in the spectra.
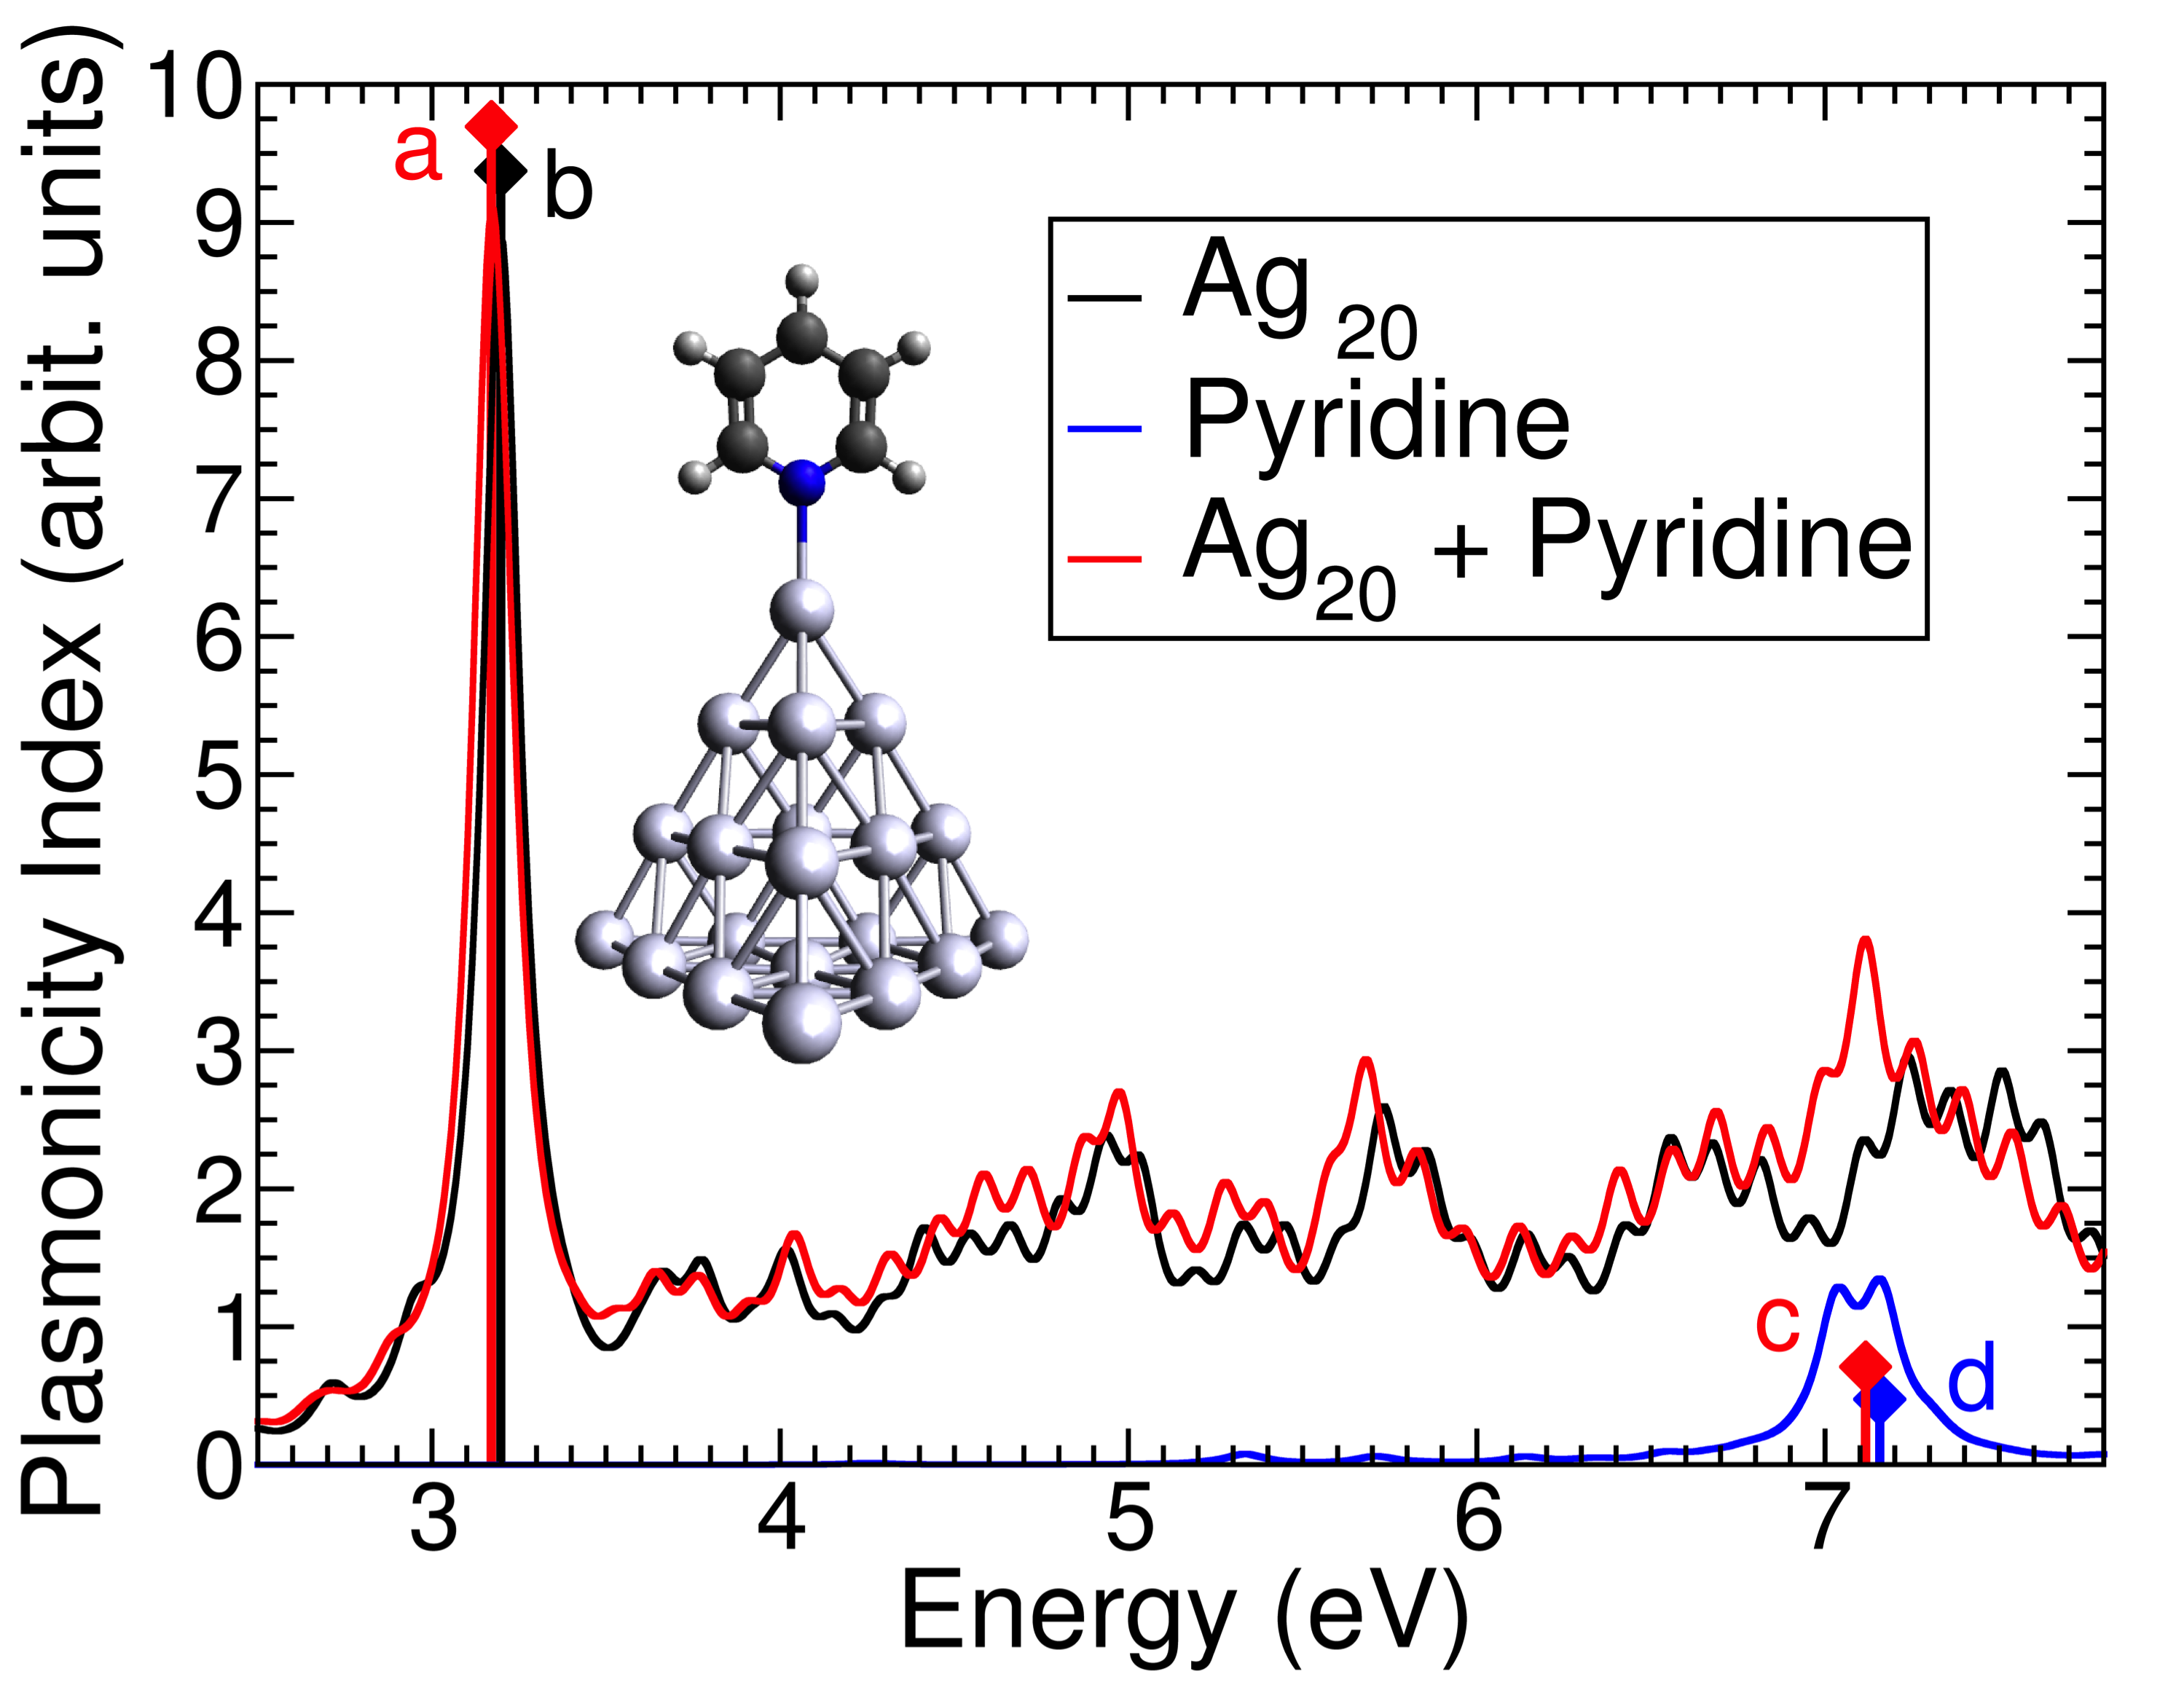
The index of the main absorption peak of the Ag20 cluster alone (peak b) is much larger compared to the index of the main absorption peak of pyridine alone (peak d). Thus, the classification in terms of the plasmonic character of the excitations provided by for the isolated systems is the intuitive one. When we compute the index for the corresponding peaks in the hybrid system (peaks a and c, respectively), we find that the intuitive classification is maintained, namely of a is close to of b and of c is close to of d, as expected.
In conclusion, we defined an index which quantifies the plasmonic character of the excitations in nanostructures exploiting directly the results of first principles simulations. Within this letter, we validated this plasmonicity index on a Na20 chain and on a naphthalene. We then used the index to characterize plasmonic properties of a Ag20 cluster, where excitations of a mixed character have been observed, and for a paradigmatic hybrid system. The results provided by allow to gain insights into the microscopic origin of the plasmonic resonances in small isolated and hybrid nanostructures, thus paving the way for applications to more complex systems whose plasmonic properties are not easily predictable a priori.
Computer resources were provided by the CINECA supercomputing center at their Fermi BG/Q machine through the ISCRA C PlasmInd project. The authors would like to thank in particular Nicola Spallanzani at CINECA for computational support.
References
- Tame et al. (2013) M. S. Tame, K. R. McEnery, Ş. K. Özdemir, J. Lee, S. A. Maier, and M. S. Kim, Nat. Phys. 9, 329 (2013).
- Savage et al. (2012) K. J. Savage, M. M. Hawkeye, R. Esteban, A. G. Borisov, J. Aizpurua, and J. J. Baumberg, Nature 491, 574 577 (2012).
- Linic et al. (2015) S. Linic, U. A. andCalvin Boerigter, and M. Morabito, Nature Mater. 14, 567 576 (2015).
- García de Abajo and Manjavacas (2015) F. J. García de Abajo and A. Manjavacas, Faraday Discuss. 178, 87 (2015).
- Alonso-González et al. (2014) P. Alonso-González, A. Y. Nikitin, F. Golmar, A. Centeno, A. Pesquera, S. Vélez, J. Chen, G. Navickaite, F. Koppens, A. Zurutuza, F. Casanova, L. E. Hueso, and R. Hillenbrand, Science 344, 1369 (2014).
- Halas et al. (2011) N. J. Halas, S. Lal, W.-S. Chang, S. Link, and P. Nordlander, Chem. Rev. 111, 3913 (2011).
- Li et al. (2015) W. Li, Z. J. Coppens, L. V. Besteiro, W. Wang, A. O. Govorov, and J. Valentine, Nature Comm. 6, 8379 (2015).
- Zheng et al. (2014) B. Y. Zheng, Y. Wang, P. Nordlander, and N. J. Halas, Adv. Mater. 26, 6318 6323 (2014).
- Atwater and Polman (2010) H. A. Atwater and A. Polman, Nat. Mater. 9, 205 (2010).
- Mayer and Hafner (2011) K. M. Mayer and J. H. Hafner, Chem. Rev. 111, 3828 (2011).
- Bernadotte et al. (2013) S. Bernadotte, F. Evers, and C. R. Jacob, J. Phys. Chem. C 117, 1863 (2013).
- de Abajo et al. (2015) F. J. G. de Abajo, R. Sapienza, M. Noginov, F. Benz, J. Baumberg, S. Maier, D. Graham, J. Aizpurua, T. Ebbesen, A. Pinchuk, J. Khurgin, K. Matczyszyn, J. T. Hugall, N. van Hulst, P. Dawson, C. Roberts, M. Nielsen, L. Bursi, M. Flatté, J. Yi, O. Hess, N. Engheta, M. Brongersma, V. Podolskiy, V. Shalaev, E. Narimanov, and A. Zayats, Faraday Discuss. 178, 123 (2015).
- (13) F. Wooten, Optical Properties of solids (Academic Press, Inc. San Diego CA, 9211 USA, 1972).
- (14) U. Kreibig and M. Vollmer, Optical Properties of Metal Clusters, Springer series in material science, Vol. 25 (Springer, Berlin, 1995).
- (15) F. della Sala and S. D’Agostino, Handbook of Molecular Plasmonics (Pan Stanford Publishing Pte. Ltd., 2013).
- Thongrattanasiri et al. (2012) S. Thongrattanasiri, A. Manjavacas, and F. J. García de Abajo, ACS Nano 6, 1766 (2012).
- Zhang et al. (2014) P. Zhang, J. Feist, A. Rubio, P. García-González, and F. J. García-Vidal, Phys. Rev. B 90, 161407(R) (2014).
- Zheng et al. (2015) B. Y. Zheng, H. Zhao, A. Manjavacas, M. McClain, P. Nordlander, and N. J. Halas, Nature Comm. 6, 7797 (2015).
- Guidez and Aikens (2013) E. B. Guidez and C. M. Aikens, J. Phys. Chem. C 117, 21466 (2013).
- Townsend and Bryant (2014) E. Townsend and G. W. Bryant, J. Opt. 16, 114022 (2014).
- Guidez and Aikens (2014) E. B. Guidez and C. M. Aikens, Nanoscale 6, 11512 (2014).
- Bursi et al. (2014) L. Bursi, A. Calzolari, S. Corni, and E. Molinari, ACS Photonics 1, 1049 (2014).
- Krauter et al. (2014) C. M. Krauter, J. Schirmer, C. R. Jacob, M. Pernpointner, and A. Dreuw, J. Chem. Phys. 141, 104101 (2014).
- Townsend et al. (2015) E. Townsend, A. Debrecht, and G. W. Bryant, J. Mater. Res. 30, 2389 (2015).
- (25) A. L. Fetter and J. D. Walecka, Quantum Theory of Many-Particle Systems (Dover Publications: Mineola, NY, 2003).
- (26) M. A. L. Marques, N. T. Maitra, F. M. S. Nogueira, E. K. U. Gross, and A. Rubio, (Eds.) Fundamentals of Time-Dependent Density Functional Theory, Springer series: Lecture Notes in Physics, Vol. 837 (Springer, Berlin, 2012).
- Egri (1985) I. Egri, Phys. Rep. 119, 363 (1985).
- (28) See Supplemental Material at [URL will be inserted by publisher].
- Yan et al. (2007) J. Yan, Z. Yuan, and S. Gao, Phys. Rev. Lett. 98, 216602 (2007).
- Chen et al. (2013) M. Chen, J. E. Dyer, K. Li, and D. A. Dixon, J. Phys. Chem. A 117, 8298 (2013).
- Manjavacas et al. (2013) A. Manjavacas, F. Marchesin, S. Thongrattanasiri, P. Koval, P. Nordlander, D. Sánchez-Portal, and F. J. García de Abajo, ACS Nano 7, 3635 (2013).
- Lauchner et al. (2015) A. Lauchner, A. E. Schlather, A. Manjavacas, Y. Cui, M. J. McClain, G. J. Stec, F. J. G. de Abajo, P. Nordlander, and N. J. Halas, Nano Lett. 15, 6208 (2015).
- Zhao et al. (2006) L. Zhao, L. Jensen, and G. Schatz, J. Am. Chem. Soc. 128, 2911 (2006).
- Giannozzi et al. (2009) P. Giannozzi, S. Baroni, N. Bonini, M. Calandra, R. Car, C. Cavazzoni, D. Ceresoli, G. L. Chiarotti, M. Cococcioni, I. Dabo, A. Dal Corso, S. de Gironcoli, S. Fabris, G. Fratesi, R. Gebauer, U. Gerstmann, C. Gougoussis, A. Kokalj, M. Lazzeri, L. Martin-Samos, N. Marzari, F. Mauri, R. Mazzarello, S. Paolini, A. Pasquarello, L. Paulatto, C. Sbraccia, S. Scandolo, G. Sclauzero, A. P. Seitsonen, A. Smogunov, P. Umari, and R. M. Wentzcovitch, J. Phys.: Condens. Matter 21, 395502 (2009).
- Perdew et al. (1996) J. Perdew, K. Burke, and M. Ernzerhof, Phys. Rev. Lett. 77, 3865 (1996).
- (36) The energy cutoff in the plane waves expansion of the single-particle wavefunctions and the charge density for the Na20 chain is 32 Ry and 384 Ry; for naphthalene, 25 Ry and 300 Ry; for the Ag20 cluster and the pyridine molecule, it is 33 Ry and 396 Ry, respectively.
- Ge et al. (2014) X. Ge, S. J. Binnie, D. Rocca, R. Gebauer, and S. Baroni, Comput. Phys. Commun. 185, 2080 (2014).