∎
ACCNLAlso at Accademia Navale di Livorno, Livorno, Italy \thankstextcorr1Corresponding author: biagi@bo.infn.it \thankstextcorr2Corresponding author: creusot@apc.in2p3.fr \thankstextcorr3Corresponding author: dosamt@nikhef.nl
[]t1The research leading to these results has received funding from the European Community Sixth Framework Programme under Contract 011937 and the Seventh Framework Programme under Grant Agreement 212525.
The prototype detection unit of the KM3NeT detector\thanksreft1
Abstract
A prototype detection unit of the KM3NeT deep-sea neutrino telescope has been installed at depth offshore the Italian coast. KM3NeT in its final configuration will contain several hundreds of detection units. Each detection unit is a mechanical structure anchored to the sea floor, held vertical by a submerged buoy and supporting optical modules for the detection of Cherenkov light emitted by charged secondary particles emerging from neutrino interactions. This prototype string implements three optical modules with 31 photomultiplier tubes each. These optical modules were developed by the KM3NeT Collaboration to enhance the detection capability of neutrino interactions. The prototype detection unit was operated since its deployment in May 2014 until its decommissioning in July 2015. Reconstruction of the particle trajectories from the data requires a nanosecond accuracy in the time calibration. A procedure for relative time calibration of the photomultiplier tubes contained in each optical module is described. This procedure is based on the measured coincidences produced in the sea by the 40K background light and can easily be expanded to a detector with several thousands of optical modules. The time offsets between the different optical modules are obtained using LED nanobeacons mounted inside them. A set of data corresponding to 600 hours of livetime was analysed. The results show good agreement with Monte Carlo simulations of the expected optical background and the signal from atmospheric muons. An almost background-free sample of muons was selected by filtering the time correlated signals on all the three optical modules. The zenith angle of the selected muons was reconstructed with a precision of about .
Keywords:
Deep-sea neutrino telescope Prototype Time calibration Atmospheric muons1 Introduction
Following the scientific results obtained with the ANTARES antares neutrino telescope and the experience from the NEMO nemo and NESTOR nestor pilot projects, the KM3NeT Collaboration has started the construction of the next generation deep-sea neutrino telescope in the Mediterranean Sea km3net . The main objectives of KM3NeT are the discovery and subsequent observation of high-energy neutrino sources in the Universe and the determination of the neutrino mass hierarchy. Neutrinos can interact with matter inside or in the vicinity of the detector producing secondary particles that can be detected through the Cherenkov light that they produce. Due to the long range in water, the conventional detection channel is given by muons produced in charged current interactions of muon neutrinos. Furthermore, KM3NeT will have significant sensitivity to all the neutrino interactions maarten ; luigi_icrc ; paolo_icrc .
The basic detection element of the neutrino telescope is the digital optical module (DOM), a 17-inch pressure resistant glass sphere containing 31 3-inch photomultiplier tubes (PMTs), a number of calibration devices and the read-out electronics. The multi-PMT design provides a large photocathode area ( per DOM expansion_cone ), good separation between single-photon and multiple-photon hits and information on the photon direction.
A group of 18 DOMs distributed in space along two thin ropes constitutes the essential part of a detection unit (DU). The bottom of the DU is anchored to the sea floor and is kept close to vertical by a submerged buoy. The DUs are connected to shore via a sea-bottom network of electro-optical cables and junction boxes. Data collected by the PMTs are digitised in the DOMs and sent to shore, where they are filtered by appropriate triggering algorithms. Accurate measurements of the light arrival times and charges and precise real-time knowledge of the positions and orientations of the PMTs are required for the accurate reconstruction of the direction of the secondary particles.
A prototype DOM (Pre Production Model DOM, PPM-DOM) was deployed in April 2013 at the ANTARES site, offshore the French coast close to Toulon, attached to one ANTARES line ppm-dom . This project has validated the DOM concept and technology demonstrating the capability of a single DOM to identify muons using time coincidences between PMTs inside one DOM.
In May 2014, a prototype detection unit (Pre Production Model DU, PPM-DU) with 3 DOMs was installed offshore the Sicilian coast. This prototype, unlike the PPM-DOM, implements the mechanical structure, the electro-optical connections and the data transmission system developed for the final DU design. In this configuration for the first time simultaneous data taking of several DOMs was proved in the deep sea. Through the study of correlated signals in different DOMs generated from LED nanobeacons and from atmospheric muons, a synchronisation at a nanosecond level between DOMs was obtained.
In this paper the main results obtained with this project are presented, using data collected between May 2014 and January 2015. In Section 2, an overview of the detector elements is given; the procedure of time calibration is described in Section 3; an evaluation of the optical background at the deployment site of the prototype is provided in Section 4; Monte Carlo (MC) simulation are presented in Section 5; the capability to identify the signals from muons and reconstruct their directions using inter-DOM coincidences is presented in Section 6.
2 Detector

The PPM-DU was deployed in May 2014 at sea depth in a location east of the Sicilian coast at Capo Passero (latitude , longitude ). The long PPM-DU comprises three DOMs with a vertical separation of . It is anchored on the sea bottom and is kept taut by the buoyancy of the DOMs and two top flotation spheres (Fig. 1). The PPM-DU base is connected via an electro-optical cable to the cable termination frame of the main electro-optical cable of the sea-bed network. This long cable bridges the distance between the deep sea infrastructure and the shore station for power distribution and data transmission.
2.1 The DOMs
The three DOMs of the PPM-DU contain two different types of PMTs with similar performance but slightly different dimensions. The PMT model installed in DOM 1 and DOM 2 is the D783KFLA produced by ETEL vlvnt1 , while DOM 3 contains the R12199-02 Hamamatsu PMTs vlvnt2 . The nominal diameter of the cathode area for the ETEL PMT is and for the Hamamatsu PMT . Inside the DOM, the PMTs are surrounded by reflector rings at an angle of 45 degrees with respect to the PMT axis, in width for ETEL and for the Hamamatsu PMTs expansion_cone . The PMTs are operated at a gain of with an intrinsic dark count rate in the range , as measured in the laboratory at room temperature with a threshold of 0.3 photoelectrons (p.e.). Two PMTs channels, one in DOM 2 and one in DOM 3, were not functional.
Each DOM contains the electronics boards and a power conversion board to readout, control and power all the PMTs, as well as sensors for acoustic measurements and the monitoring of environmental conditions ppmdu . A LED nanobeacon nanobeacon with a wavelength of is installed in the upper part of each DOM, pointing upwards. The intensity and frequency of flashing of the LED nanobeacon signals are controlled from shore.
2.2 String design
A schematic of the PPM-DU is shown in Fig. 1. The three DOMs are attached to two thin parallel Dyneema® ropes (inset of Fig. 1). A vertical electro-optical cable (VEOC), an oil filled plastic tube containing copper wires and optical fibres for power and data transmission, is attached to the ropes and provides breakouts to each DOM. Additional empty spheres at the top of the string increase the buoyancy for keeping the string close to vertical. The base anchors the string to the sea bottom and houses a power converter and fibre-optic components.
The PPM-DU was mounted on a launcher vehicle and deployed on the sea bottom. The launcher vehicle is a spherical structure with a diameter of designed to accommodate and deploy a full-size DU of KM3NeT LOM . Once on the sea bottom, an acoustic release initiates the unfurling of the string, and the launcher vehicle floats to the surface to be recovered. Connection of the string to the under-sea infrastructure is performed by means of a Remotely Operated Vehicle (ROV).
2.3 Data acquisition
The detector readout follows the “all-data-to-shore” approach all_data_to_shore . The readout electronics board (Central Logic Board, CLB clb ) inside the DOM provides for the data acquisition and communication with the shore station. Each DOM is an IP node in an Ethernet network. The information recorded from a PMT consists of the start time and the time over threshold (ToT). The start time is defined as the time at which the pulse passes beyond a threshold and the ToT is the time the pulse remains above this threshold. The ToT signals from the PMTs pass to the CLB where they are time stamped and arranged in timeslices of . Data are transferred to shore via the optical fibre network. Onshore, the physics events are filtered from the background by an online trigger algorithm and stored on disk. The Level-1 trigger is defined as two hits in a DOM in separate PMTs, with a time difference smaller than (L1 hit). A physics event is triggered grouping all L1 hits with a time difference smaller than which is consistent with signals from particles passing in the vicinity of the detector. In addition to the physics events, summary data containing all the singles PMT rates are recorded and stored on disk.
The first four months of data taking were used to test the system and optimise the operation which results in an average livetime of . The dead-time is due to the necessary periodic initialisations of the CLB and the transfer of data from the PC acquiring the data to another location for further filtering and distribution which cannot happen simultaneously with data taking in this prototype. Both issues are resolved in the design of the full-scale KM3NeT detector.
3 Time calibration
A time calibration at a nanosecond level is necessary to achieve the envisaged angular resolution for a neutrino telescope. For this, the following time offsets have to be determined:
-
•
Intra-DOM time offsets (between PMTs in the same DOM) that primarily depend on the PMT transit time;
-
•
Inter-DOM time offsets (between DOMs) that primarily depend on the cable lengths.
For the intra-DOM offsets signals from 40K decays are exploited, while for the inter-DOM time offsets calibration runs with the LED nanobeacons are used.
3.1 Intra-DOM calibration
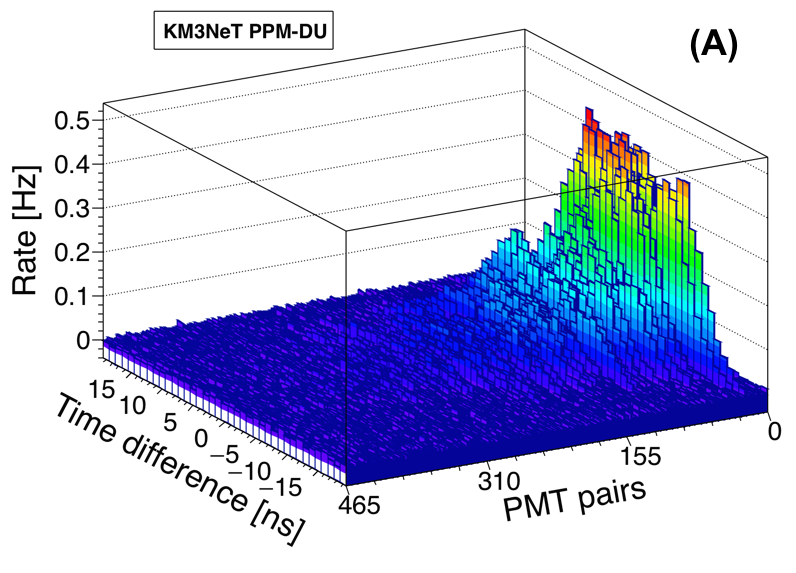
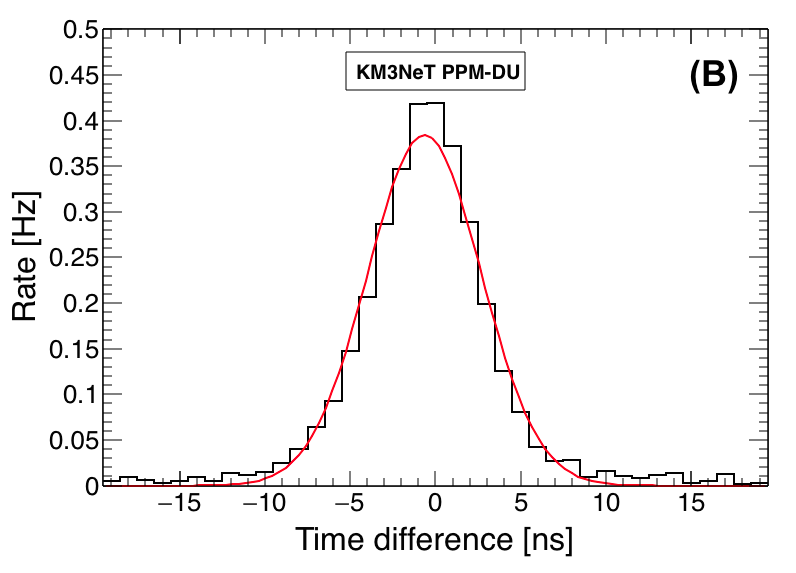
Radioactive decays of 40K present in sea water typically produce up to 150 Cherenkov photons per decay zaborov_antares . These decays are the main source of the singles rates observed in the PMTs. A single decay occurring in the vicinity of the DOM has a chance to produce a genuine coincidence between signals of different PMTs, which can be exploited for time calibration of the DOM. The procedure to obtain the time offsets between PMTs in one DOM from the signal time coincidences follows the approach described in Ref. ppm-dom . The distributions of time differences between signals detected in different PMTs in the same DOM are studied as a function of the angular separation of the PMTs involved. The distribution of hit time differences between all possible combinations of PMT pairs are assumed to follow a Gaussian shape. For each DOM with =31 PMTs, a total of distributions are produced and shown in Fig. 2a for DOM 1. In the figure, the numbers of PMT pairs are ordered according to their angular separation. The correlation peak decreases as the angular separation increases due to the limited field of view of each PMT. An example of time differences between two adjacent PMTs of DOM 1 is given in Fig. 2b. To obtain the rate of coincidences shown in the figure, the flat combinatorial background due to uncorrelated hits on the two PMTs has been subtracted. These distributions are well fitted by a Gaussian function. The mean values, heights and widths of the Gaussian peaks are related to the time offsets, detection efficiencies and intrinsic time-spreads of all the PMTs. Typically, a FWHM of is found for all different PMT pairs, mostly reflecting the intrinsic PMT transit time spread of up to at FWHM.
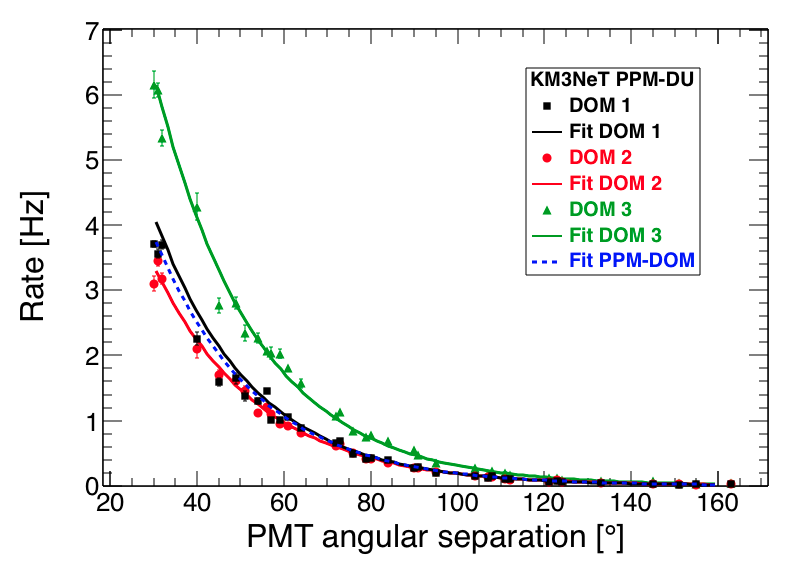
The twofold coincidence rate is shown as a function of the angular separation between pairs of PMTs in Fig. 3 for the three DOMs of the PPM-DU. The angular dependence for all PMT pairs can be fitted to an exponential function as shown in Fig. 3. The scattering of data points is partially due to the slightly different PMT efficiencies. The significantly higher rate of DOM 3 can be explained as the Hamamatsu PMTs have larger photo-cathode area and larger reflector rings. Data from the PPM-DOM have been analysed using the same procedure adopted in this work and shown in Fig. 3 for comparison.
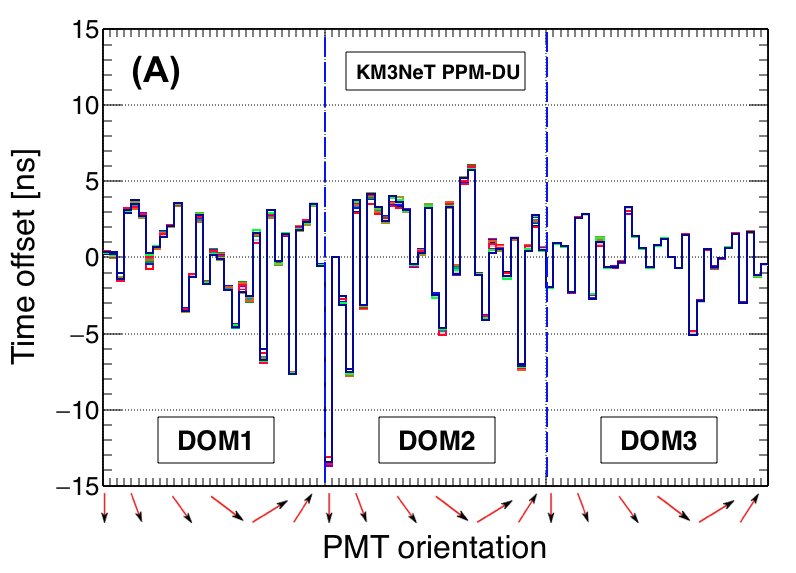
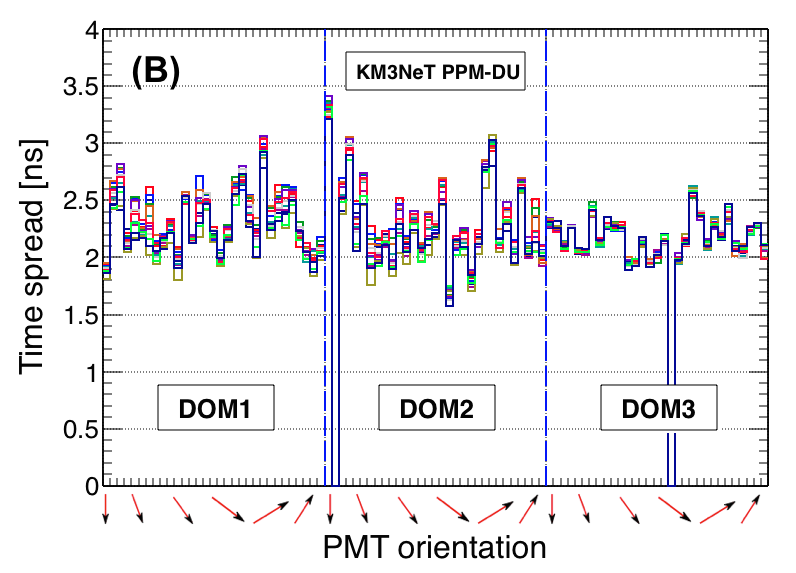
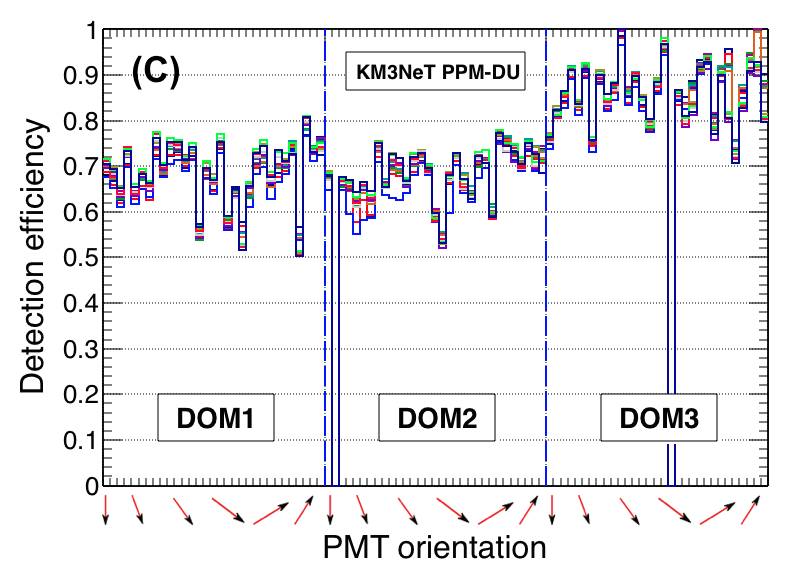
Assuming the exponential angular dependence of the coincidence rates due to 40K reported for each DOM in Fig. 3, a minimisation procedure is applied to obtain simultaneously the relative time offsets, the detection efficiencies and the intrinsic time-spreads of all PMTs in a DOM. The results of the fitting procedure are shown in Fig. 4 for 13 different physics data runs randomly selected. It is observed that the relative time offsets and PMT detection efficiencies are stable over time scales of months. The resulting relative time offsets are found to be mostly less than . The relative time offsets obtained with this method are stable in time within . The relative detection efficiencies of the same PMT type differ by less than 10% and are stable in time within 3%.
3.2 Inter-DOM calibration
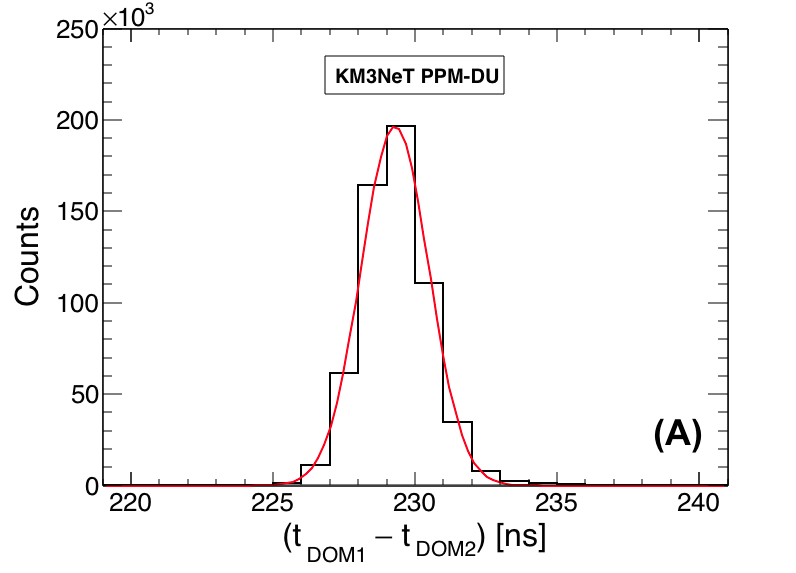
LED nanobeacon runs are used to calculate the inter-DOM time offsets. The time differences between pairs of DOMs are calibrated in runs in which the LED nanobeacon of the lowest DOM is operated. The results are cross checked with results from data where the LED nanobeacon of the middle DOM is operated and good consistency is found. The distribution of time differences of coincident hits on the DOM with the nanobeacon and the DOM to be calibrated are corrected for the travel time of light in the sea water. The distribution is then fitted with a Gaussian function as shown in Fig. 5a. For the travel time of light, a fixed distance between the nanobeacon and the hit PMT is used. In the calculation, the group velocity of light (nanobeacon wavelength) in water is used. The histogram of time differences between DOM 1 and 2 is shown in Fig. 5a.
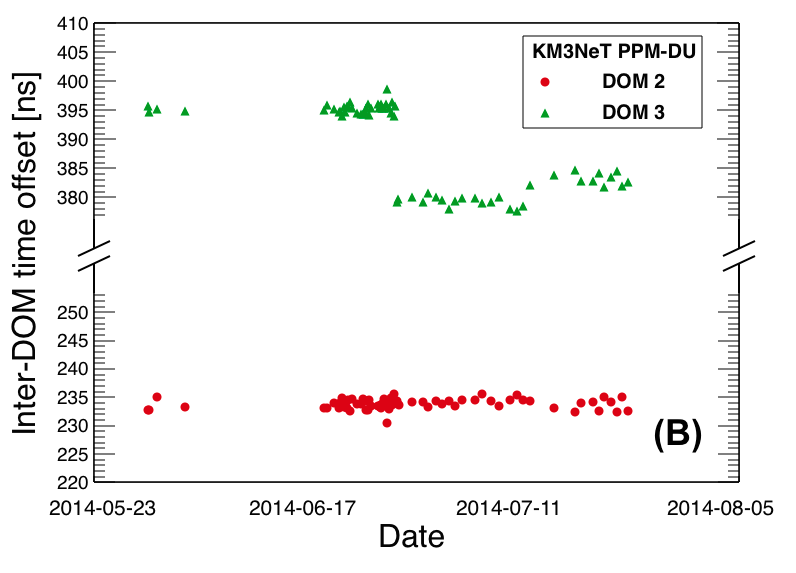
The resulting mean time offsets per run for DOM 2 and 3 with respect to DOM 1 are shown in Fig. 5b. The changes in the time offset of DOM 3 are due to power cycles of the corresponding module in the shore station. Shifts of this size are to be expected in the prototype as a full time synchronisation is not implemented. No time offset shifts were observed within constantly powered periods. The values obtained with this procedure are stable to within a few nanoseconds over a stable period of data taking. The calibration using nanobeacons was cross checked with an alternative calibration procedure using the signal from muons. Agreement within was found (see Sect. 6.2).
4 Singles and multi-fold coincidence rates
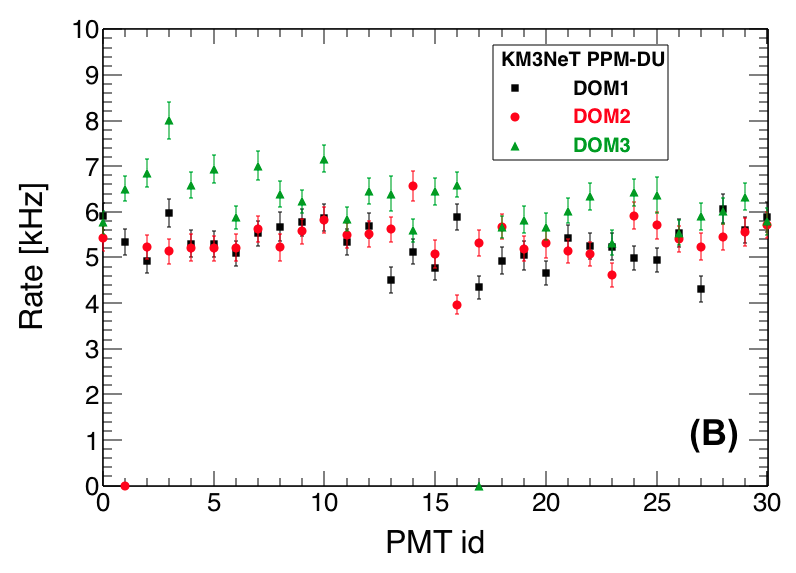
The two main contributions to the singles rates are the 40K decay and the bioluminescence activity. While the 40K decay is stable as a function of time and location in the detector, the bioluminescence activity can fluctuate significantly in time. The distribution of the average singles rate per timeslice of for one PMT of DOM 1 is shown in Fig. 6a. There are two easily identifiable contributions to the rate: a Gaussian distribution peaking at and a high frequency tail. The Gaussian peak is mainly due to 40K decays. In Fig. 6b, the mean values of the Gaussian fit are plotted for all PMTs of the three DOMs. The horizontal axis refers to the PMT numbering scheme, with PMT 0 looking down, the next 6 PMTs being the ones in the lower ring, followed by those PMTs in subsequent rings. The value of each data point corresponds to the mean of the Gaussian fit, and the error reflects the standard deviation of the fit. The average values for each DOM are given in Table 1. The singles rates are consistent with a fit of an exponential function to the distribution of time differences between consecutive hits, indicating that most of the singles rates is due to random background.

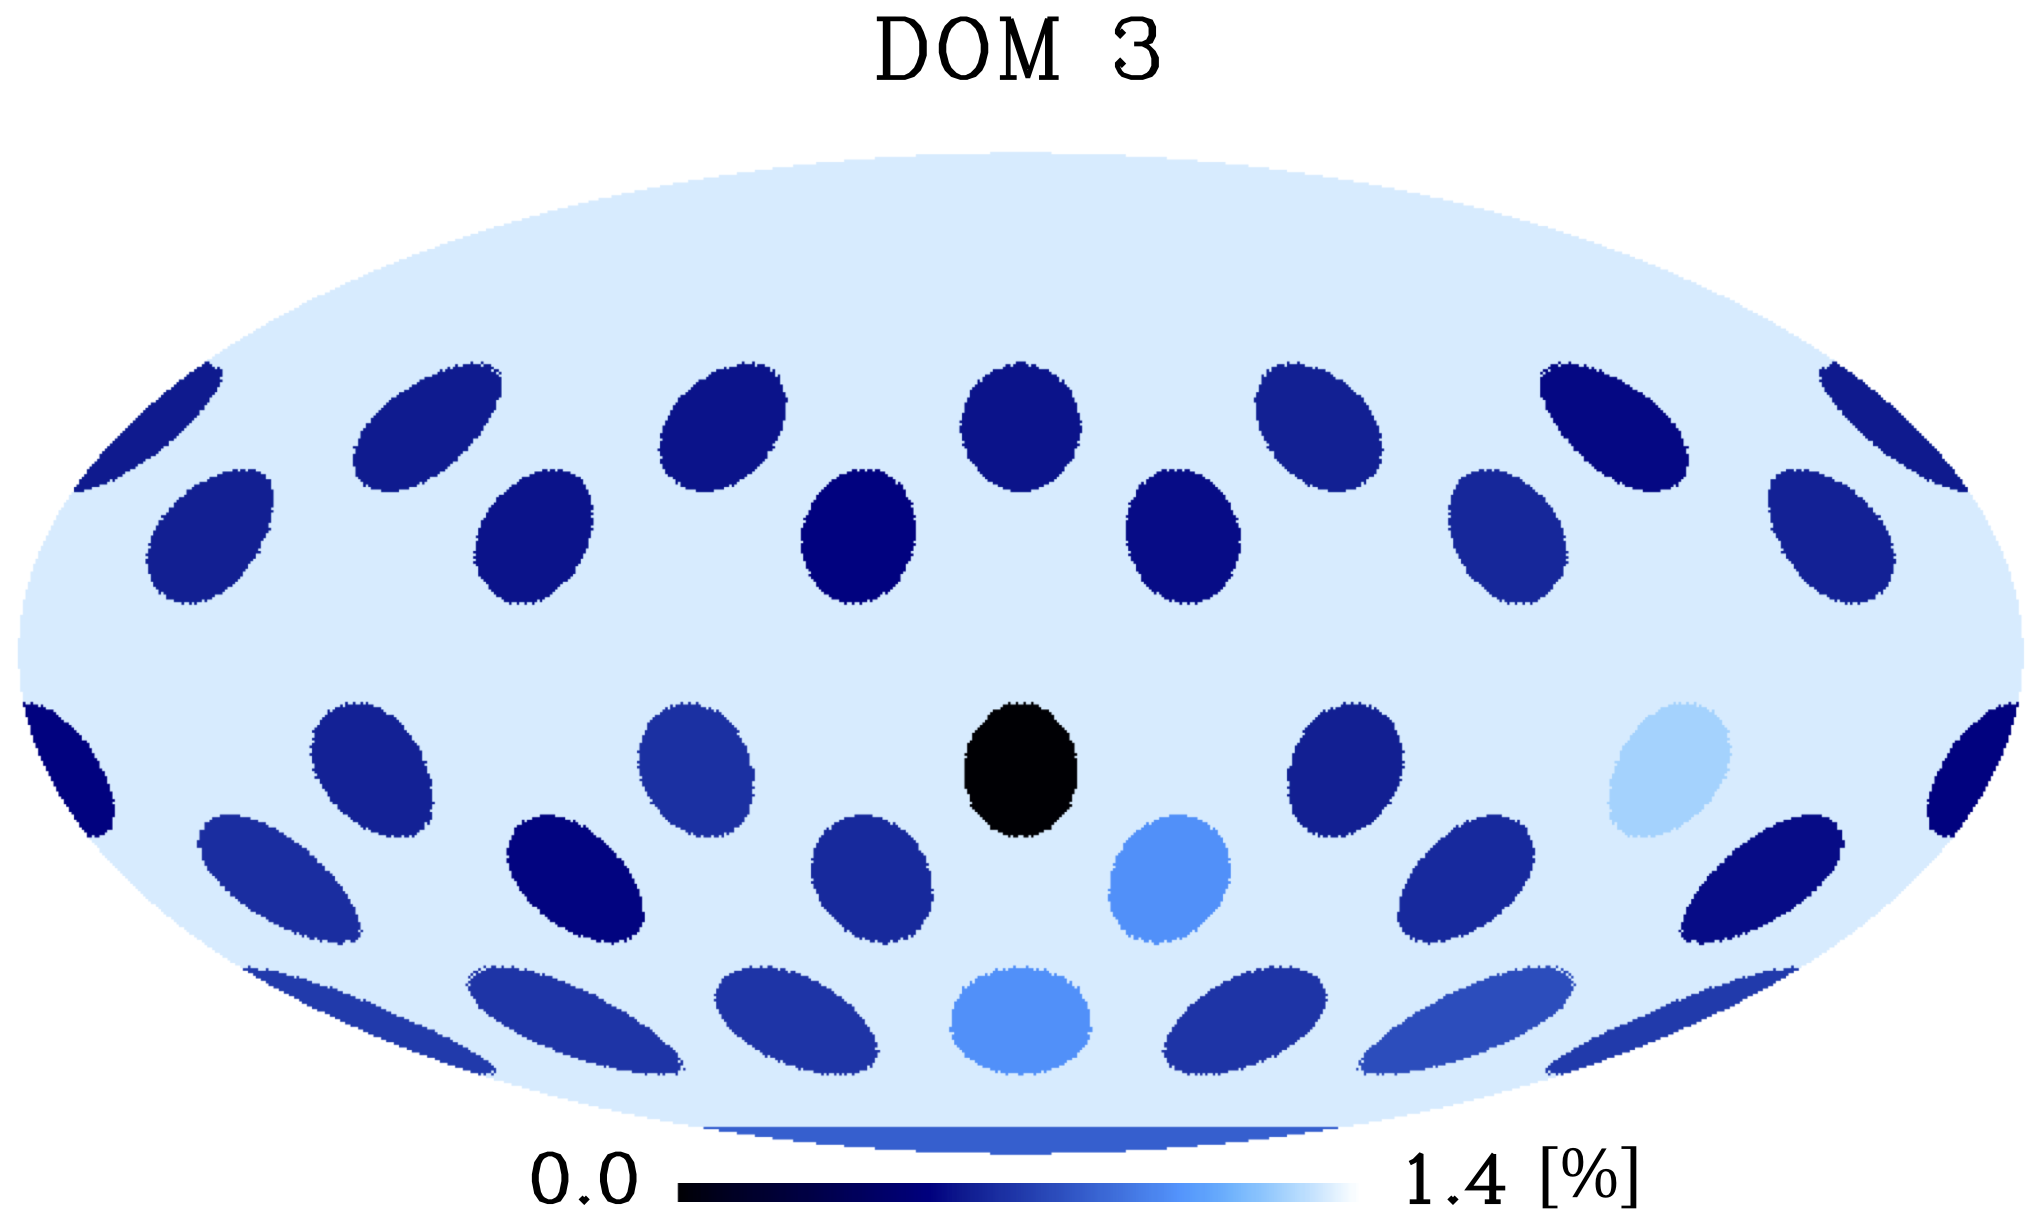
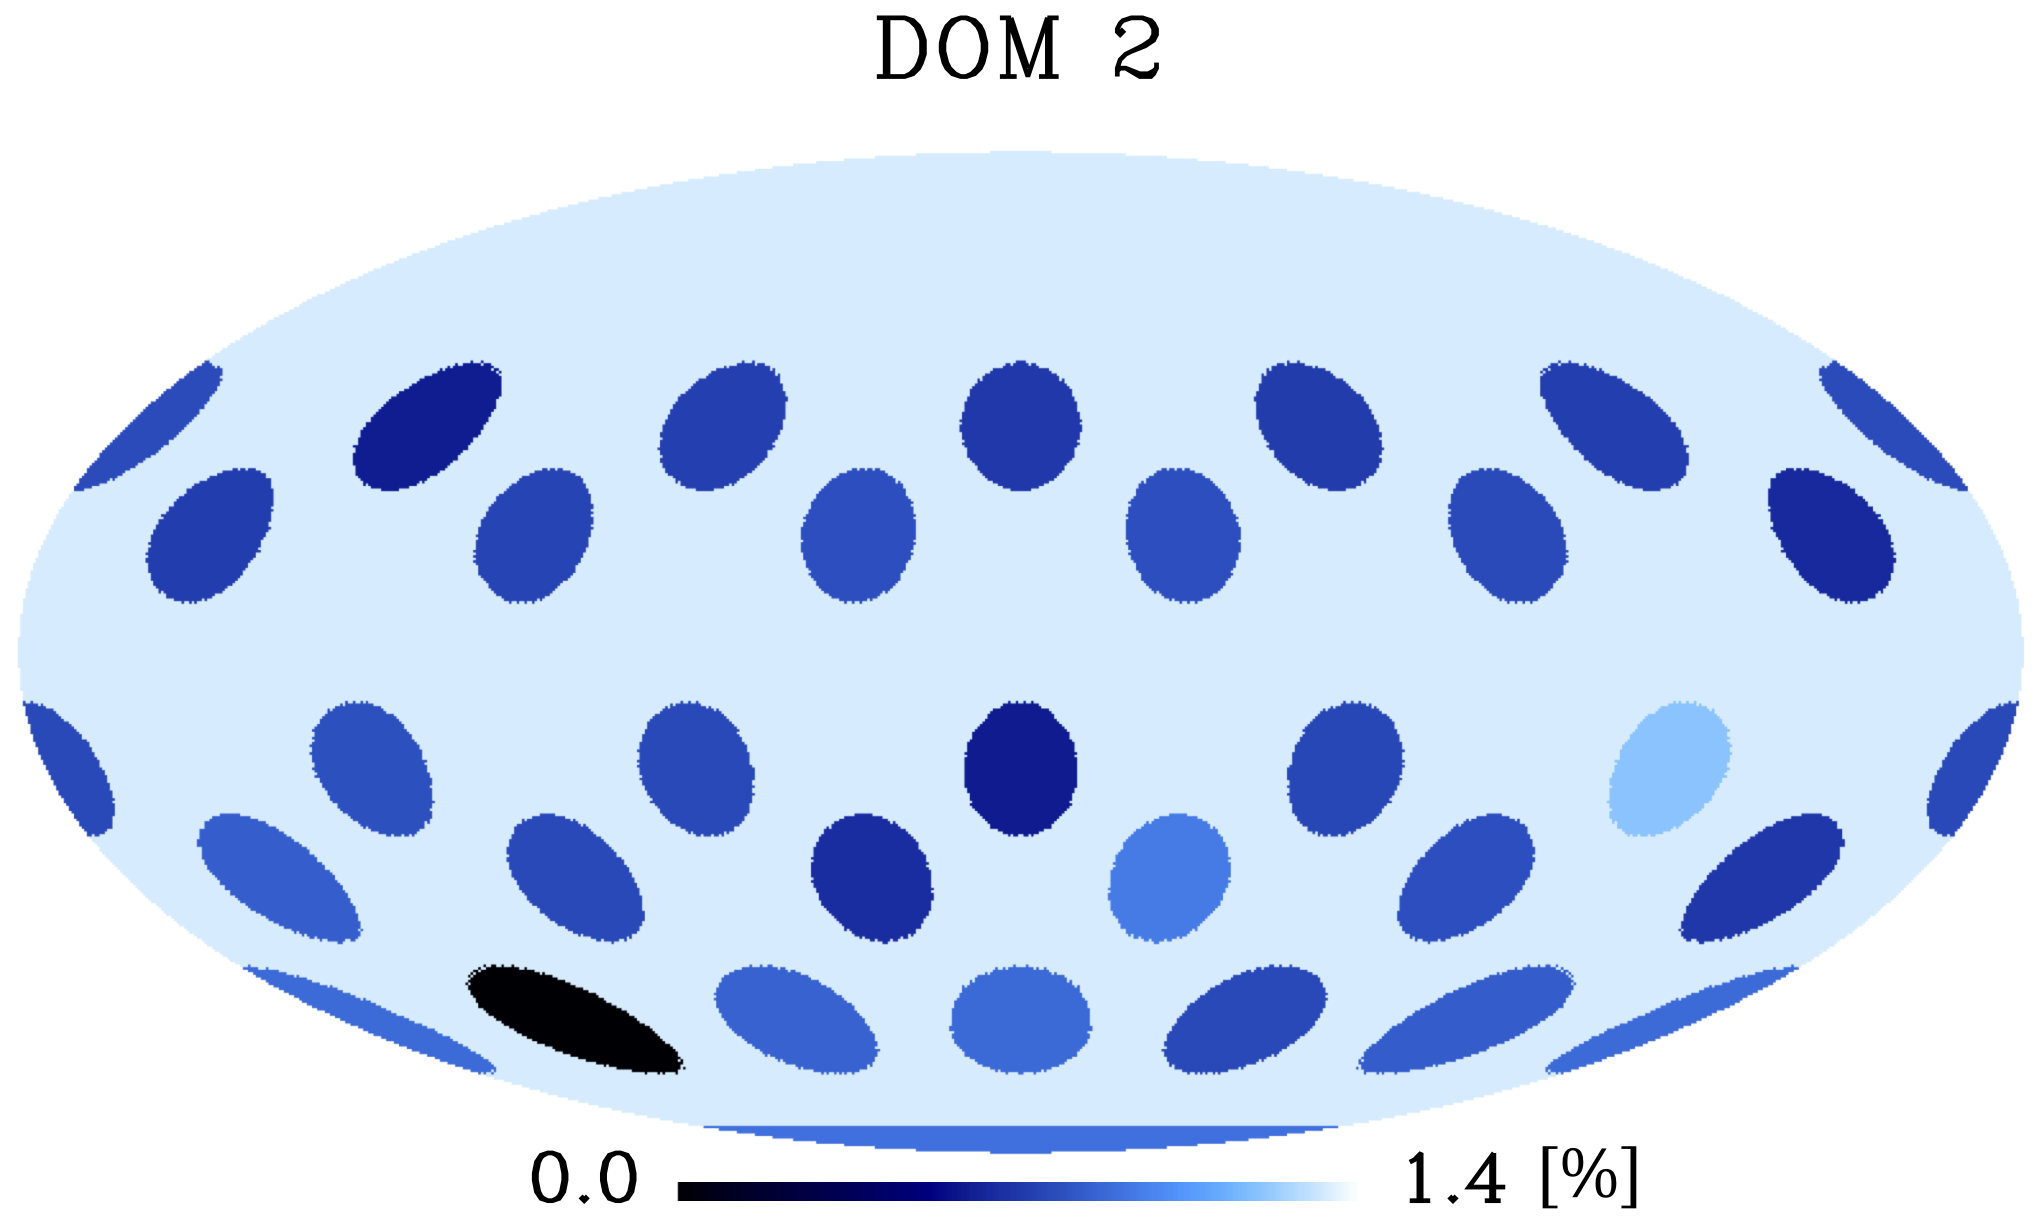
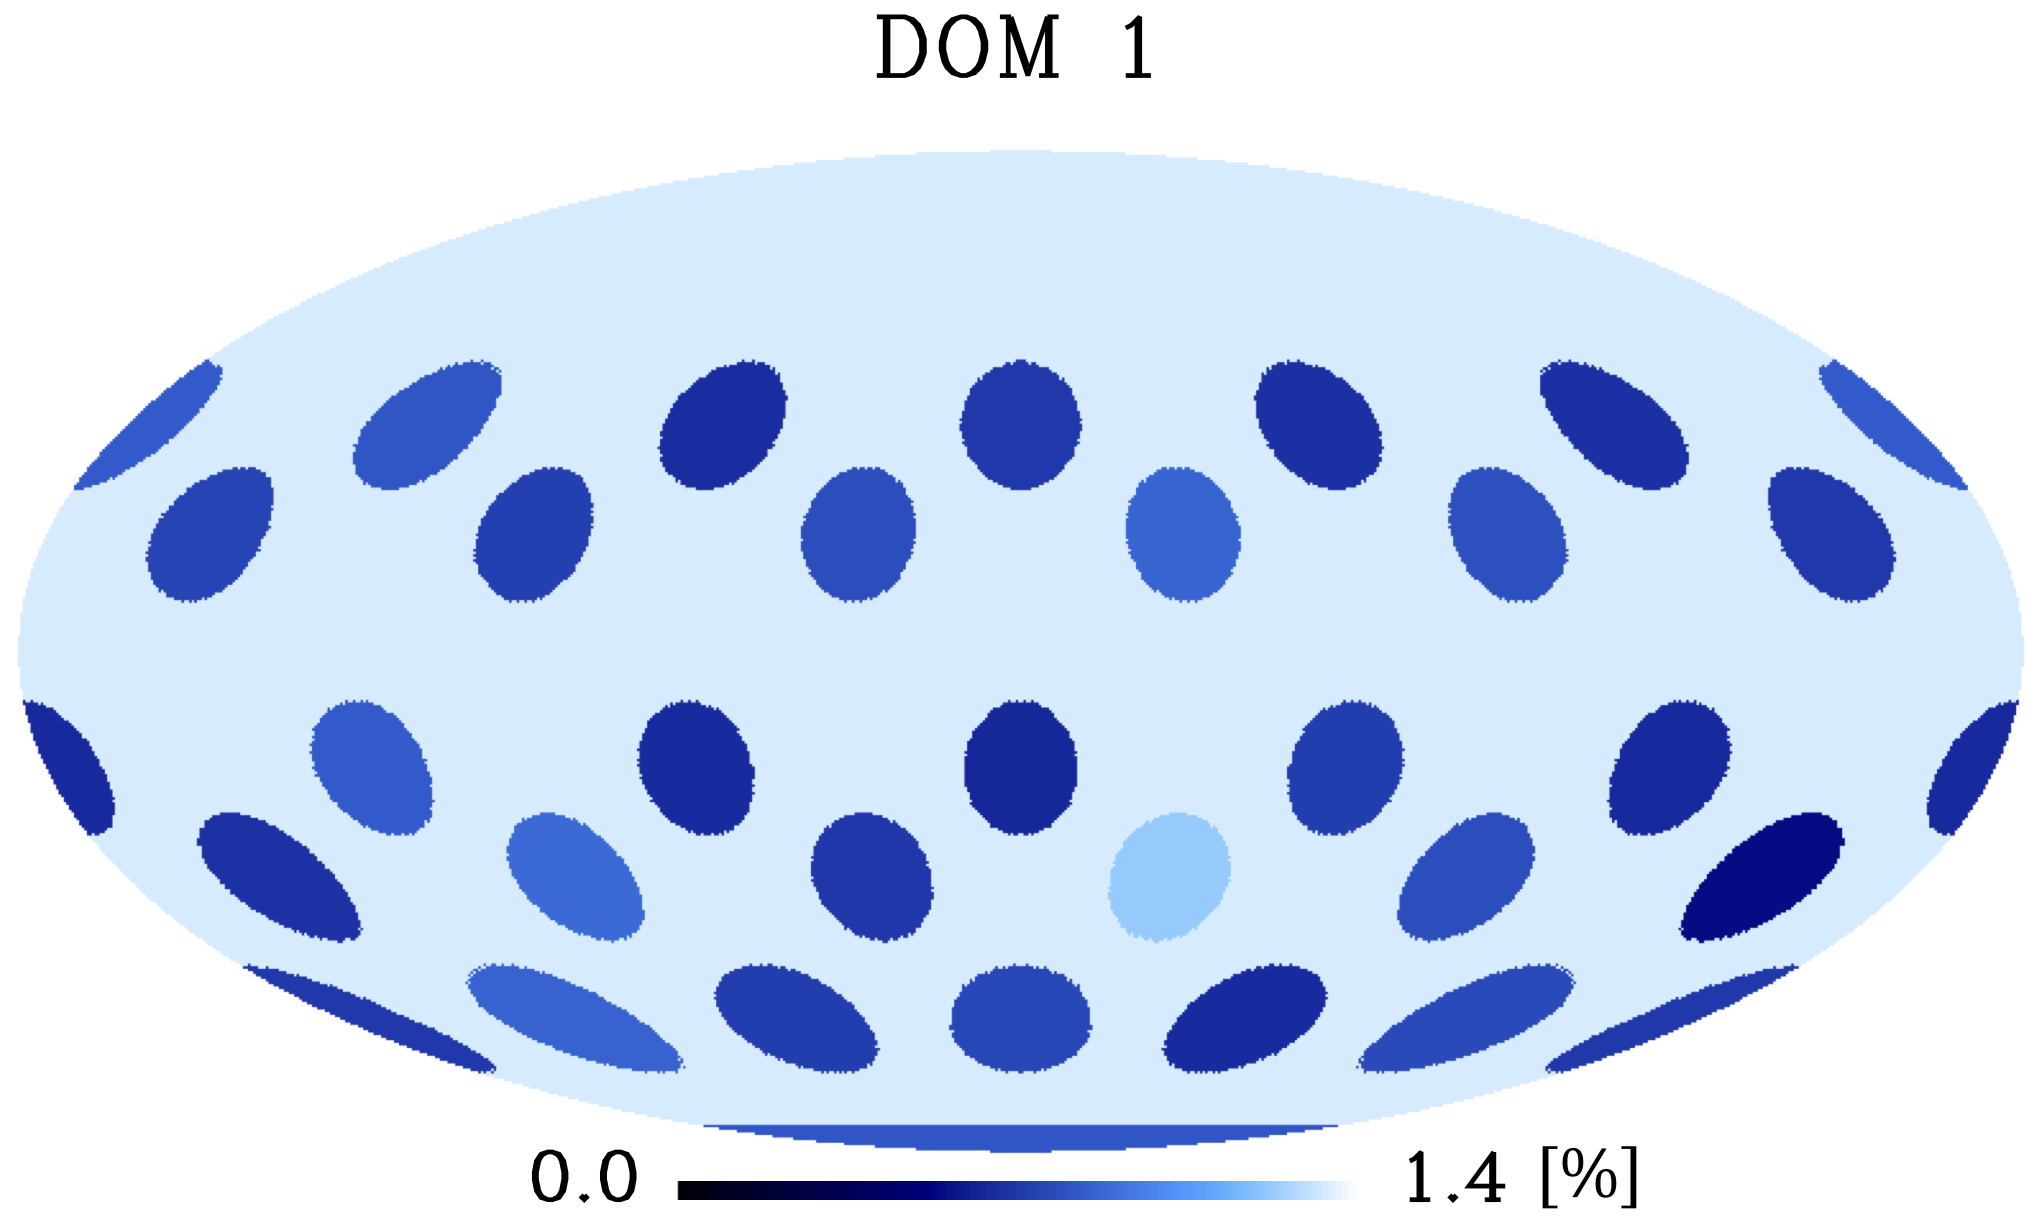
The second contribution in the histogram of Fig. 6a is due to sporadic bioluminescence background. It corresponds to timeslices with a high hit rate, typically three or more standard deviations above the mean of the Gaussian peak. These noisy timeslices are used to define the burst fraction as the ratio of the number of noisy slices to the total number of slices. The burst fraction for each DOM is shown in the three plots of Fig. 7. Contrary to what has been observed with the PPM-DOM, where the spatial distribution of the bioluminescence activity was attributed to the presence of the support structure of the PPM-DOM ppm-dom , there is no pattern in the spatial distribution of the bursts over the DOMs. The bioluminescence sporadic activity is thus homogeneous in the DOM vicinity.
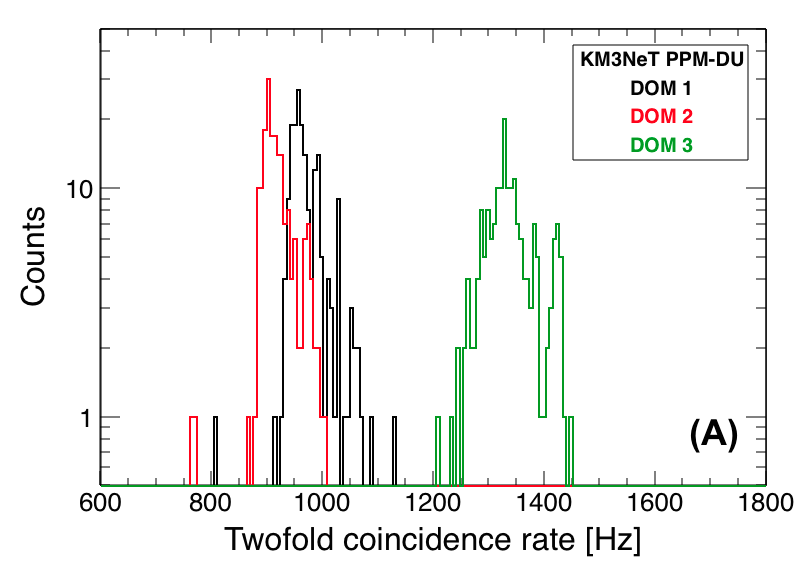
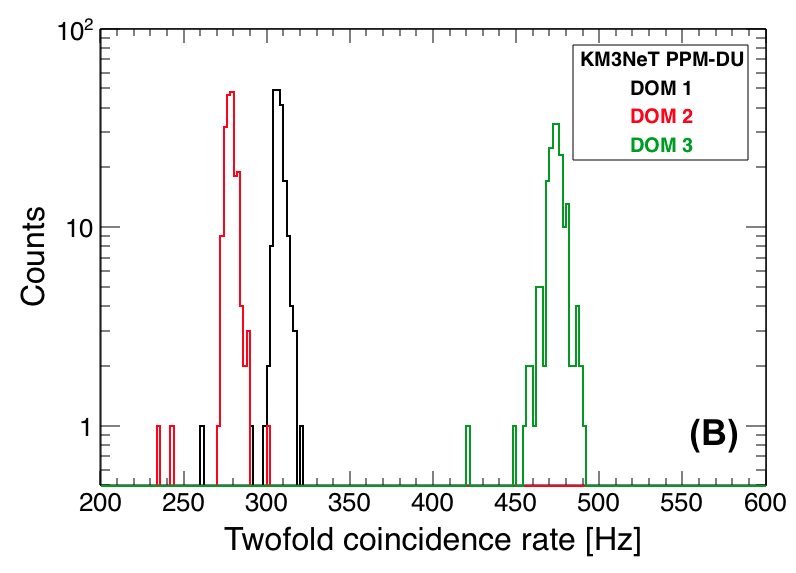
The distribution of the twofold coincidence rates (one entry per run) in a coincidence window of is shown in Fig. 8 before (a) and after (b) combinatorial background subtraction. The rate of coincidences due to combinatorial background is estimated through Monte Carlo simulations assuming the PMT singles rates recorded in the summary data. Scrambled data samples are simulated randomising the hit time within the timeslice and the rate of combinatorial background is obtained. The average value for each distribution after background subtraction is given in Table 1. The rate was found to be stable over the observation time of seven months within a few percent. The combinatorial background did not show major variations. The differences between the DOMs are due to the different PMT efficiencies which enter here in square.
Higher than twofold coincidences have also been studied. The average values after combinatorial background subtraction for three- to sixfold and higher coincidences are given in Table 1 for the three DOMs of the PPM-DU. The ratio between the DOM rates is expected to reflect the ratio between the DOM efficiencies to the power of the coincidence multiplicity. This is approximately the case up to a coincidence multiplicity of five. Above this value, the signal on PMTs is not due to processes (like 40K decay) predominantly producing single photoelectrons and this relation does not hold anymore. It is worth mentioning that above a coincidence multiplicity of three the combinatorial background becomes negligible.
| Coincidences | DOM 1 [Hz] | DOM 2 [Hz] | DOM 3 [Hz] |
|---|---|---|---|
| Single | |||
| 2-fold | |||
| 3-fold | |||
| 4-fold | |||
| 5-fold | |||
| 6-fold | |||
| 6-fold |
5 Monte Carlo simulation
A detailed Monte Carlo simulation of atmospheric muons has been performed, taking into account the relevant physics processes and the detector response. Cosmic rays entering the atmosphere produce extensive air showers containing high-energy muons. Although the sea water above the detector serves as a shield, many of these muons reach the detector, constituting the source of physics signals for the PPM-DU. The simulation framework is based on the ANTARES software ANTsoftware , modified to take into account the DOM properties. The simulation chain consists of the generation of atmospheric muons, their propagation in sea water, the generation and propagation of Cherenkov light, the 40K and bioluminescence background and the digitisation of the PMT signals. The simulation is based on a fixed detector geometry. The optical properties of the sea water and the PMT characteristics are taken into account in the simulation. The depth of the deployed string and the optical water properties measured at the Capo Passero site have been used KM3NeT_TDR .
Atmospheric muons were generated with the fast MUPAGE code MUPAGE . This code provides a parameterisation of the underwater flux of atmospheric muons including multi-muon events (muon bundles) based on a full Monte Carlo simulation of primary cosmic ray interactions and shower propagation in the atmosphere. Atmospheric muons were generated with energy , where is the sum of the energies of the muons in the bundle. A sample statistically equivalent to a live time of 15.3 days was generated.
The generated muons were tracked in sea water with the code KM3 ANTsoftware . This program uses tabulated results from full GEANT3.21 simulations of relativistic muons and electromagnetic cascades in sea water to generate the number of Cherenkov photons detected by the PMTs. The simulation takes into account the full wavelength dependence of Cherenkov light production, propagation, scattering and absorption in sea water, the response of the PMTs, including absorption in the glass and the optical gel, the PMT quantum efficiency, and the reduced effective area for photons arriving off-axis. Light due to the background from 40K decays in sea water has been simulated by adding singles hit rate of per PMT and a time-correlated hit rate of , and per DOM corresponding to two, three and four coincident hits in different PMTs in the same DOM, respectively. These parameters have been estimated via a detailed simulation based on GEANT4 GEANT . An average dark current rate of per PMT has been also taken into account. The PMT detection efficiencies as estimated in Sect. 3.1 and shown in Fig. 4c have been used.
As mentioned in Sect. 2, the start time and the ToT are recorded for each PMT hit. This scheme is implemented in the detector simulation, with a smearing of the raw hit times that follows the measured PMT transit time response vlvnt1 . The ToT dependence on the number of photo-electrons and their time sequence for multiple hits on one PMT that cannot be resolved in time were also considered. These corrections result in events containing complete and unbiased snapshots of all hits recorded during a time window around the atmospheric muon event. The same trigger algorithm which was applied to the data was also applied to the simulated hits. Triggered events containing only 40K hits were also simulated.
6 Muon reconstruction
As it has already been demonstrated by the PPM-DOM deployed at the KM3NeT French site ppm-dom , even with a single DOM it is possible to reject the background and identify muon induced signals by selecting high multiplicity () coincident hits. In the case of the PPM-DU, the correlated information from all 3 DOMs provides an extra handle for the identification of muons and allows for a more precise reconstruction of the direction of the associated particles.
6.1 Muon signature in multifold coincidences
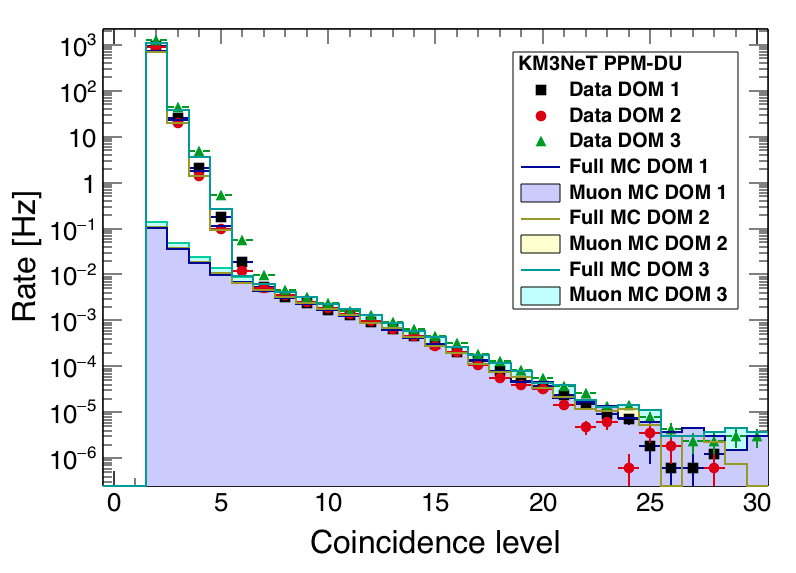
In Fig. 9 the rates of multifold coincidences in the single DOMs are shown and compared to the rates predicted by the Monte Carlo simulation. The full Monte Carlo histograms reported in Fig. 9 refer to the sum of atmospheric muon events and 40K only events. No normalisation factor is applied to the Monte Carlo events thus showing an excellent absolute agreement between data and Monte Carlo simulations. At low coincidence multiplicities the signals from 40K dominate the rates while the muon signature becomes dominant for coincidence multiplicities exceeding six.
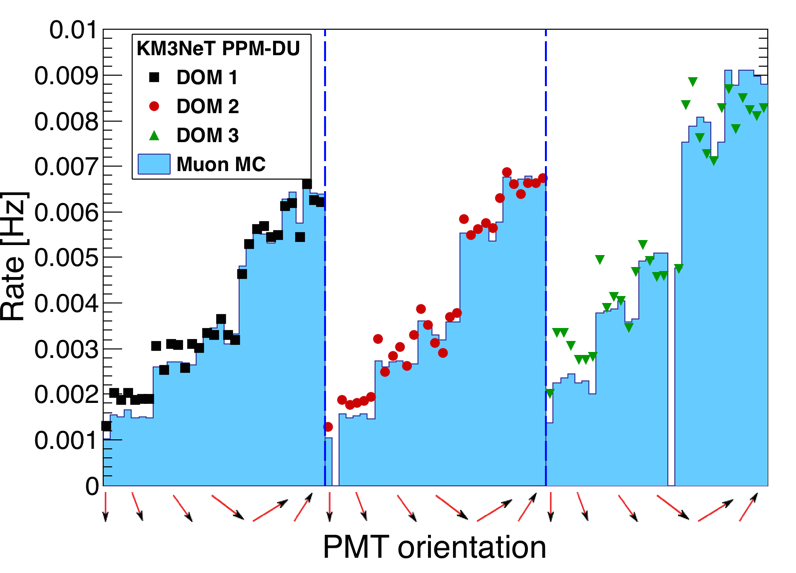
The distribution of hits of the high-multiplicity coincidences () over the different PMTs in each DOM compared to the corresponding distribution in the muon Monte Carlo simulation is shown in Fig. 10. The horizontal axis corresponds to the PMT location in each DOM as mentioned in Sect. 4, starting with the downward looking PMT and subsequently going up the consecutive rings of PMTs. The general pattern in all three DOMs clearly shows a higher hit frequency on the top hemispheres of the DOMs, reflecting the fact that atmospheric muons come from above and demonstrating the directional sensitivity of the DOMs.
6.2 Multi-DOM muon signature
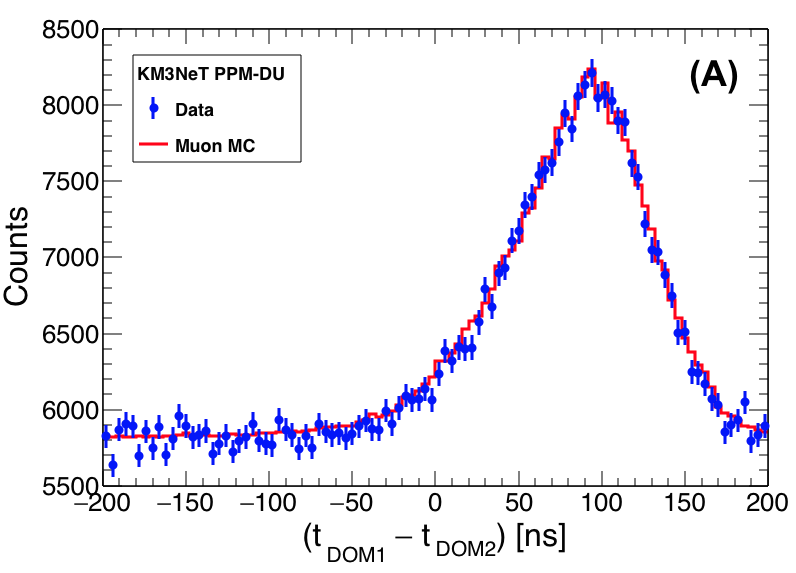
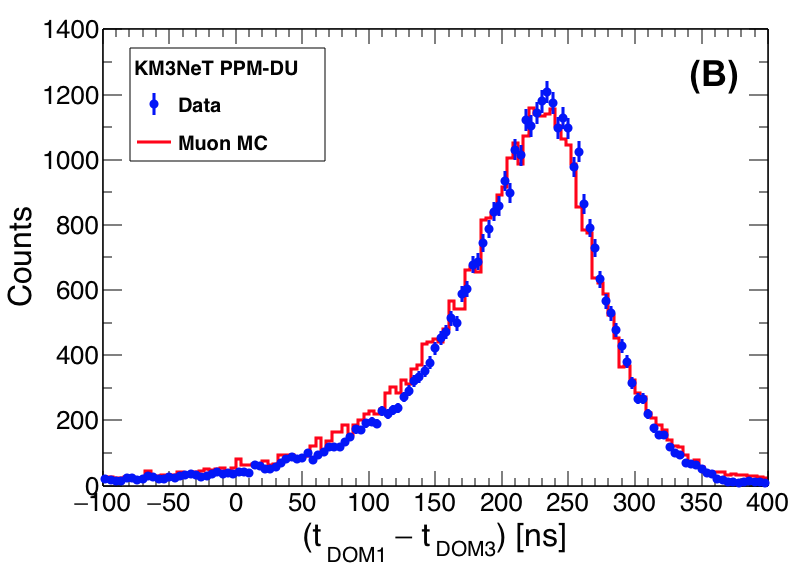
The distributions of time differences between coincidences on the different DOMs are shown in Fig. 11, together with the predictions from the Monte Carlo muon simulation. The time of a coincidence is defined as the start time of the earliest hit in the coincidence. The zenith angles of the incoming muons and their distances to the string determine the spread and overall shape of these distributions. Very good agreement between data and the Monte Carlo simulation is observed. The peak due to correlated muon signals in the two DOMs is clearly visible on a flat background due to random uncorrelated signals. The additional requirement of a coincidence in the third DOM within a time window consistent with the signal from a muon removes this background, and selects thus an almost background-free sample of muons, as seen in Fig. 11b. The size of this time window is consistent with the trigger definition explained in Sect. 2.3, where a time difference smaller than between DOMs triggers the event selection.
Time coincidences between different DOMs have been exploited for an accurate time calibration during observing periods that were lacking nanobeacon data. For this additional time calibration three independent distributions were used:
-
•
time differences between DOM 1 and DOM 2 (no matching coincidence in DOM 3);
-
•
time differences between DOM 2 and DOM 3 (no matching coincidence in DOM 1);
-
•
time differences between DOM 1 and DOM 3 when all 3 DOMs are in coincidence.
The difference between the data and MC histograms as given in the formula below was then evaluated as a function of the two independent time offsets of DOM 2 and DOM 3:
Here the summations are over the three distributions () and over the nanosecond time bins (). The minimum in the resulting plane (: time offset DOM 2, : time offset DOM 3) was found via a paraboloid fit which provided the corresponding time offsets. A cross check of this calibration with the nanobeacon calibration demonstrated agreement of the calibrated time offsets within two nanoseconds.
Events with correlated coincidences in all three DOMs were used to reconstruct the zenith angle of the downgoing muons. No attempt to reconstruct the azimuth angle of the muons was made. The track of a muon can be parametrised by a time offset , the zenith angle , the closest distance to the string and the -position of the closest distance to the string, . The expected time of arrival of a signal at a DOM in this parametrisation is given by:
where is the projection of the particle on the vertical axis, is the refractive index of sea water and is the speed of light.
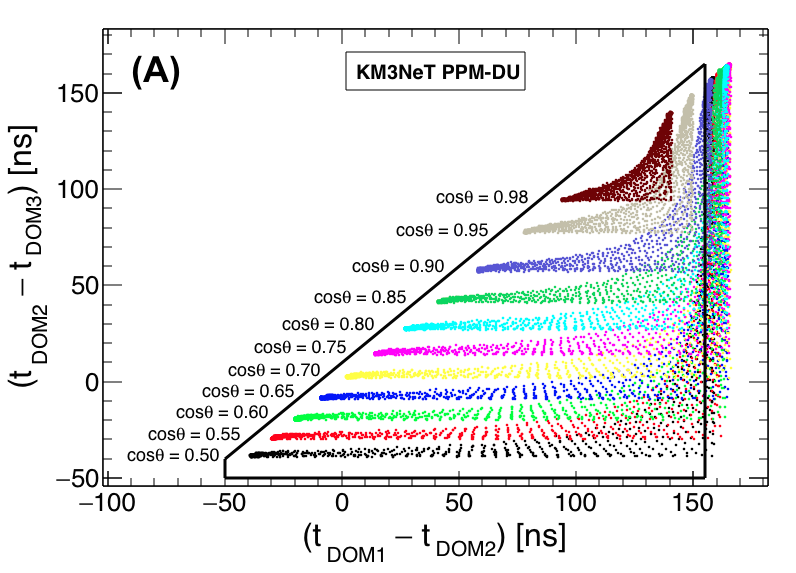
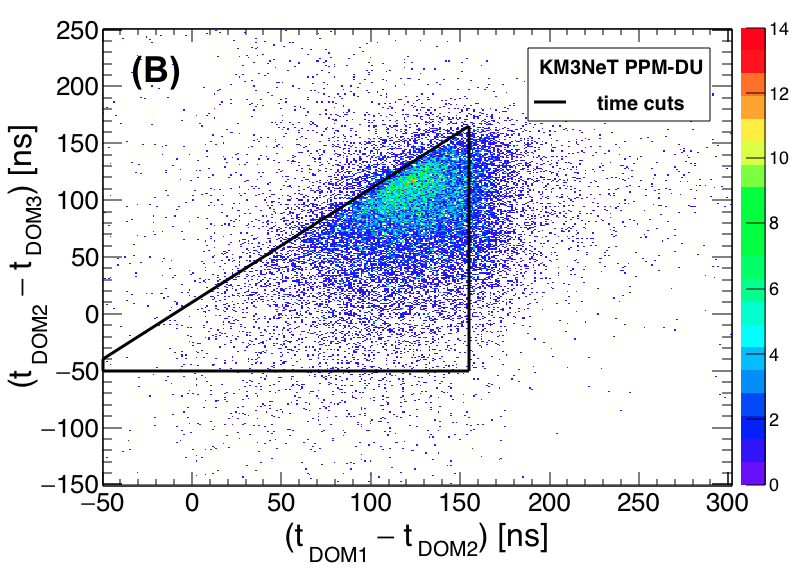
Using only the information of the time differences between the two DOM pairs cause degeneracies in the track reconstruction, affecting the accuracy of the results. In order to reduce the degeneracies, only events with , , were kept. The time differences in the signals of the upper and middle DOMs versus the time differences in the middle and lower DOM pair are shown in Fig. 12a for muon Monte Carlo events. The colours indicate different directions of the muon zenith angle; various distances of the muon tracks to the detector are covered in the vicinity of the detector. In Fig. 12b, the distribution of the reconstructed time differences in the Monte Carlo simulated events before and after selection are shown. The selection keeps of all events with coincident signals in all 3 DOMs.
The times of the coincidences in the DOMs were compared to the expected signal times from a possible muon track. A minimisation scan was performed in flat between 0.5 and 1 (100 steps), corresponding to the assumption of downgoing muons. For each of these, the remaining three parameters (, , ) were varied, and the values resulting in the lowest were chosen as the final parameters. Events with are rejected to ensure a good quality of the reconstructed data sample.
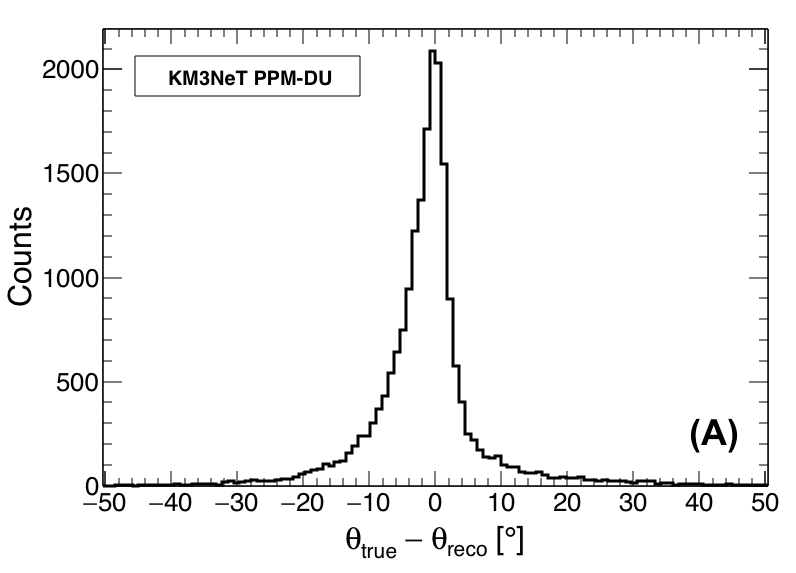
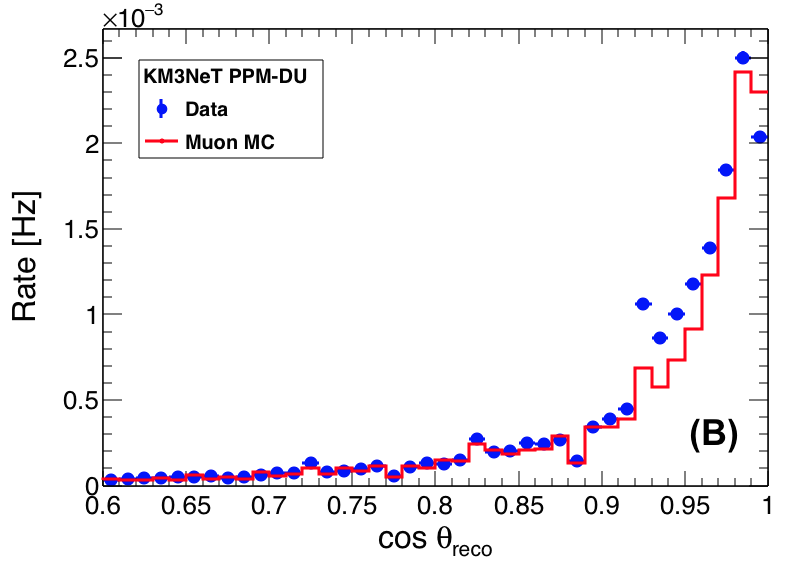
The distribution of the differences between the reconstructed and simulated zenith angle is shown in Fig. 13a, resulting in a peak with a FWHM of 7.6 degrees. The rates of the reconstructed for the selected events is shown for both data and Monte Carlo in Fig. 13b, demonstrating excellent agreement.
7 Conclusions
A prototype of the KM3NeT detection unit was deployed at in the Mediterranean Sea in May 2014 and was operated until its decommissioning in July 2015. The complete marine operations chain for the installation of the DU (DU deployment on the sea bed, submarine connections with ROV, unfurling procedures) was fully successful. This prototype project validated the DU structure at the depth of providing a test bench for the operation and data handling tools. The prototype was also a tool for testing the software architecture developed for the full scale KM3NeT detector. The prototype allowed for long-term monitoring of the optical background (40K decay and bioluminescence), improving our knowledge of the marine site.
The procedure for time calibration exploiting 40K decays and LED beacons was demonstrated successfully with nanosecond stability. The timing information of the signals was exploited to identify correlated signals from atmospheric muons in the DOMs. Excellent agreement was found in the expected time distributions of signals from muons with simulated signal distributions. With the three DOMs, a high purity sample of atmospheric muons was isolated and excellent agreement was found between the observed and simulated distributions. The success of this prototype project paves the path to the forthcoming installation of detection units at the Capo Passero and Toulon sites.
References
- (1) M. Ageron et al. (ANTARES Collaboration), ANTARES: the first undersea neutrino telescope, Nucl. Instr. Meth. A656 (2011) 11.
- (2) A. Capone et al. (NEMO Collaboration), Recent results and perspectives of the NEMO project, Nucl. Instr. Meth. A602 (2009) 47.
- (3) P.A. Rapidis (for the NESTOR Collaboration), The NESTOR underwater neutrino telescope project, Nucl. Instr. Meth. A602 (2009) 54.
- (4) http://www.km3net.org
- (5) M. de Jong (for the KM3NeT Collaboration), KM3NeT, AIP Conference Proceedings 1666 (2015) 040004.
- (6) L.A. Fusco (for the KM3NeT Collaboration), Rejection of atmospheric muons in KM3NeT/ORCA, PoS(ICRC2015)1072 (2015).
- (7) P. Piattelli (for the KM3NeT Collaboration), All-flavour high-energy neutrino astronomy with KM3NeT/ARCA, PoS(ICRC2015)1158 (2015).
- (8) S. Adrián-Martínez et al. (KM3NeT Collaboration), Expansion cone for the 3-inch PMTs of the KM3NeT Optical Modules, JINST 8 (2013) T03006.
- (9) S. Adrián-Martínez et al. (KM3NeT Collaboration), Deep sea tests of a prototype of the KM3NeT digital optical module, Eur. Phys. J. C 74 (2014) 3056.
- (10) R. Bormuth et al. (for the KM3NeT Collaboration), Characterization of the ETEL and HZC 3-inch PMTs for the KM3NeT project, AIP Conference Proceedings 1630 (2014) 114.
- (11) S. Aiello et al. (for the KM3NeT Collaboration), Characterization of the 80-mm diameter Hamamatsu PMTs for the KM3NeT project, AIP Conf. Proc. 1630 (2014) 118.
- (12) S. Biagi et al. (for the KM3NeT Collaboration), Performances and main results of the KM3NeT prototypes, PoS(ICRC2015)1164 (2015).
- (13) D. Calvo (for the KM3NeT Collaboration), Nanobeacon: a low cost time calibration instrument for the KM3NeT neutrino telescope, AIP Conference Proceedings 1630 (2014) 138.
- (14) E. de Wolf et al. (for the KM3NeT Collaboration), A launching vehicle for optical modules of a deep-sea neutrino telescope, Nucl. Instr. Meth. A725 (2013) 241.
- (15) J.A. Aguilar et al. (ANTARES Collaboration), The data acquisition system for the ANTARES neutrino telescope, Nucl. Instr. Meth. A570 (2007) 107.
- (16) H. Le Provost et al., A readout system-on-chip for a cubic kilometer submarine neutrino telescope, JINST 6 (2011) C12044.
- (17) J.A. Aguilar et al. (ANTARES Collaboration), Measurement of the atmospheric muon flux with a 4 GeV threshold in the ANTARES neutrino telescope, Astropart. Phys. 33 (2010) 86.
- (18) A. Margiotta (for the ANTARES Collaboration), Common simulation tools for large volume neutrino detectors, Nucl. Instrum. Meth. A725 (2013) 98.
- (19) P. Bagleyet et al. (KM3NeT Collaboration), KM3NeT Coll., Technical Design Report, 2010. Available on http://www.km3net.org. ISBN 978-90-6488-033-9.
-
(20)
Y. Becherini et al., A parameterisation of single and multiple muons in the deep water or ice, Astropart. Phys. 25 (2006) 1;
G. Carminati et al., Atmospheric MUons from PArametric formulas: a fast GEnerator for neutrino telescopes (MUPAGE), Comp. Phys. Comm., 179 (2008) 915. - (21) http://geant4.cern.ch