Search for HOOH in Orion ††thanks: Based on observations with APEX, which is a 12 m diameter submillimetre telescope at 5100 m altitude on Llano Chajnantor in Chile. The telescope is operated by Onsala Space Observatory, Max-Planck-Institut für Radioastronomie (MPIfR), and European Southern Observatory (ESO).
Abstract
Context. The abundance of key molecules determines the level of cooling that is necessary for the formation of stars and planetary systems. In this context, one needs to understand the details of the time dependent oxygen chemistry, leading to the formation of O2 and H2O.
Aims. We aim to determine the degree of correlation between the occurrence of O2 and HOOH (hydrogen peroxide) in star-forming molecular clouds. We first detected O2 and HOOH in , we now search for HOOH in Orion OMC A, where O2 has also been detected.
Methods. We mapped a region around Orion H2-Peak 1 with the Atacama Pathfinder Experiment (APEX). In addition to several maps in two transitions of HOOH, viz. 219.17 GHz and 251.91 GHz, we obtained single-point spectra for another three transitions towards the position of maximum emission.
Results. Line emission at the appropriate LSR-velocity (Local Standard of Rest) and at the level of was found for two transitions, with lower S/N () for another two transitions, whereas for the remaining transition, only an upper limit was obtained. The emitting region, offset 18′′ south of H2-Peak 1, appeared point-like in our observations with APEX.
Conclusions. The extremely high spectral line density in Orion makes the identification of HOOH much more difficult than in . As a result of having to consider the possible contamination by other molecules, we left the current detection status undecided.
Key Words.:
Astrochemistry – interstellar medium (ISM): general – ISM: individual objects: Orion H2-Peak 1 – ISM: molecules – ISM: abundances – Stars: formation1 Introduction
Searches for the presumed key molecule O2 (Goldsmith & Langer, 1978) in numerous star-forming regions have been highly unawarding (e.g. Goldsmith et al., 2000; Pagani et al., 2003), with the definite detection of the molecule in merely two sources, viz. (Larsson et al., 2007; Liseau et al., 2012) and Orion A (Goldsmith et al., 2011; Chen et al., 2014). Some cases have been either resolved or remained undecided (e.g. Goldsmith et al., 2002; Yıldız et al., 2013).
The observed scarcity of O2 in the Interstellar Medium (ISM) called for the abandonment of pure gas-phase chemistry models and the invocation of grain-surface processes (Hollenbach et al., 2009). Specific models addressed the conditions of the Orion Bar PDR (photodissociation region), where searches had however been unsuccessful in detecting the molecule (Melnick et al., 2012). Surprisingly, perhaps, O2 was detected towards the hot core, albeit at an LSR (Local Standard of Rest)-velocity of 10-12 km s-1, i.e., significantly different from that of typical hot core molecules ( 5 km s-1; Goddi et al., 2011, and references therein). These authors also found a small region of emission in NH3 inversion lines with velocities of about 11 kms. Overall, line widths decrease with excitation from 5 km s-1 to 2 km s-1.
Chen et al. (2014) were able to pinpoint the location of the 9′′ O2 source, near the position identified as H2-Peak 1 and somewhat offset from the hot core centre. The non-detection of the O2 line at 1121 GHz led the authors to conclude that gas temperatures do not exceed 50 K, with best-fit model values more like 30 K. The excitation conditions thus resemble those in (Liseau et al., 2012).
Du et al. (2012) developed models for grain surface chemistry, and as an example, they considered the particular case of . According to these models, the existence of O2 in the gas phase is a transient phenomenon, lasting for some 105 years, and which may explain the extremely few detections. These models also predict the accompanying occurrence of hydrogen peroxide (HOOH or H2O2) and hydroperoxyl (HO2), and water of course, via the following major reactions on grain surfaces (Tielens & Hagen, 1982; Parise et al., 2014):
O2 + H HO2
HO2 + H HOOH
HOOH + H H2O + OH,
and these two species were then also firstly detected in (Bergman et al., 2011; Parise et al., 2012). As was the case with O2, the observation of ten other targets in lines of HOOH gave null results (Parise et al., 2014), supporting the O2-HOOH association. This included low- and high-mass star formation regions, where in particular the high-mass star formation regions had strong UV fields, shocks and maser emissions. It was natural, therefore, to search for the hydrogen peroxide molecule in Orion A, a site that was not listed in Table 4 of Parise et al. (2014).
The organisation of this Research Note is briefly outlined as follows: in Sect. 2, the observations and data reduction are reported, with the results provided in Sect. 3. A brief discussion, together with our conclusions, follows in Sect. 4.
2 Observations and data reduction
The region around the position “Orion H2-Peak 1” (Chen et al., 2014) was observed with the Atacama Pathfinder Experiment (APEX; http://www.apex-telescope.org/) in 2014 during the time August to December (Table 1). APEX is a 12 m single dish telescope at 5100 m altitude in northern Chile. We used two receivers from the SHeFI111Swedish Heterodyne Facility Instrument suite, i.e., APEX-1 for 219 GHz and 252 GHz and APEX-2 for 269 GHz and , 319 GHz, respectively222Energy level diagrams are found in Bergman et al. (2011).. At these frequencies, the HPBW of APEX is 20′′ to 28′′. The rms value of the telescope pointing accuracy is 2′′.
As seen in Table 1, maps were obtained on-the-fly in the 219 GHz and 252 GHz lines, with a sampling rate of 9′′/pxl, oversampling the region in these lines. The central J2000-coordinates are R.A. = 05h35m1370, Dec. = ∘ 22′ 090. Towards the offset position (0′′, ′′), single position spectra were obtained at 269 GHz and 319 GHz.
For the instantaneous bandwidth of 2.5 GHz, we used as backend the Fast Fourier Transform Spectrometer (FFTS) with 32768 spectral channels. We selected a spectral resolution of 76.3 kHz per channel, corresponding to a velocity resolution of 0.1 km s-1. The data were reduced with the software packages GILDAS/CLASS (http://www.ira.inaf.it/brand/gag.html) and xs
(ftp://yggdrasil.oso.chalmers.se/pub/xs/).
3 Results
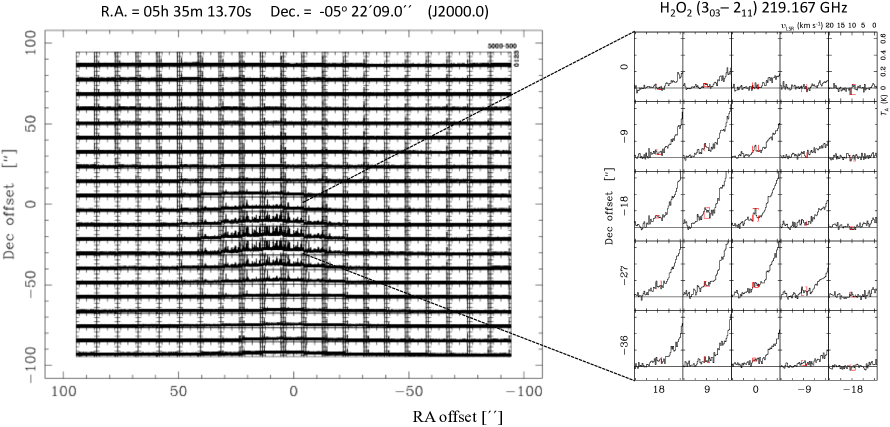
An overview of the mapped region is shown in the left panel of Fig. 1, revealing that the core region near the centre is very compact. A blow-up, 36′′ in size, is shown in the right panel, where a weak emission feature is shown on the wing of a stronger line. That feature corresponds to the () line of HOOH at the LSR-velocity of 10.0 km s-1, i.e., consistent with that of the O2 lines (Chen et al., 2014). It can also be seen that this feature is not merely due to noise, but is repeatedly seen in different positions, albeit at lower intensity. The fact that HOOH is not detected outside this limited region implies that the emission in the 219 GHz line is point-like to the 28′′ telescope beam.
From the data in Table 2, it appears that only two out of five lines were clearly detected (), and two were possibly detected at low S/N (). The quoted line widths (FWHMs) are only lower limits because of the difficulty in accurately determining the local continuum on sloping backgrounds. These HOOH widths are smaller than those for O2 reported by Chen et al. (2014). The 252 GHz line was not detected. However, the noise level of that spectrum is very much higher than for the other observations (Table 2).
| HOOH-transition | Frequency | Date | Sp. | |
|---|---|---|---|---|
| (GHz) | yy–mm–dd | (min) | ||
| 219.16686 | 14-08-14 | 60.0 | map | |
| 14-08-18 | 60.0 | map | ||
| 14-08-19 | 60.0 | map | ||
| 14-10-06 | 88.0 | sngl | ||
| 251.91468 | 14-08-15 | 60.0 | map | |
| 268.96117 | 14-10-06 | 73.1 | sngl | |
| 14-10-08 | 21.9 | sngl | ||
| 14-12-04 | 167.9 | sngl | ||
| 318.22325 | 14-10-08 | 58.6 | sngl | |
| 14-10-10 | 40.3 | sngl | ||
| 318.71210 | 14-10-08 | 58.6 | sngl | |
| 14-10-10 | 40.3 | sngl |
-
Maps have their origin at = 05h35m1370, = ∘ 22′ 090 (Chen et al., 2014), and single position spectra refer to the offset (0′′, ′′).
| HOOH | FWHM | S/N | ||||
|---|---|---|---|---|---|---|
| Line | (K) | (km s-1) | (km s-1) | (mK) | (K km s-1) | |
| 31 | 10.0 | 1.4 | 26.1 | 0.172 | 4.6 | |
| 66 | 11.6 | 0.8 | 257.0 | 0.242 | 1.2 | |
| 41 | 10.3 | 1.0 | 41.9 | 0.118 | 2.8 | |
| 53 | 11.8 | 0.9 | 28.8 | 0.102 | 3.5 | |
| 67 | 12.3 | 1.5 | 31.5 | 0.174 | 4.0 |
4 Discussion and conclusions
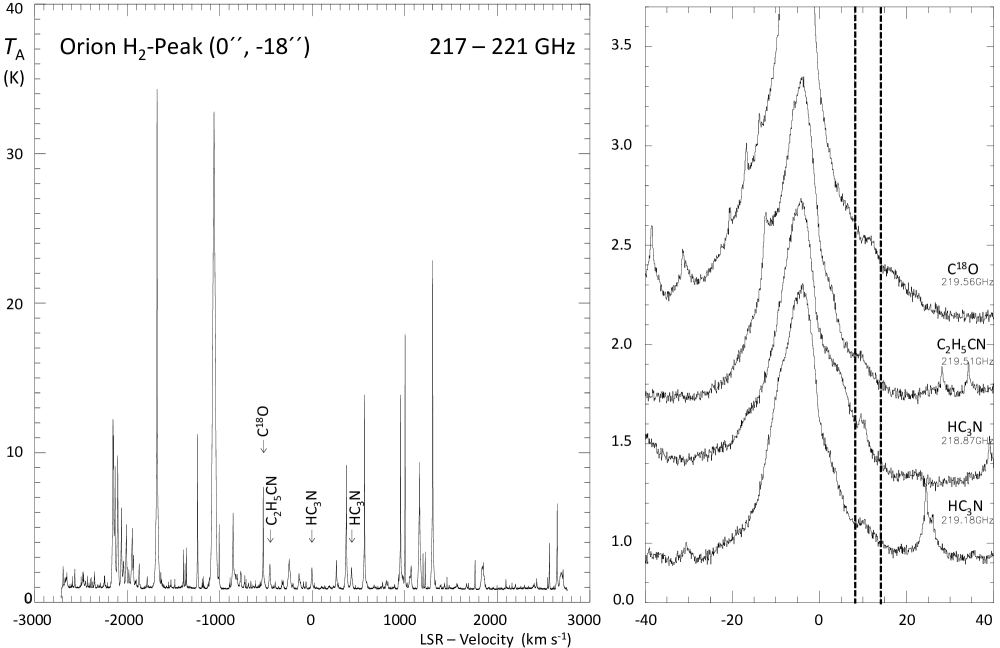
The LSR-velocities of the HOOH features are clearly outside the hot core window, but seem consistent with those obtained for O2. This could also indicate that in Orion HOOH can be tied to O2. A major shortcoming, though, is the extremely high line density towards the hot core region, which makes proper line identification difficult. In fact, several molecules in the 219 GHz spectrum display similar hump features on their red wings (Fig. 2). This is not evidenced by the other transitions, but in view of the relatively lower S/N makes the HOOH identification apparently non-unique.
Acknowledgements.
The contributions by P. Bergman, including the interesting discussions, are highly appreciated. We also thank the Swedish APEX team and the APEX staff on site for their help with the observations. As part of our Odin and Herschel work, this research has been supported by the Swedish National Space Board (SNSB).References
- Bergman et al. (2011) Bergman, P., Parise, B., Liseau, R., et al. 2011, A&A, 531, L8
- Chen et al. (2014) Chen, J.-H., Goldsmith, P. F., Viti, S., et al. 2014, ApJ, 793, 111
- Du et al. (2012) Du, F., Parise, B., & Bergman, P. 2012, A&A, 538, A91
- Goddi et al. (2011) Goddi, C., Greenhill, L. J., Humphreys, E. M. L., Chandler, C. J., & Matthews, L. D. 2011, ApJ, 739, L13
- Goldsmith & Langer (1978) Goldsmith, P. F. & Langer, W. D. 1978, ApJ, 222, 881
- Goldsmith et al. (2002) Goldsmith, P. F., Li, D., Bergin, E. A., et al. 2002, ApJ, 576, 814
- Goldsmith et al. (2011) Goldsmith, P. F., Liseau, R., Bell, T. A., et al. 2011, ApJ, 737, 96
- Goldsmith et al. (2000) Goldsmith, P. F., Melnick, G. J., Bergin, E. A., et al. 2000, ApJ, 539, L123
- Hollenbach et al. (2009) Hollenbach, D., Kaufman, M. J., Bergin, E. A., & Melnick, G. J. 2009, ApJ, 690, 1497
- Larsson et al. (2007) Larsson, B., Liseau, R., Pagani, L., et al. 2007, A&A, 466, 999
- Liseau et al. (2012) Liseau, R., Goldsmith, P. F., Larsson, B., et al. 2012, A&A, 541, A73
- Melnick et al. (2012) Melnick, G. J., Tolls, V., Goldsmith, P. F., et al. 2012, ApJ, 752, 26
- Pagani et al. (2003) Pagani, L., Olofsson, A. O. H., Bergman, P., et al. 2003, A&A, 402, L77
- Parise et al. (2012) Parise, B., Bergman, P., & Du, F. 2012, A&A, 541, L11
- Parise et al. (2014) Parise, B., Bergman, P., & Menten, K. 2014, ArXiv e-prints [arXiv:1407.0550]
- Sutton et al. (1985) Sutton, E. C., Blake, G. A., Masson, C. R., & Phillips, T. G. 1985, ApJS, 58, 341
- Tielens & Hagen (1982) Tielens, A. G. G. M. & Hagen, W. 1982, A&A, 114, 245
- Yıldız et al. (2013) Yıldız, U. A., Acharyya, K., Goldsmith, P. F., et al. 2013, A&A, 558, A58