Linking the Structural Properties of Galaxies and their Star Formation Histories with STAGES.
Abstract
We study the links between star formation history and structure for a large mass-selected galaxy sample at . The galaxies inhabit a very broad range of environments, from cluster cores to the field. Using HST images, we quantify their structure following Hoyos et al. (2012), and divide them into disturbed and undisturbed. We also visually identify mergers. Additionally, we provide a quantitative measure of the degree of disturbance for each galaxy (“roughness”). The majority of elliptical and lenticular galaxies have relaxed structure, showing no signs of ongoing star formation. Structurally-disturbed galaxies, which tend to avoid the lowest-density regions, have higher star-formation activity and younger stellar populations than undisturbed systems. Cluster spirals with reduced/quenched star formation have somewhat less disturbed morphologies than spirals with “normal” star-formation activity, suggesting that these “passive” spirals have started their morphological transformation into S0s. Visually identified mergers and galaxies not identified as mergers but with similar roughness have similar specific star formation rates and stellar ages. The degree of enhanced star formation is thus linked to the degree of structural disturbance, regardless of whether it is caused by major mergers or not. This suggests that merging galaxies are not special in terms of their higher-than-normal star-formation activity. Any physical process that produces “roughness”, or regions of enhanced luminosity density, will increase the star-formation activity in a galaxy with similar efficiency. An alternative explanation is that star formation episodes increase the galaxies’ roughness similarly, regardless of whether they are merger-induced or not.
keywords:
galaxies: clusters: individual: (Abell 901, Abell 902) — galaxies: evolution — galaxies: peculiar — galaxies: formation — galaxies: structure.1 Introduction
1.1 Background
Collisions and interactions between galaxies can significantly change their morphologies and star-formation histories. In this paper we try to link these two aspects of galaxy evolution. Mergers can change the number density of galaxies and contribute to the shape and colour dependence of the luminosity function (Wolf et al., 2003; Bell et al., 2004; Faber et al., 2007). They are therefore key ingredients in hierarchical galaxy evolution models. Furthermore, it has been argued that merger events are expected to drive the formation and evolution of massive early-type galaxies (De Lucia & Blaizot, 2007; Robaina et al., 2010; López-Sanjuan et al., 2012; Trujillo et al., 2011; Bluck et al., 2012), although their impact for early-type galaxies of intermediate mass could be lower (López-Sanjuan et al., 2010a, b).
One way to identify galaxy mergers is to measure the galaxies’ structural properties in optical images (see, e.g., Conselice, 2003; Lotz et al., 2004; Jogee et al., 2009). Alternative merger detection techniques are based on the identification of kinematical and spatial close pairs (Patton et al., 2000; Wen et al., 2009). The morphological techniques are based on the fact that the objects involved in a merger episode will be gravitationally disturbed and appear to be either highly asymmetric or shredded on deep images. Hoyos et al. (2012) introduced a new method to identify galaxy mergers based on the structural properties of the residual images of galaxies after subtracting a smooth model. This diagnostic quantifies the deviation of the surface brightness profiles of galaxies from a Sérsic model and it was optimized to detect almost all minor mergers.
It is important to point out that none of the methods which employ structural diagnostics can produce a clean merger sample. This is particularly true for minor mergers, where the contamination by non-mergers can be rather high (up to 70%; Hoyos et al. 2012). These contaminants can be late-type galaxies with prominent and localized star-forming regions, or objects disturbed by tidal effects. Thus, it is important to keep in mind that many galaxies with disturbed morphologies are not necessarily mergers.
There are many factors that influence the structural nature of a merger remnant and thus our ability to identify mergers. These include the mass ratio between the colliding galaxies, the morphological type of the merging systems, and the amount of gas present in them. Other relevant parameters include the orbital elements of the collision which can, for instance, determine whether or not a tidal dwarf galaxy is formed after the merger (Duc, 2011). The prototypical result of these studies is that the collision between two equally-massive large disk galaxies generally results in an elliptical galaxy (Toomre, 1977; Stanford & Bushouse, 1991; Barnes & Hernquist, 1991; Schweizer, 1982). It has also been found that there is a mass ratio interval between 3:1 and 4.5:1 for which the remnant of a merger between two disk galaxies can be either an elliptical galaxy, a galaxy with a disturbed disk or a hybrid system with disk morphology but with the kinematics of an elliptical galaxy (Bournaud et al., 2004; González-García & Balcells, 2005; Bournaud et al., 2005). However, Naab & Trujillo (2006) showed that it is often problematic to assess the intrinsic structural nature of a merger remnant observationally. Moreover, multiple minor mergers can transform a disk galaxy into an early type system, as shown by Bournaud et al. (2007). This transformation is most clearly seen in the evolution of the morphological Sérsic index and the kinematic ratio of the final system after each minor merger event. These works highlight that there must be a relation between the conditions in which a merger takes place and the structural properties of the resulting galaxy.
Gas also plays an important role in determining the nature of merger remnants, and its importance is far greater than its relative mass with respect to the stellar component. For instance, Lotz et al. (2010) show that gas-rich mergers appear to be more disturbed and asymmetric than dry mergers, and they remain so for longer. The reason for the enhanced importance of the gaseous component of galaxies lies with the way it reacts to an encounter (Spitzer & Baade, 1951). Gas can collide and compress while readjusting to the rapidly-changing gravitational potential of the merger. It can also undergo efficient radiative cooling and, as a result, be converted into new young stars in a central starburst episode or feed an active galactic nucleus. Gas thus plays a key role in the origin of the relation between the mass of the central black hole and the velocity dispersion of the stars in galaxies (Mihos & Hernquist, 1996; Barnes & Hernquist, 1996; Di Matteo et al., 2005; Hopkins et al., 2005; Di Matteo et al., 2008; Johansson et al., 2009). Gas-rich mergers are also thought to be very important for the evolution of the stellar populations found in early-type galaxies. Schweizer (1999) shows that several distinct stellar populations can be formed during a merger event through a series of separate starbursts taking place during the final mixing phase of the merger.
Taking all these factors into account, it is clear that unambiguously identifying mergers is not an easy task, particularly in the absence of kinematic information revealing disorder in the velocity field. Furthermore, minor mergers, in particular gas-poor ones, are much more difficult to identify than major mergers. It is clear therefore that imaging data alone cannot unambiguously distinguish between mergers and non-mergers in all cases. However, when visually identifying mergers it is possible to draw on the experience the classifiers have built by examining the images generated by mergers simulations and the expertise of previous classifiers. Asymmetry or “roughness” is not enough to classify a galaxy as a visual merger. Signs such as tidal tails, double/multiple nuclei, clear bridges of material connecting different galaxy components, etcetera, are required. Even though visual image classification cannot be completely objective and unequivocal, the classifiers’ experience can be very valuable and provide useful information, as we will show in this paper.
The impact of mergers on the star-formation histories of galaxies has been discussed in detail in the literature. The work presented in Bergvall et al. (2003) finds a moderate effect of mergers on the global SFR in galaxies at , although they also find that most of the merger-induced contribution to the SFR of galaxies is localized at the very centres of the interacting galaxies. Relatively recent works include those of Jogee et al. (2009) and Robaina et al. (2009), which use data from the GEMS111See http://www.mpia.de/GEMS/gems.htm (Rix et al., 2004) and COMBO-17 (Wolf et al., 2003, 2004; Wolf et al., 2008; Bell et al., 2004) surveys respectively. These studies conclude that in massive galaxies the star formation rate is moderately enhanced in interacting and merging systems compared to non-interacting systems of similar masses over the redshift interval (Wolf et al., 2005; Bell et al., 2005). Moreover, the work shown in Heiderman et al. (2009), based on the same dataset we analyse here, shows that the star-formation rate in mergers is a factor 1.5 – 2.0 times higher in mergers and interacting galaxies than in non-interacting systems. However, since mergers only constitute a small (5% – 10%) fraction of the total population of cluster galaxies, their contribution to the global star formation in the A901/902 multiple cluster environment is only between 10% and 15%.
Additional mechanisms which could affect the evolution of cluster galaxies and thus alter their morphologies and star-formation histories include: ram-pressure stripping of the gaseous component as the galaxy travels through the densest regions of the Intra Cluster Medium (Larson et al., 1980; Gunn & Gott, 1972); gas compression (Fujita, 1998); thermal evaporation (Nipoti & Binney, 2007); and frequent high-speed encounters between galaxies (galaxy harassment, Moore et al., 1998). All these phenomena leave their own imprints on both the morphologies and star formation histories of galaxies. For instance, Koopmann & Kenney (2004) observe disk truncation of the HII line emission in Virgo cluster galaxies. However, the regimes in which each of these phenomena act and the time scales of their effects need not be the same (Boselli & Gavazzi, 2006), although all of them tend to transform a blue star forming galaxy into a red passively evolving one.
The morphology–density relation (Melnick & Sargent, 1977; Dressler, 1980) provides clear evidence of the connection between the structure of galaxies and the environment where they live. Early-type galaxies are preferentially found in high-density environments, whereas late-type galaxies are preferentially located in low-density environments. This relation has been in place since (Smith et al., 2005; Poggianti et al., 2008). Star formation is also known to be suppressed in high-density environments (Hashimoto et al., 1998; Lewis et al., 2002; Gray et al., 2004; Poggianti et al., 2006), even after factoring out the underlying morphology–density relation.
A basic prediction of merger models is that substructure in either late mergers or recent merger remnants should be associated with signatures of a young stellar population. This has already been successfully tested by Schweizer & Seitzer (1992) and Győry & Bell (2010) using ground-based imaging data for representative samples of local galaxies. Here, we plan to further these studies using a well-defined galaxy sample with good space-based imaging. On the other hand, optically-passive (sometimes called anemic), low-star-formation spirals should show smoother morphologies than other spiral systems of similar masses. These systems, first identified by van den Bergh (1976) and more recently by Poggianti et al. (1999), are spiral galaxies with smooth arms and no evident signs of active star forming regions. These sources were shown in Wolf et al. (2009) to be massive () spiral galaxies that probably have been incorporated into the cluster medium in recent times, a view that is strengthened by Bösch et al. (2013). Their star formation rates have been significantly reduced and they are thought to have just started a slow morphological transformation into smoother S0 galaxies. These objects are mostly the so-called “dusty red” systems described and characterized in Wolf et al. (2005). Optically-passive spirals are then systems in which the star formation history has already started to evolve amidst the cluster environment but whose large-scale structural properties are still largely unchanged, as revealed by their spiral morphologies. We will call these galaxies “red spirals” in what follows.
1.2 Scope of this paper
Taking all of this into consideration, it is clear that different galaxy transformation processes will leave different imprints on the structure and star-formation history of the galaxies. It is also clear that any study trying to link the morphological disturbances seen in galaxies with their star formation histories would benefit from considering galaxies in a broad range of environments, including the field, groups, clusters, and the infall regions.
In this paper we further explore the relation between the star formation histories of galaxies and their degree of morphological disturbance by expanding the work presented in Hoyos et al. (2012). In that paper we used the STAGES (Space Telescope A901/902 Galaxy Evolution Survey, Gray et al., 2009) Hubble Space Telescope (HST) Advanced Camera for Surveys (ACS) F606W images to develop a structural merger diagnostic using a complete sample of both cluster and field galaxies with a well-defined mass limit and reliable visual morphological classifications. Thus, one goal of the current work is to assess whether the morphological indicator introduced in Hoyos et al. (2012) correlates with (or provides information about) the star formation and/or merging histories of galaxies. In particular, we here place the spotlight on (i) confirmed visual mergers, (ii) disturbed objects that are however not visually classified as mergers222As mentioned in Section 1.1, this class probably contains a difficult-to-quantify fraction of minor and/or late-stage mergers that defy visual identification, and any interpretation of the results must take this caveat into account., (iii) relaxed, non-disturbed objects and (iv) red spiral galaxies. We use the luminosity-averaged ages, star formation rates (SFR) and morphological disturbances of these different galaxy sets in order to explore the link between star formation histories and morphology and, in particular, whether this relationship depends on the physical origin (i.e, merger induced or internally generated) of the observed morphological disturbances.
Objects are considered to be “disturbed” if they lie in the merger side of the structural diagnostic defined in Hoyos et al. (2012), and galaxies are said to be “relaxed” otherwise. In addition, we define the sub-sample of visual mergers as the systems identified by eye as mergers in Hoyos et al. (2012). Besides the obvious interest in comparing the properties of the stellar population histories found in actual mergers to those found in the relaxed systems, the properties of the disturbed objects that are visually classified as non-mergers are interesting because they can help decide whether the enhanced star formation found in mergers can also be present in non-merging disturbed galaxies. However, some caution is needed here. In order for this to work in all cases, it would be necessary to have a diagnostic that can cleanly identify all the non-mergers. The visual diagnostics that we use may sometimes fail to separate minor mergers from clumpy star-forming disks. When the star-forming clumps are clearly part of the spiral arm structure, without disturbing the overall symmetry of the galaxy, is reasonable to assume that they are not the result of minor mergers; however, when these clumps are not clearly part of the spiral arms, it is not possible to ascertain, from the images alone, whether they are due to mergers or to other causes. Additional information, such as kinematics, would be very useful here.
Another goal of this work is to assess whether the star-formation histories of the disturbed non-merging systems are comparable with those of similarly-disturbed merging galaxies (see below for a quantitative definition of disturbance). Significant structural perturbations, possibly leading to star formation events affecting the optical appearance of non-merging systems would need to be explained via internal or perhaps environmental mechanisms, and would help understand better the nature of the galaxies identified with our structural merger diagnostic. It is also possible to consider that a disturbed surface brightness profile can have various origins, ranging from an actual merger to a simple nuclear starburst or a simple supernova event. This study can help ascertain whether all these possibilities leave specific imprints on the morphologies of their host galaxies. Finally, the set of cluster red spirals will be used to explore their degree of morphological transformation with respect to other spirals in the cluster environment. The comparison of red spirals with other spirals is more important in the cluster environment since red spirals are fairly scarce in the field.
We stress that the work we present here is purely phenomenological. It may be possible to use high-resolution hydrodynamical simulations of galaxy mergers and normal star-forming systems in order to tackle these complicated questions, assessing, for instance, the typical temporal and/or spatial scales of star formation episodes in mergers and in isolated galaxies, or other structural traits. However, this theoretical work is very difficult to do since it is not clear what to look for and the detailed physics is poorly constrained. Indeed, it would be an enormous computational challenge to simulate a complex and coupled system of cold and hot gas, stars, dust and dark matter in a dynamic cluster environment. Therefore, we will focus on the conclusions that can be drawn from the observations alone.
Section 2 presents the observational data and galaxy sample. Section 3 shows the basic differences between the star formation histories of smooth, disturbed, and merging galaxies. In section 4 we present the search for relations between the degree of morphological disturbance in galaxies and their star formation histories. Finally, section 5 summarizes the results of this work. Throughout this paper, a concordance cosmology with , and is used.
2 Data and Sample
2.1 Data
In this work, we make use of the STAGES333http://www.nottingham.ac.uk/astronomy/stages dataset (Gray et al., 2009). One of the primary goals of STAGES is to study the impact of environment on galaxy evolution, using the multiple cluster system Abell 901/902 located at . This complex comprises different environments with galaxy densities reaching (see Heiderman et al. 2009 for details). STAGES makes use of a wide array of data, including, but not limited to, deep HST/ACS imaging, Spitzer Infrared photometry and ground based optical observations.
The STAGES HST/ACS observations cover almost in the F606W filter, and were reduced with a target plate scale of 0.03 arcsec per pixel. The Point Spread Function (PSF) Full-Width-Half-Maximum (FWHM) is 3.12 pixels or . At , 1 arcsec subtends 2.83 kpc, giving a spatial resolution of 0.3 kpc. The average exposure time is ks and the point-source completeness limit of these images is . These observations can provide reliable structural parameters up to an apparent magnitude between and , as shown in Gray et al. (2009) and Hoyos et al. (2012). Visual inspection of these frames by multiple independent classifiers provides a robust morphological catalogue, which will be presented in Gray et al. (in prep).
The STAGES HST imaging dataset is complemented with COMBO-17 (Wolf et al., 2003, 2004; Wolf et al., 2008) good-quality optical images gathered with the Wide Field Imager (WFI) at the MPG/ESO 2.2-m telescope. Additionally, 24 observations were obtained with the MIPS instrument on Spitzer (Gallazzi et al., 2009). The COMBO-17 observations consist of optical images in five broad-band filters (UBVRI) and 12 medium-band filters whose wavelengths range from 3500 to 9300 Å, covering with a plate scale of 0.238 arcsec per pixel. The observations are particularly deep in the R band, with an exposure time of 20 ks. The MIPS data have a plate scale of 1.25 arcsec per pixel and a PSF FWHM of 6 arcsec, and are 80% complete at a flux density of 97.0 .
The COMBO-17 observations yielded very accurate photometric redshifts with uncertainties of . This corresponds to 3% distance errors at the cluster distance for galaxies with (see Gray et al., 2009), while the corresponding uncertainty for 444For the sake of brevity we will omit the subindex “Vega” hereafter, but it applies to all COMBO-17 magnitudes and colours discussed in this paper. galaxies is , or a 12% distance error. Note that the COMBO-17 colours mostly probe the central regions of galaxies due to the use of relatively small apertures (Wolf et al., 2009). It is also important to point out that COMBO-17 photometry is much shallower than the HST STAGES observations. The available data were also used to estimate Star Formation Rates (SFR), photometric stellar masses (), integrated central colours and rest-frame SEDs.
SFRs were obtained using a combination of MIPS observations and COMBO-17 rest-frame synthetic 2800 Å luminosities, calibrated with a set of PEGASE (Fioc & Rocca-Volmerange, 1997) models. In the framework of the models used, the derived SFRs are averages over the last Myr assuming a constant SFR. The STAGES data catalog (Gray et al., 2009) lists three distinct determinations of the SFR. The most informative one is called sfr_det, which combines actual measurements of the Spitzer flux with the synthetic 2800 Å luminosities. This measurement is used whenever possible. In the absence of a reliable flux detection, it is possible to obtain a lower (listed as sfr_lo) limit and an upper (given as sfr_hi) limit to the SFR, and both values are averaged together. If the resulting averaged value is less than , it is considered an upper limit. This limit to the SFR of is simply the Spitzer detection limit at , and for field galaxies this limiting value is modified taking into account their luminosity-distance. In the very few cases where the average of the two SFR determinations exceeds the threshold, this mean value is adopted as the actual value. Finally, in the absence of Spitzer observations555Not the same as a non-measurement. This is mainly due to spatial coverage issues or to the presence of a bright star in the middle of the field which makes the Spitzer measurements unreliable. the SFR given by sfr_lo is taken as a lower limit.
Stellar masses were estimated following the work presented in Borch et al. (2006) using a template library built again using the PEGASE models. See Gallazzi et al. (2009) for further details on the models used for the SFR and photometric mass estimates.
SEDs were classified into three different bins describing old red galaxies, “dusty red” galaxies (called red spirals in this paper), and blue cloud objects according to their location in the vs. plane. Red spirals were observationally defined in Wolf et al. (2005) as having and . The term is the colour-magnitude relation, defined as . In the previous expression, is the reduced Hubble-Lemaître constant ().
The COMBO-17 data were also used to derive aperture stellar mass surface densities () for cluster galaxies. This is the integrated stellar mass density of galaxies more massive than in apertures with a kpc radius (175 at ). As shown in Wolf et al. (2009), stellar mass densities are more robust against different selection criteria than simple number densities as long as the massive galaxies are included in the sample. These stellar mass density data were used in order to explore (i) whether the long term star formation histories of cluster galaxies is a function of the specific environment and (ii) whether the relaxed, disturbed, and visual merger cluster galaxies actually exist in the same environmental conditions.
| Type/Environment | Relaxed | Disturbed | Visual Mergers |
|---|---|---|---|
| (non-mergers) | (non-mergers) | ||
| E | |||
| Cluster | 0.910.02 | 0.080.02 | 0.010.01 |
| Field | 0.940.02 | 0.010.01 | 0.050.02 |
| S0 | |||
| Cluster | 0.930.02 | 0.050.02 | 0.020.01 |
| Field | 0.970.02 | 0.030.02 | 0.000.00 |
| Sp | |||
| Cluster | 0.650.02 | 0.270.02 | 0.080.01 |
| Field | 0.700.03 | 0.220.02 | 0.080.02 |
| Irr | |||
| Cluster | 0.580.05 | 0.140.04 | 0.280.05 |
| Field | 0.600.04 | 0.160.03 | 0.240.03 |
| Red Spiralsa | |||
| Cluster | 0.700.04 | 0.250.04 | 0.050.02 |
| Field | 0.670.07 | 0.270.06 | 0.060.03 |
aRed spiral galaxies are discussed in §4.
2.2 Sample
In the current work we use the sample presented in Hoyos et al. (2012), which was employed there to develop a structural diagnostic calibrated to detect mergers. This is a stellar mass and magnitude selected sample (; ) in the photometric redshift interval, and includes objects in both the cluster and field environments of all morphological types, from elliptical to irregular galaxies. The mass limit ensures that the sample is complete in stellar mass for both the blue cloud and the red sequence (see Borch et al., 2006). The magnitude limit guarantees reliable visual morphologies, since all the sources show extended images in the HST/ACS data. The limit used to define the sample approximately corresponds to and therefore the structural parameters are reliable for all members of this set of galaxies. The sample includes 1560 galaxies distributed across all environments. The sample can also be divided into four different morphological categories labelled as “E”, “S0”, “Sp”, and “Irr”. The “E” bin is made of course of elliptical systems, the “S0” bin gathers the lenticular galaxies, the “Sp” bin comprises the spiral galaxies, and the “Irr” bin includes a mixture of irregulars, compact, and highly disturbed sources that do not fit into any of the other galaxy classes. The cluster sample is defined using a -band-dependent photometric-redshift running window designed to be 90% complete in the apparent magnitude interval considered. The contamination rate by field galaxies in the cluster sample is 30% at the fainter end, and substantially smaller at brighter magnitudes (% for ). The field sample includes galaxies in the redshift intervals and . For a more detailed definition and justification of this sample, see Gray et al. (2009).
The final sample consists of 655 Field galaxies (100 E, 60 S0, 318 Sp, 177 Irr) and 905 Cluster galaxies (192 E, 216 S0, 383 Sp, 114 Irr). The STAGES morphological catalogue has good morphological information for all objects in this sample. For more details about this sample and a complete summary of the motivations for its definition, see Hoyos et al. (2012).
This sample is split according to (i) whether or not galaxies are visually classified as mergers by Hoyos et al. (2012), (ii) whether or not galaxies appear to have disturbed or merger-like structural parameters according to the diagnostic described in the same paper, and (iii) whether or not galaxies have a red spiral SED according to Wolf et al. (2005). Throughout this work, galaxies visually classified as non-mergers will be divided into two classes, “disturbed” and “relaxed”, according to whether they have merger-like structural properties (as defined by Hoyos et al., 2012) or not. Specifically, non-mergers above the solid boundary line in the lower panel of Figure 10 of Hoyos et al. (2012) are classed as “disturbed” and those below as “relaxed”.
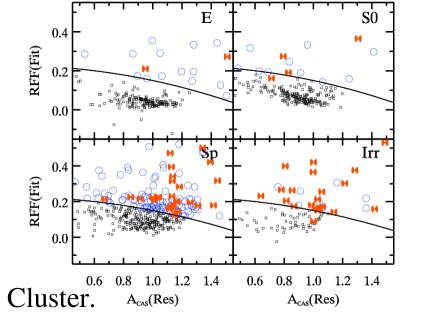
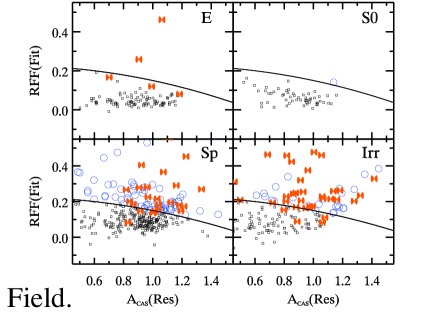
Figure 1 allows to visualize the main subsamples that are relevant for this work in the framework of Figure 10 of Hoyos et al. (2012). It presents the Residual Flux Fraction (RFF) vs. the asymmetry of the residual image after subtracting a Sérsic model calculated in a well defined way (). The Sérsic fits and structural parameters were measured over the HST F606W images observed by the STAGES team. The RFF is a measure of the amount of light present or absent in the residuals that cannot be accounted for by the photometric errors. The asymmetry of the residuals is the CAS (Conselice, 2003) asymmetry calculated for the residual image. It is important to note here that the usual CAS parameters are calculated over the original, direct image while the structural parameters introduced in Hoyos et al. (2012) are obtained using the residual image. This makes these measurements different from other non-parametric structural characterizations of surface-brightness distributions.
Figure 1 shows, for both the cluster and field environments the distribution of objects of all morphological classes in the RFF– structural parameter space. The black, solid line is the optimal boundary derived in Hoyos et al. (2012) that best separates visual mergers from the general population of galaxies. Objects below this line are morphologically relaxed systems, well represented by a Sérsic model and shown as small black squares. Objects above this line are disturbed galaxies, with substantial deviations from a simple Sérsic model and shown in Figure 1 as blue circles. The location of the visual mergers is given by the red filled infinity symbols. It is seen that, as expected, most visual mergers are disturbed systems and that the contamination by disturbed systems not visually classified as merging, is very high. It is important to remember that, as discussed above, some of these may be minor and/or advanced mergers. We note, however, that very few visually identified mergers lie below the boundary making this diagnostic an excellent negative test. The subsample definitions shown in this figure will be used for the plots and discussions presented in §3 and §4.
Table 1 gives the fractions of relaxed, disturbed, and visual mergers (where applicable) for each of the morphological types in the cluster and field environments. Early types are mostly relaxed systems, while many Sp and Irr galaxies are either disturbed or merging objects. Errors are estimated assuming a binomial distribution in which , where is the estimated fraction and is the total number of events used to obtain that fraction. These estimates only take into account the statistical random errors. However, the contamination of the cluster sample by field galaxies (and vice-versa) would add some systematic uncertainty to these numbers which is very difficult to estimate without extensive spectroscopy reaching the faintest objects. However, since the fractions of field and cluster galaxies in the different categories (relaxed, disturbed and visual mergers) are very similar, we feel that these systematic errors would have little effect on our conclusions. The table also presents the fractions corresponding to red spirals, which will be discussed later in the paper.
It may seem surprising that, as Figure 1 and Table 1 show, there is a significant fraction of irregular galaxies which are “undisturbed” according to the RFF– diagnostic. It is important to note, however, that the morphological classes (E, Sp, S0 and Irr) are determined visually, without reference to any quantitative structural parameter, while the RFF– diagnostic is based on a specific quantitative recipe which uses an empirically-calibrated threshold (cf. Fig. 1 and Hoyos et al. 2012 ). Galaxies above this threshold are deemed to be disturbed, while galaxies below are classified as relaxed. Although the fraction of irregular galaxies that are classified as “undisturbed” is, understandably, the smallest among all the morphologies, not all of them are disturbed enough to place them above the threshold. They simply are less disturbed than the galaxies selected in Hoyos et al. (2012) as likely to be undergoing a merger.
3 The link between star formation history and structure
This section explores the differences in the star formation histories of galaxies classified according to their structural properties. In section §4 we will expand the analysis of the star formation properties of galaxies as a continuous function of their degree of morphological disturbance.
3.1 Current star-formation rate
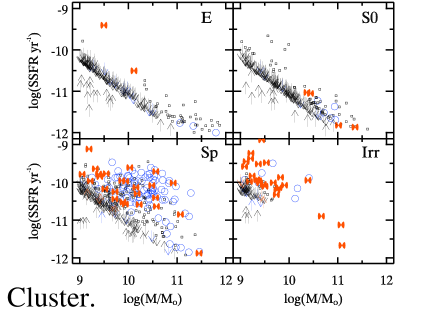
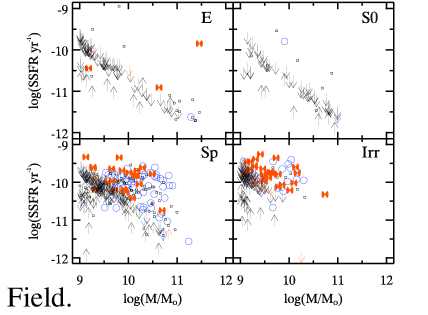
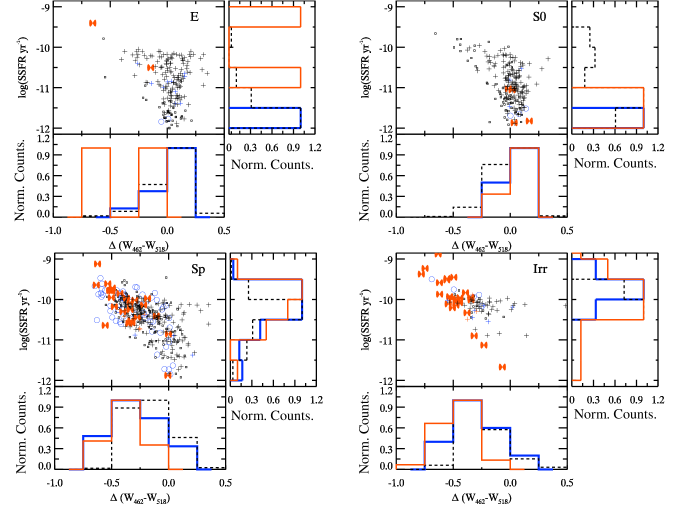
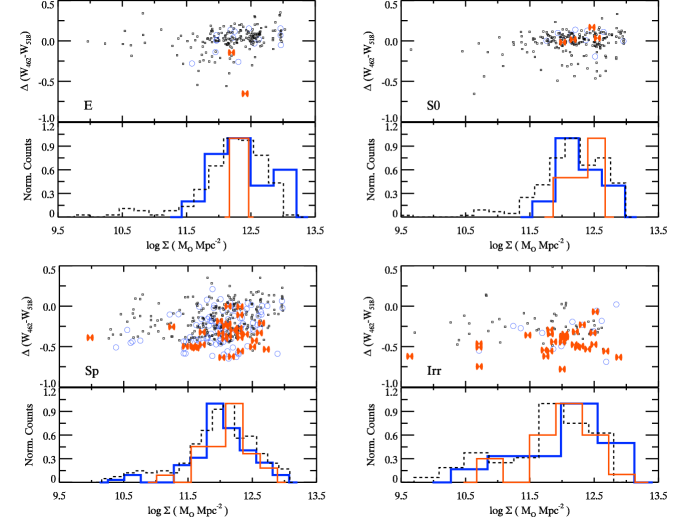
Figure 2 presents the Specific SFR (SSFR; star formation rate per unit stellar mass) as a function of the photometric stellar mass () for disturbed galaxies not classified as mergers (blue circles), relaxed galaxies (small black squares), and visual mergers (red infinity symbols) in both the cluster and the field for all morphological types. The objects for which only SFR upper limits are available (cf. section 2.1) are shown as down-pointing arrows with the appropriate colour (black for relaxed galaxies, blue for disturbed galaxies not classified as mergers, and red for visually-classified mergers). Conversely, for the sources without Spitzer observations, their SFR are lower limits and are shown as upward pointing arrows.
The clear diagonal pseudo-sequence defined by field and cluster Es and S0s, which consists mostly of upper limits and a few lower limits, shows the lowest total SFR that can be reliably measured with the COMBO-17 and Spitzer data for the galaxies studied here. Although the COMBO-17 observations could in principle detect galaxies up to two magnitudes fainter than our cut, the contamination resulting from the use of a much fainter limit would render the cluster subsample unusable. However, even though lower SFRs, if present, could easily be detected by the deeper photometry, an apparent lower limit in SFR results from the way we estimate it. The SFR is measured in part via a set of PEGASE models whose specific assumptions need not be true for early type galaxies. One well-known deficiency of these models is that the UV upturn (Bertola et al., 1980; Bureau et al., 2011), which is not expected to be due to current star formation, is not correctly accounted for. The 1300Å-2200Å UV flux of old, massive early type galaxies is often significant even in the total absence of star formation. The effects of this extra flux can be measured in the 2600Å-3000Å range covered by the 2800Å (400Å FWHM) synthetic filter used to obtain the monochromatic UV luminosities. This implies that a direct translation of UV luminosity into a SFR would be incorrect in these cases. Hence, this UV flux yields a non-zero SFR for these galaxies even if the true SFR is zero. Furthermore, the flux, which is additionally used to obtain the SFR, is generally very low for early type galaxies when compared to spirals and irregulars. Thus, with the flux density sensitivity of the Spitzer observations (), many E and S0 systems are not detected. As explained in §2.1, these non-detections are still allocated some nominal SFR based on the IR detection upper limit, resulting in the appearance of an artificial minimum SFR threshold when none really exists. Hence, the diagonal pseudo-sequence present in Fig. 2 for E and S0 galaxies, consisting mostly of upper limits, is clearly due to selection/model effects.
The small offset of the field non-star-forming diagonal pseudo-sequence with respect to that of the cluster sample is due to the slightly higher average redshift of the field sample. Also, a number of spirals in the cluster non-star-forming pseudo sequence are good candidates for anemic spirals or objects with large bulges, since the COMBO-17 colours mainly probe the inner regions of the galaxies as explained in §2.1.
Figs. 1 and 2 clearly show that the majority of the E and S0 galaxies are morphologically smooth objects. More than 90% of these galaxies are classified as relaxed by the structural disturbance diagnostic, as is seen in Table 1. It is also seen that the very few E or S0 systems that appear to be disturbed or are visually classified as mergers seem to follow the same general trends as the relaxed objects without any clear mass segregation. However, a very small number of outliers do exist such as a couple of merging field E galaxies. In addition, the proportion of disturbed early-type galaxies appears to be around three times larger in the cluster than in the field. In fact, the vast majority of the disturbed E and S0 galaxies in this sample are members of the A901/902 cluster complex. However, the small numbers involved make this result very uncertain. Nevertheless, it is clear that most early-type galaxies, and virtually all the ones in the field, seem to be systems which have not only completed their morphological transformation but have passively-evolving stellar populations as well. There is, however, a significant minority of S0s with relatively high SSFRs (see Fig. 2). This suggests that the process that suppresses star formation in these galaxies has not finished yet. If S0s are the descendants of spiral galaxies whose star formation ceased (see, e.g., Bedregal et al. 2006; Johnston et al. 2012), star-forming S0s are those that have not been completely quenched yet, perhaps retaining some star formation in their central regions (Johnston et al., 2012).
The behaviour of the Sp and Irr sources in Fig. 2 is fundamentally different from that of the E and S0 galaxies. The weakly star-forming pseudo-sequence is much less evident, indicating that the SFR measurements for these sources are much more reliable. The weak-star-formation region of the diagram is usually populated by relaxed sources. Interestingly, the distributions in the the SSFR vs. diagram of visual mergers and disturbed galaxies not classified as mergers are indistinguishable. These two classes of objects do not follow separate sequences, and this is true for galaxies in the full mass range considered here. There is no a-priori reason why this had to be so: the physics driving star formation in mergers and non-mergers might not be the same, and different physics could lead to different behaviours on this diagram. However, that is not what we observe: their behaviours are indistinguishable. The mechanisms that lead to an enhancement in the SFR of disturbed and merging galaxies seem to ignore the origin of the structural properties of the systems in which they operate: a morphological disturbance is usually associated with an increased star formation rate regardless of the mechanism that created such disturbance. We also note that there are no clear differences between the cluster and field subsamples.
However, the current data do not allow us to rule out an alternative explanation, i.e., similar enhancements in the star formation could perturb the surface brightness distributions of galaxies to a comparable degree regardless of the origin of this increased star formation. In other words, it is not possible to ascertain whether the star formation is the cause of the disturbance in the galaxies’ surface brightness distribution, or, alternatively, a structural perturbation may be leading to an enhancement in the SFR. Regrettably, we are unable to clearly disentangle cause and effect here. It is arguable, though, that —at least for major mergers— the structural disturbance could come first and then the increase in SF happens. Mergers create asymmetries in the structure of the galaxies and also cause gas density enhancements. These may drive star-formation enhancements, manifesting themselves as additional structural disturbances in the optical images. In this case, the disturbed morphology measured in the images could be due both to the star-forming regions and to the initial asymmetries caused by the mergers.
Figure 2 shows that, interestingly, the highest SSFR for the Sp and Irr systems in both the cluster and field environments are attained in visually identified mergers. In this context, Robaina et al. (2009) concluded that, even though the most intense star formation episodes taking place in massive () field galaxies at intermediate () redshifts are found in major mergers, the total impact of such interactions on the SFR amounts to only 10% when averaged over the whole lifetimes of these systems. Moreover, Jogee et al. (2009) found that massive () visual mergers only contribute to the total SFR density over comparable redshifts. Consistently, we find that major mergers in massive galaxies do not drive an enhancement in their SFR far beyond the one found in other disturbed galaxies. In other words, major mergers are not the dominant trigger of star formation in galaxies at .
Although by their very nature irregulars contain the largest fraction of visual mergers, we emphasise that these galaxies show, fundamentally, a very similar behaviour to spirals in Figure 2. Disturbed galaxies have enhanced star formation whether they are visually classified as mergers or not. This common behaviour is probably due to the fact that spirals and irregulars are generally gas rich, and enhanced star formation will be linked to a large gas density regardless of the actual mechanism responsible for that large density.
It could be argued that the statement “disturbed galaxies have high SF irrespective of whether they are visually classified as mergers or not” contains a circular argument driven solely by the fact that visual classification alone cannot unambiguously distinguish between mergers and non-mergers. However, we do not think that to be the case. Even though the the visual classification process cannot be completely objective and unequivocal, particularly in the absence of kinematic data, the classifiers’ experience and expertise, informed by the examination of images of mergers generated in simulations, cannot be completely discounted. We are able to identify visual mergers as a distinct class of objects separate from the disturbed galaxies not classified as mergers. It is true that the latter class may contain minor and advanced mergers, but that does not mean that the visual merger class is not, at least statistically, distinct. As discussed Section 1.1 and Fig. 1 clearly shows, asymmetry or “roughness” are not enough to classify a galaxy as a visual merger. Additional diagnostics, such as the presence of tidal tails, double/multiple nuclei, clear bridges of material connecting different galaxy components, etcetera, are required. Thus, since the visual merger identification does contain information that is largely independent from the quantitative disturbance diagnostics, the above statement is not circular, although it is true that we can only be reasonably sure that it applies mostly to major mergers. Thus, the visual merger identification does contain information that is largely independent from the quantitative diagnostic of structural disturbance.
3.2 Age of the stellar population
The evidence presented so far indicates that the current star-formation properties of mergers and disturbed systems that are however not classified as visual mergers are more similar than naively anticipated. At the same time, these findings imply that disturbed surface brightness profiles can have several origins, making it clear that such perturbations can be caused by either a merger or strong interaction, or an internal event, such as bar instabilities or shocks, that can alter the surface brightness profile in a similar manner. We now explore whether this similarity also applies to their past star-formation history.
Figure 3 plots SSFR vs. . The diagnostic measures the offset of the COMBO-17 medium-band colour from a fit to the E and S0 red sequence, which was calibrated using the reddening-corrected COMBO-17 aperture-matched fluxes. Explicitly,
| (1) |
The scatter of the E and S0 galaxies about this relation is quite small, ranging from at bright magnitudes to at the faint end ( on average). Fig. 3 gives an indication of the range and scatter for the different morphologies.
For cluster galaxies measures the 4000Å break, which is sensitive to stellar population age (see Fig. 6 in Wolf et al. 2005). First-order age and metallicity effects are accounted for by subtracting off the mean colour-magnitude relation for passive galaxies (i.e., the red sequence). The reason behind this approach is that the red sequence for early type galaxies indicates the locus of passive galaxies with different ages and metallicities, as the chemical evolution is mainly driven here by astration. Thus, offsets blueward from this sequence are due to the presence of younger stellar populations and can be used as a reasonable proxy for the luminosity-weighted age of stellar populations on timescales of – (Wolf et al., 2009). Figure 3 also shows SSFR and histograms split according to the structural properties of the galaxies. All these histograms are normalized to a maximum value of one.
E and S0 galaxies are predominantly on the red sequence. Since, in most cases, their estimated SFRs can only be taken as upper limits (as argued above), any possible correlation would be masked. It is therefore not possible to say much on E and S0 galaxies from this figure. However, notwithstanding the small fraction of merging and disturbed early-type galaxies, there is no apparent difference in the distribution of merging and disturbed systems for the early-type galaxies on this diagram. It is however stressed that small number statistics prevent us from reaching any meaningful conclusion here. No striking difference are found between the full distributions of Es and S0s either, although there are a few S0s with significant SSFRs, as discussed in Section 3.1. It is important to point out, however, that given the narrow colour range and the unreliable SFRs of these galaxies, these hints need to be taken with caution.
The SSFR correlates very strongly with for the star-forming Sp and Irr galaxies. This is, perhaps, not surprising since both quantities are sensitive to star formation history (SFH), albeit on different timescales (Myr vs. Gyr). This difference in timescale sensitivity implies that, even if we expect most galaxies to follow this broad correlation, their exact position on this plane is not only dictated by the average age of their stellar populations but also by the ratio of current to average-past SFR. For instance, a galaxy for which this ratio is very high will be close to the upper envelope of the relation, while a galaxy with a low ratio will be close to the lower envelope.
We find that the SSFR and distributions for relaxed and disturbed galaxies are very different (compare black-dashed and blue histograms). In the case of the Sp galaxies, these differences can be summarized in the lack of relaxed galaxies with bluer than and stellar mass doubling times less than . These differences translate into Kolmogorov-Smirnov probabilities of and 0.019 for the and SSFR histograms respectively. In the case of the Irr systems, it can also be seen that there are no relaxed cluster Irr bluer than , and the SSFR limit is in this case , which is a little bit more extreme. However, the interpretation of the Kolmogorov-Smirnov probabilities is more difficult here because of the smaller sample size ( vs. elements). The SSFR and histograms for the E and S0 galaxies also show clear differences, although the differences are more obvious for the spirals due to better statistics.
Interestingly, the SSFR distributions for visual mergers and disturbed galaxies not classified as mergers are indistinguishable from each other: the red and blue SSFR histograms of the Sp and Irr panels in Fig. 3 have very similar shapes. Kolmogorov-Smirnov (K-S) tests were run in order to confirm this statement. In the case of the Sp systems, the Kolmogorov-Smirnov probabilities are 0.055 and 0.48 for the and SSFR histograms respectively, and these same probabilities are 0.05 and 0.94 for the Irr galaxies but again with a much smaller sample size. Moreover, the SSFR– correlation has the same slope for all galaxies (relaxed, disturbed non-mergers, and visual mergers). Since the location of a galaxy on the SSFR vs. diagram is influenced by its SFH, and the distributions of the visual mergers and the disturbed galaxies not classified as mergers are very similar, we can conclude that their SFHs should also be reasonably similar. At the very least, we can be certain that the differences in SFH must be small enough not to affect their distributions on this diagram. Our findings are therefore consistent with the hypothesis that the SFH is similar in all disturbed galaxies, whether the disturbance is (major) merger-induced or not.
We close this section by exploring whether these results depend on environment within the A901/A902 system. Figure 4 presents as a function of the robust local environment measure also used in Wolf et al. (2009, see §2.1). The lack of an apparent correlation in the upper panels of Fig. 4 indicates that in the STAGES cluster system it is possible to find galaxies with young and old underlying populations at all local densities. Figure 4 also indicates that there is not a very strong morphology–density relation in this multiple cluster system, suggesting that it is not yet completely relaxed.
The lower panels in Fig. 4 show histograms of for the four morphological categories studied here, split according to their structural disturbance properties. The histograms are normalized to a maximum value of one, and the bin width is inversely proportional to the square root of the number of objects in each histogram in order to ease the comparison.
It is interesting to note, first, that the low-density areas of the cluster system (, corresponding to filaments and the in-fall region) are mainly populated by relaxed systems, in particular for the E and S0 morphological types where no disturbed or merging galaxies exist at these densities. This is less clear for the Sp and Irr galaxies, and it is not possible for a K-S test applied to the data to give a definite answer for the Sp and Irr histograms because of the small number of disturbed and visual merger galaxies in these regimes. At higher densities, (), the three populations appear to be well mixed: a K-S test for the data fails to detect any significant differences between the distributions of the disturbed, relaxed, and visual mergers of any morphology. The lowest K-S probability for each morphological category is 0.64 between disturbed and relaxed E galaxies, 0.66 between relaxed and merging S0 systems, 0.21 between relaxed and merging Sp galaxies and 0.20 between disturbed and relaxed Irr objects. The probabilities for all other combinations in each morphological type are higher, and the results are more significant for the Sp sources where the number counts are higher. In addition, the Sp and Irr subpanels reveal that both disturbed non-mergers and visual mergers with young stellar populations can be found even at the highest projected densities (), defined as the cluster “core” by Wolf et al. (2009).
The main conclusion of this section is that while there are differences in the SSFR, colour and (at least when considering the full density range) distributions of relaxed and disturbed galaxies, no such differences have been found between the disturbed galaxies not classified as mergers and the visual mergers.
4 The link between star formation history and the degree of structural disturbance
This section investigates whether there are any quantitative relations between the star-formation histories of galaxies (characterised by the and ) and their degree of morphological disturbance (parameterised using the merger diagnostic introduced by Hoyos et al. 2012). This measurement, which we call “roughness” for brevity, is the perpendicular distance to the boundary line defined in the “Residual Flux Fraction” vs. “Asymmetry of the Residuals” diagram (see lower panel of Figure 10 in Hoyos et al. 2012 for details). This boundary is reproduced in Figure 1 for completeness. Negative distances (corresponding to objects below the boundary) indicate relaxed systems while positive distances (objects above the boundary) imply disturbed ones.
We reiterate here that positive roughness does not necessarily imply that the galaxy in question is a visual merger (cf. §2.2): there is a very large fraction of disturbed objects (as defined by the above criterion) that are not visually classified as mergers (Hoyos et al., 2012). However, negative roughness does imply that a galaxy is not a visual merger since virtually all the visual mergers are in the disturbed category.
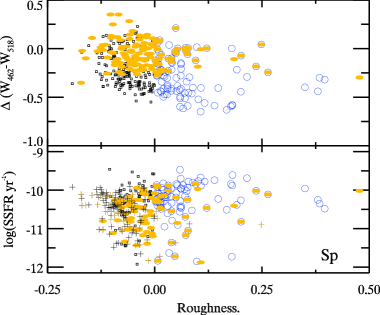
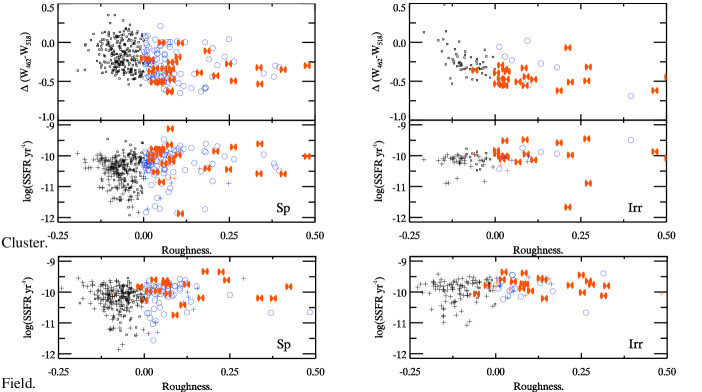
Figure 5 plots and vs. roughness for cluster and field Sp and Irr galaxies. We do not show equivalent plots for E and S0 galaxies because most of these systems are not disturbed and their SSFRs are very low and often unreliable. Since is explicitly designed to work as an age indicator for galaxies at the cluster redshift (see §3), we do not plot it for field galaxies.
There appears to be a good correlation between (a proxy for stellar population age) and roughness: “rougher” objects have systematically younger stellar populations. A Spearman test indicates that this correlation is very significant for both cluster spirals () and irregulars (). Furthermore, given the relatively bright and massive sample studied here, the correlation is not driven by luminosity or stellar mass, or affected by selection effects.
Fig. 5 also clearly shows that visual mergers and disturbed galaxies not classified as mergers have indistinguishable stellar age666This is also seen in Figure 3. and roughness distributions. This reinforces our conclusion that the star formation histories of disturbed galaxies not classified as mergers and visual mergers appear to be reasonably similar. It would seem as if the amount of “roughness” (or “texture” or “structure”) determines the degree of star-formation enhancement in disturbed galaxies, regardless of whether a (major) merger is taking place. However, it is very difficult with the current data to separate cause and effect so it is possible to argue that a similar degree of disturbance of the surface brightness profile (roughness) are observed in galaxies with similar enhancements of the SF and/or past star formation histories. Regardless, it is clear that “roughness” or “sub-structure” can be used as a proxy to distinguish galaxies with active star formation from those that do not have much on-going star-formation. This fact is again consistent with the hypothesis that the mechanisms that regulate the star formation events in galaxies act in the same manner whether the star formation is (major) merger-induced or not.
Roughness appears to correlate less well with SSFR than with . The SSFR-roughness correlation is only statistically significant for the cluster and field spirals at the level. However, given the large uncertainties and scatter introduced in the determination of the galaxies’ SFRs and stellar masses (see §2.1), it is likely that the underlying intrinsic correlation is stronger. Moreover, dust can have a stronger effect —and thus introduce a larger scatter— on the derived SFRs than on given the narrow wavelength range spanned by this colour. In any case, the highest SSFRs do correspond almost always to disturbed or merging galaxies: very few relaxed cluster galaxies attain SSFRs greater than . It is therefore inadvisable to conclude that the strength of the correlations shown in Fig. 5 is clearly different. What we can safely conclude is that systems with similar degrees of roughness have a similar enhancement in their star formation rates on timescales –Gyrs, independently of the origin of their morphological disturbances. We must not forget, however, that there are many galaxies with relatively small roughness that have significant SSFR. Clearly, the existence of star formation linked with (or enhanced by) the structural disturbance does not preclude the existence of star formation smoothly distributed across the galaxies.
To end this section we will approach the link between the degree of structural disturbance and star formation history from a different angle. We have found so far that galaxies with larger roughness have higher SSFRs and younger stellar ages. We ask now whether the complementary statement is also true. Explicitly, if we select, independently of their structure, galaxies with suppressed recent star formation, do they exhibit low roughness? To answer this question we consider the sample of optically-passive red spirals discussed in Sections 1 and 2.2. These galaxies are known to have lower star formation rates than other spiral galaxies of similar masses (Wolf et al., 2009). Figure 6 clearly shows that these galaxies, selected solely from the properties of their SEDs (Wolf et al., 2005), have a preference for smooth morphologies. This is substantiated by the fact that the average roughness for red cluster spirals is whereas the average roughness for the other cluster spirals is . This indicates that red spirals typically have slightly more negative roughness (i.e., are smoother) than other cluster spirals, although this is only a two-sigma result.
Table 1 also shows that, in the cluster environment, red spiral galaxies have a slightly higher probability (%) of showing a relaxed morphology than the global (i.e., red spirals plus other cluster spiral galaxies) population (%). This difference is further amplified if only the population of blue cloud cluster spirals, as defined by their SED type in Wolf et al. (2005), are considered. In this latter case, only % are found to be relaxed.
This is in line with the findings presented in Bösch et al. (2013), which show that red spiral galaxies are likely to be subject to enhanced ram pressure, when compared to normal spirals. In that work, it is shown that morphologically undistorted galaxies show very strong asymmetries in their emission-line rotation curves at high rest-frame velocities. These kinematical asymmetries are thought to be caused by ram-pressure stripping due to interaction with the intracluster medium. The work presented in Bösch et al. (2013) also shows that, among disk galaxies, the rotation-curve asymmetries are more acute in red spiral galaxies, leading to think that ram-pressure stripping is an important factor in these systems, probably leading to smoother morphologies through suppressed star formation. The answer to the question above thus seems to be affirmative, and galaxies with suppressed star formation show slightly smoother morphologies.
Finally, Table 1 also shows the fraction of relaxed, disturbed, and visual mergers for red spiral galaxies. In this table, the total number of red spirals in the cluster environment is more than double their number in the field, (122 vs. 48), highlighting that these red spirals are mainly a cluster phenomenon. Nevertheless, red spirals are preferentially found among relaxed systems in both environments.
5 Conclusions
This paper presents a study of the links between star formation history and structure for a large mass-selected () sample of morphologically-classified galaxies from the STAGES survey. More than half of these galaxies are located in the multiple cluster system A901/902 (). The remaining objects (the field sample) are made of both background () and foreground () sources. The sample thus contains galaxies of all morphologies inhabiting a very broad range of environments, from cluster cores to the field.
We characterise the star-formation history of these galaxies by using specific star-formation rates and stellar-population age proxies derived from extensive UV, optical and infrared photometry. The disturbance in the galaxies’ structure is quantified using objective measurements based on HST images following Hoyos et al. (2012). The sample is divided into undisturbed galaxies, disturbed galaxies that are not visually classified as merging, and disturbed galaxies which are visually classified as mergers. Moreover, a quantitative measurement of the degree of disturbance (which we call “roughness”) is calculated for each galaxy.
The main conclusions of this study are:
-
•
As expected, the vast majority of E and S0 galaxies in all environments have relaxed structure and show no signs of ongoing or recent star formation.
-
•
Structurally-disturbed galaxies have higher specific star-formation rates and younger stellar populations than their relaxed counterparts, and they tend to avoid the lowest density regions.
-
•
Conversely, cluster spirals with reduced/quenched star formation (red spirals) seem to have somewhat less disturbed (smoother) morphologies than spirals with “normal” star-formation activity. This would fit into the scenario that these “passive” spirals have started their morphological transformation towards becoming lenticulars.
-
•
Galaxies visually identified as merging and equally disturbed (but not classified as merging) ones have very similar specific star-formation rates and stellar ages. They also reside in very similar environments.
The specific star formation rate in galaxies appears to be linked to the degree of structural disturbance (measured by the “roughness” of their images), regardless of its physical cause. Specifically, an increase in the galaxies’ “roughness” or “texture” (i.e., deviations from a smooth profile) will result in a proportional increase in their star formation, whether they are visually identified as merging or not. In this interpretation, we speculate that merging galaxies are not special in terms of their higher-than-normal star-formation activity. Any physical process that produces “roughness”, or, in other words, regions of enhanced luminosity density in a galaxy, will increase the star-formation activity in the galaxy with similar efficiency. It is also possible to argue that galaxies with similar specific star formation rates will exhibit similar “roughness”. In this interpretation, it is not possible to tell what is the physical origin of an enhancement in the SFR of a given galaxy using morphological diagnostics like the one used here. Further data, possibly of kinematic nature, are needed to do this. Nevertheless, “roughness” or “sub-structure” can be used as a proxy to distinguish galaxies with active star formation from those without.
Acknowledgments
CH acknowledges funding from the Spanish AYA2010-21887-C04-03 Grant, led by Prof. Ángeles Díaz. Support for STAGES was provided by NASA through GO-10395 from STScI operated by AURA under NAS5- 26555. AAS, MEG and DTM acknowledge financial support from the UK Science and Technology Facilities Council. AB acknowledges funding by the Austrian Science Foundation FWF (projects P19300-N16 and P23946-N16). We acknowledge the use of data from the following observing facilities: MPG/ESO 2.2-m, HST (ACS) and Spitzer (MIPS). We thank the anonymous referee for her/his constructive criticisms and comments which have significantly contributed to the improvement of the original manuscript.
References
- Bergvall et al. (2003) Bergvall, N., Laurikainen, E., & Aalto, S. 2003, A&A, 405, 31
- Barnes & Hernquist (1991) Barnes, J. E., & Hernquist, L. E. 1991, ApJL, 370, L65
- Barnes & Hernquist (1996) Barnes, J. E., & Hernquist, L. 1996, ApJ, 471, 115
- Bedregal et al. (2006) Bedregal, A. G., Aragón-Salamanca, A., & Merrifield, M. R. 2006, MNRAS, 373, 1125
- Bell et al. (2005) Bell, E. F., Papovich, C., Wolf, C., et al. 2005, ApJ, 625, 23
- Bell et al. (2004) Bell, E. F., Wolf, C., Meisenheimer, K., et al. 2004, ApJ, 608, 752
- Bertola et al. (1980) Bertola, F., Capaccioli, M., Holm, A. V., & Oke, J. B. 1980, ApJL, 237, L65
- Bluck et al. (2012) Bluck, A. F. L., Conselice, C. J., Buitrago, F., et al. 2012, ApJ, 747, 34
- Borch et al. (2006) Borch, A., Meisenheimer, K., Bell, E. F., et al. 2006, A&A, 453, 869
- Boselli & Gavazzi (2006) Boselli, A., & Gavazzi, G. 2006, PASP, 118, 517
- Bournaud et al. (2007) Bournaud, F., Jog, C. J., & Combes, F. 2007, A&A, 476, 1179
- Bournaud et al. (2004) Bournaud, F., Combes, F., & Jog, C. J. 2004, A&A, 418, L27
- Bournaud et al. (2005) Bournaud, F., Jog, C. J., & Combes, F. 2005, A&A, 437, 69
- Bösch et al. (2013) Bösch, B., Böhm, A., Wolf, C., et al. 2013, A&A, 549, A142
- Bureau et al. (2011) Bureau, M., Jeong, H., Yi, S. K., et al. 2011, MNRAS, 414, 1887
- Conselice (2003) Conselice, C. J. 2003, ApJS, 147, 1
- De Lucia & Blaizot (2007) De Lucia, G., & Blaizot, J. 2007, MNRAS, 375, 2
- Di Matteo et al. (2005) Di Matteo, T., Springel, V., & Hernquist, L. 2005, Nature, 433, 604
- Di Matteo et al. (2008) Di Matteo, P., Bournaud, F., Martig, M., et al. 2008, A&A, 492, 31
- Dressler (1980) Dressler, A. 1980, ApJ, 236, 351
- Duc (2011) Duc, P.-A. 2011, arXiv:1101.4834
- Faber et al. (2007) Faber, S. M., Willmer, C. N. A., Wolf, C., et al. 2007, ApJ, 665, 265
- Fioc & Rocca-Volmerange (1997) Fioc, M., & Rocca-Volmerange, B. 1997, A&A, 326, 950
- Fujita (1998) Fujita, Y. 1998, ApJ, 509, 587
- Gallazzi et al. (2009) Gallazzi, A., Bell, E. F., Wolf, C., et al. 2009, ApJ, 690, 1883
- González-García & Balcells (2005) González-García, A. C., & Balcells, M. 2005, MNRAS, 357, 753
- Gray et al. (2004) Gray, M. E., Wolf, C., Meisenheimer, K., et al. 2004, MNRAS, 347, L73
- Gray et al. (2009) Gray, M. E., Wolf, C., Barden, M., et al. 2009, MNRAS, 393, 1275
- Gray et al. (in prep) Gray, M. E., et al. in prep.
- Gunn & Gott (1972) Gunn, J. E., & Gott, J. R., III 1972, ApJ, 176, 1
- Győry & Bell (2010) Győry, Z., & Bell, E. F. 2010, ApJ, 724, 694
- Hashimoto et al. (1998) Hashimoto, Y., Oemler, A., Jr., Lin, H., & Tucker, D. L. 1998, ApJ, 499, 589
- Heiderman et al. (2009) Heiderman, A., Jogee, S., Marinova, I., et al. 2009, ApJ, 705, 1433
- Hopkins et al. (2005) Hopkins, P. F., Hernquist, L., Cox, T. J., et al. 2005, ApJ, 630, 705
- Hoyos et al. (2004) Hoyos, C., Guzmán, R., Bershady, M. A., Koo, D. C., & Díaz, A. I. 2004, AJ, 128, 1541
- Hoyos et al. (2012) Hoyos, C., Aragón-Salamanca, A., Gray, M. E., et al. 2012, MNRAS, 419, 2703
- Hunter (1997) Hunter, D. 1997, PASP, 109, 937
- Jogee et al. (2009) Jogee, S., Miller, S. H., Penner, K., et al. 2009, ApJ, 697, 1971
- Johansson et al. (2009) Johansson, P. H., Burkert, A., & Naab, T. 2009, ApJL, 707, L184
- Johnston et al. (2012) Johnston, E. J., Aragón-Salamanca, A., Merrifield, M. R., & Bedregal, A. G. 2012, MNRAS, 422, 2590
- Kennicutt (1998) Kennicutt, R. C., Jr. 1998, ARA&A, 36, 189
- Koopmann & Kenney (2004) Koopmann, R. A., & Kenney, J. D. P. 2004, ApJ, 613, 866
- Larson et al. (1980) Larson, R. B., Tinsley, B. M., & Caldwell, C. N. 1980, ApJ, 237, 692
- Lewis et al. (2002) Lewis, I., Balogh, M., De Propris, R., et al. 2002, MNRAS, 334, 673
- López-Sanjuan et al. (2010a) López-Sanjuan, C., Balcells, M., Pérez-González, P. G., et al. 2010a, ApJ, 710, 1170
- López-Sanjuan et al. (2010b) López-Sanjuan, C., Balcells, M., Pérez-González, P. G., et al. 2010b, A&A, 518, A20
- López-Sanjuan et al. (2012) López-Sanjuan, C., Le Fèvre, O., Ilbert, O., et al. 2012, arXiv:1202.4674
- Lotz et al. (2004) Lotz, J. M., Primack, J., & Madau, P. 2004, AJ, 128, 163
- Lotz et al. (2010) Lotz, J. M., Jonsson, P., Cox, T. J., & Primack, J. R. 2010, MNRAS, 404, 590
- Melnick & Sargent (1977) Melnick, J., & Sargent, W. L. W. 1977, ApJ, 215, 401
- Mihos & Hernquist (1996) Mihos, J. C., & Hernquist, L. 1996, ApJ, 464, 641
- Moore et al. (1998) Moore, B., Lake, G., & Katz, N. 1998, ApJ, 495, 139
- Naab & Trujillo (2006) Naab, T., & Trujillo, I. 2006, MNRAS, 369, 625
- Nipoti & Binney (2007) Nipoti, C., & Binney, J. 2007, MNRAS, 382, 1481
- Patton et al. (2000) Patton, D. R., Carlberg, R. G., Marzke, R. O., et al. 2000, ApJ, 536, 153
- Poggianti et al. (1999) Poggianti, B. M., Smail, I., Dressler, A., et al. 1999, ApJ, 518, 576
- Poggianti et al. (2008) Poggianti, B. M., Desai, V., Finn, R., et al. 2008, ApJ, 684, 888
- Poggianti et al. (2006) Poggianti, B. M., von der Linden, A., De Lucia, G., et al. 2006, ApJ, 642, 188
- Rix et al. (2004) Rix, H.-W., Barden, M., Beckwith, S. V. W., et al. 2004, ApJS, 152, 163
- Robaina et al. (2009) Robaina, A. R., Bell, E. F., Skelton, R. E., et al. 2009, ApJ, 704, 324
- Robaina et al. (2010) Robaina, A. R., Bell, E. F., van der Wel, A., et al. 2010, ApJ, 719, 844
- Schweizer (1982) Schweizer, F. 1982, ApJ, 252, 455
- Schweizer & Seitzer (1992) Schweizer, F., & Seitzer, P. 1992, AJ, 104, 1039
- Schweizer (1999) Schweizer, F. 1999, Ap&SS, 267, 299
- Smith et al. (2005) Smith, G. P., Treu, T., Ellis, R. S., Moran, S. M., & Dressler, A. 2005, ApJ, 620, 78
- Spitzer & Baade (1951) Spitzer, L., Jr., & Baade, W. 1951, ApJ, 113, 413
- Stanford & Bushouse (1991) Stanford, S. A., & Bushouse, H. A. 1991, ApJ, 371, 92
- Toomre (1977) Toomre, A. 1977, Evolution of Galaxies and Stellar Populations, 401
- Trujillo et al. (2011) Trujillo, I., Ferreras, I., & de La Rosa, I. G. 2011, MNRAS, 415, 3903
- van den Bergh (1976) van den Bergh, S. 1976, ApJ, 206, 883
- Wen et al. (2009) Wen, Z. L., Liu, F. S., & Han, J. L. 2009, ApJ, 692, 511
- Wolf et al. (2003) Wolf, C., Meisenheimer, K., Rix, H.-W., et al. 2003, A&A, 401, 73
- Wolf et al. (2004) Wolf, C., Meisenheimer, K., Kleinheinrich, M., et al. 2004, A&A, 421, 913
- Wolf et al. (2005) Wolf, C., Bell, E. F., McIntosh, D. H., et al. 2005, ApJ, 630, 771
- Wolf et al. (2005) Wolf, C., Gray, M. E., & Meisenheimer, K. 2005, A&A, 443, 435
- Wolf et al. (2008) Wolf, C., Hildebrandt, H., Taylor, E. N., & Meisenheimer, K. 2008, A&A, 492, 933
- Wolf et al. (2009) Wolf, C., Aragón-Salamanca, A., Balogh, M., et al. 2009, MNRAS, 393, 1302