On type IIn/Ia-CSM supernovae as exemplified by SN 2012ca††thanks: Based on observations collected at the European Organisation for Astronomical Research in the Southern Hemisphere, Chile, as part of programme 188.D-3003 (PESSTO).
Abstract
We present the complete set of ultra-violet, optical and near-infrared photometry and spectroscopy for SN 2012ca, covering the period from 6 days prior to maximum light, until 531 days after maximum. The spectroscopic time series for SN 2012ca is essentially unchanged over 1.5 years, and appear to be dominated at all epochs by signatures of interaction with a dense circumstellar medium rather than the underlying supernova (SN). At late phases, we see a near infrared excess in flux which is possibly associated with dust formation, although without any signs of accompanying line shifts. SN 2012ca is a member of the set of type of the ambiguous IIn/Ia-CSM SNe, the nature of which have been debated extensively in the literature. The two leading scenarios are either a type Ia SN exploding within a dense CSM from a non-degenerate, evolved companion, or a core-collapse SN from a massive star. While some members of the population have been unequivocally associated with type Ia SNe, in other cases the association is less certain. While it is possible that SN 2012ca does arise from a thermonuclear SN, this would require a relatively high (between 20 and 70 per cent) efficiency in converting kinetic energy to optical luminosity, and a massive ( M⊙) circumstellar medium. On the basis of energetics, and the results of simple modelling, we suggest that SN 2012ca is more likely associated with a core-collapse SN. This would imply that the observedset of similar SNe to SN 2012ca is in fact originated by two populations, and while these are drawn from physically distinct channels, they can have observationally similar properties.
keywords:
supernovae: general – supernovae: individual: SN 2012ca, SN 1997cy, SN 1999E, SN 2002ic, SN 2005gj, PTF11kx – supernovae: circumstellar interaction1 Introduction
Supernovae (SNe) are the terminal catastrophic explosions of stars, and are produced by two main physical mechanisms. The first is a thermonuclear explosion (SN Ia) when a CO white dwarf (WD) approaches the Chandrasekhar limit after accreting hydrogen and helium from a companion star (the single degenerate channel), or through the merger of two WDs (the double degenerate channel; Hillebrandt & Niemeyer, 2000). The second mechanism is the gravitational collapse of the core of a massive star (CC-SNe), which will leave a compact remnant (Janka, 2012). CC-SNe are classified according to the presence (SNe II) or absence (SNe I) of H in their spectra; SNe I are further sub-divided into SNe Ib and SNe Ic depending on whether or not they show signs of He in their spectra (Filippenko, 1997). A relatively heterogeneous subclass of CC-SNe are termed type IIn, these show Balmer emission lines with composite profiles, including narrow emission components (Schlegel, 1990) which are formed as the SN ejecta collides with a dense, H-rich circumstellar medium (CSM), and are sometimes referred to as “interacting” SNe.
In the last two decades several examples of peculiar interacting SNe have been discovered, which were originally associated with the class of SNe IIn. The first to be discovered was SN 1997cy (Germany et al., 2000; Turatto et al., 2000), which showed multicomponent hydrogen lines superimposed on a continuum with broad SN features. Subsequently, SN 2002ic, which appeared quite similar to SN 1997cy, was shown to have pre-peak spectra that are not dominated by interaction111While SN 2002ic showed a narrow H emission line in its earliest spectra, it was not until 2 weeks post maximum that the interaction contributed more flux than the underlying SN (Hamuy et al., 2003). and resembling those of bright type Ia such as SNe 1991T and 1999aa (Hamuy et al., 2003; Deng et al., 2004; Wood-Vasey, Wang, & Aldering, 2004), although it did not show the typical -band secondary maximum seen in the lightcurves of type Ia SNe. Nevertheless, SN 2002ic was suggested to have a thermonuclear origin and led to the introduction of the label “Ia-CSM” in order to identify these transients. Approximately a dozen similar SNe have been found to date which have similar absolute magnitudes and spectra to SNe 1997cy and 2002ic (Silverman et al., 2013a), although only one of these has shown spectra not dominated by interaction (PTF11kx, Dilday et al., 2012; Silverman et al., 2013b).
These SNe exhibits obvious signs of their ejecta interacting with circumstellar material (CSM). Their spectra appear to be a “diluted” spectrum of a bright SN Ia, along with superimposed H emission lines. PTF11kx shows the strongest evidence for being a thermonuclear event interacting with CSM expelled by a companion red giant star (Dilday et al., 2012), including the typical SN Ia -band double peak. The growing arguments that many such events with narrow hydrogen - that according to standard SN taxonomy should be classified as type IIn SNe - could be thermonuclear has resulted in SN 2008J (Taddia et al., 2012) and several other transients such as SN 2005gj (Aldering et al., 2006; Prieto et al., 2007) being labelled as Ia-CSM SNe. In most cases, this has been based on the similarity of their interaction-dominated spectra, as for example in the sample presented by Silverman et al. (2013a). Following from this, Leloudas et al. (2015) investigated how the flux ratio between the underlying SN and the continuum affected the spectroscopic classification of these events, and argued that the fraction of Type Ib/c SNe with interaction that are misclassified as SN 1991T-like is probably small.
However, not all authors have interpreted such SNe as necessarily being thermonuclear events, with Benetti et al. (2006) and Trundle et al. (2008) arguing for a core-collapse origin for SNe 2002ic and 2005gj, respectively. These ambiguous and interacting events are important for determining the possible progenitor channels for SNe Ia in particular, but are rare.
SN 2012ca is the closest among these rare objects and the spectroscopic analysis - revealing O, C and He lines, together with a 200 km s-1 H - led Inserra et al. (2014) to propose a core-collapse origin for the SN. Inserra et al. found possible blueshifts in some of the identified lines, which we claimed could be accounted for by an asymmetric explosion and ejecta. On the other hand, Fox et al. (2015) disputed the identification of some of the intermediate mass element lines, and suggested a thermonuclear origin for SN 2012ca. In particular, Fox et al. noted that the low [Fe iii]/[Fe ii] ratio and strong [Ca ii] were similar to what is observed in super-Chandrasekhar mass candidates such as SN 2009dc (Taubenberger et al., 2011). Fox et al. also identified high-ionization coronal lines in the late time spectra of SN 2012ca, which they suggest arise from the CSM external to the shock front, and were excited by x-rays from ongoing interaction.
Since there is unambiguous evidence for a thermonuclear origin for only a single object (namely PTF11kx) we will refer hereafter to SN 2012ca and objects showing similar observables as type IIn/Ia-CSM. Here we report the full dataset collected by the Public ESO Spectroscopy Survey of Transient Objects (PESSTO)222www.pessto.org together with additional data (Sections 2, 3.2, 4 and 5), making SN 2012ca the best sampled object of this peculiar group of SNe. Section 6 is devoted to the analysis of the spectrophotometric data, in order to understand the origin of SN 2012ca and similar objects, and to investigate if they arise from a single progenitor channel or whether distinct sub-groups can be identified. Finally, a short summary is reported in Section 7.
2 Observations and data reduction
SN 2012ca (PSN J18410706-4147374) was discovered in the late-type spiral (SABc) galaxy ESO 336-G009 by Parker on ut 2012 April 25.6 at an unfiltered magnitude of m mag (Drescher, Parker, & Brimacombe, 2012). We performed our own photometry on the discovery image and find it to be at R=14.940.03 mag, as reported in Tab. 3 (see Sect. 3.2 for details of the photometry). The object coordinates have been measured on our astrometrically calibrated images to be , (J2000). SN 2012ca is located in an inner region outside the spiral arms of the host, 4.5 arcsec N/W of the centre of the host galaxy (Fig. 1), which corresponds to a projected distance of kpc from the nucleus for an adopted distance to ESO 336-G009 of Mpc (see Section 2.1). A spectrum taken by PESSTO at the New Technology Telescope (NTT) + ESO Faint Object Spectrograph and Camera 2 (EFOSC2) (Valenti et al., 2012; Inserra et al., 2012) on April 29.4 ut showed that SN 2012ca was a Type IIn SN resembling SN 1997cy 60 d after maximum.
2.1 Host galaxy properties
NED333NASA/IPAC Extragalactic Database lists a heliocentric radial velocity of km s-1 for ESO 336-G009. This is consistent with the redshift as measured from the narrow Balmer emission lines associated with SN 2012ca. Adopting a standard cosmology with km s-1, and , the distance modulus for SN 2012ca is 34.52 mag (80.3 Mpc).
The foreground Galactic reddening toward ESO 336-G009 is mag from the Schlafly & Finkbeiner (2011) dust maps. The available SN spectra do not show Na id lines from the host galaxy hence we adopt a total reddening along the line of sight towards SN 2012ca of mag.
In our last spectrum taken with NTT+EFOSC2 on 2013 October 13 no flux from the continuum or pseudo-continuum of SN 2012ca was detected (see Section 5). However the H features appears to be broader than expected for an unresolved line, possibly due in part to blending with [N ii] 6584. However, after deblending the lines, the H component still appears too broad (v1000 km s-1), and is likely still contaminated by the SN/SN+interaction contribution. While we were hence unable to measure the H flux of the host galaxy at the position of the SN, if we take the measured flux as an upper limit we can still derive an upper limit to the star formation rate (SFR) of the host galaxy at the SN location. We measured a flux FGal(H) (EW(H) 45.3 Å) which, given the distance of 80.3 Mpc, corresponds to erg s-1 and a star formation rate (SFR) 0.7 M⊙ year-1, assuming solar metallicity and applying the calibration of Kennicutt, Tamblyn, & Congdon (1994) and Madau, Pozzetti, & Dickinson (1998).
Type IIn/Ia-CSM have been observed both in late-type, mostly spiral, galaxies like SN 2012ca, SN 2008J and PTF11kx or in low-luminosity, low-metallicity environments such as SNe 1997cy, 2002ic, 2005gj. To date, no Type IIn/Ia-CSM have been found in early-type galaxies. These environments point towards a relatively young stellar population similar to those observed for core-collapse SNe, along with SN 1991T-like SNe Ia (Silverman et al., 2013a).
2.2 Data
Optical spectro-photometric follow-up was mostly obtained with the NTT+EFOSC2 as part of PESSTO. The EFOSC2 photometry was obtained using UBVR+griz filters, and was taken on the same nights as EFOSC2 spectroscopy. The EFOSC2 data were augmented by observations from other ground-based telescopes including the Panchromatic Robotic Optical Monitoring and Polarimetry Telescopes (PROMPT; Reichart et al., 2005) PROMPT3 and PROMPT5 + BVRIgriz and the Small & Moderate Aperture Research Telescope System (SMARTS)444Operated by the SMARTS Consortium + ANDICAM + RI, which are both at Cerro Tololo; the 2m Faulkes South Telescope (FST) + MEROPE + BVRI at Siding Spring and the 1m telescopes + SINISTRO + BVRI at Cerro Tololo and Sutherland of the Las Cumbres Observatory Global Telescope Network (LCOGT, Brown, 2013). Supplementary unfiltered data were provided by Stu Parker of the Backyard Observatory Supernova Search (BOSS) using a 0.35 m Celestron equipped with a SBIG ST-10XME camera, located at Parkdale Observatory, Canterbury. Additional optical and ultraviolet (UV) photometry was obtained with the Swift satellite + UltraViolet and Optical Telescope (UVOT) (programme ID 32453; P.I. Inserra). The EFOSC2 images were reduced (trimmed, bias subtracted and flat-fielded) using the PESSTO pipelines (Smartt et al., 2015) while the PROMPT, SMARTS and LCOGT images were reduced automatically by their respective instrument-specific pipelines.
Photometric zero-points and colour terms were computed using observations of Landolt standard fields (Landolt, 1992), 20 of the 52 nights on which SN 2012ca were observed were photometric. Using the photometry on these nights we calibrated the magnitudes of a local stellar sequence, shown in Fig. 1. The magnitudes of the local sequence stars are reported in Tables 7 & 8 along with their r.m.s. (in brackets). Finally, the average magnitudes of the local-sequence stars were used to calibrate the photometric zero-points obtained on non-photometric nights or where the colour terms were not determined from Landolt standard fields.
The near-infrared (NIR) images were obtained with NTT + SOn oF Isaac555The Infrared Spectrometer And Array Camera mounted on the UT3 at the Very Large Telescope (VLT) and decommissioned in Period 92. (SOFI) and were reduced using the PESSTO pipeline (for further details see Smartt et al., 2015). Multiple, dithered, on-source exposures were taken for SN 2012ca at each epoch; these images were flat-fielded and median-combined to create a sky frame. The sky frame was then subtracted from each of the individual images, which were then aligned and co-added. The NIR photometry obtained of the reference stars was calibrated against the Two Micron All Sky Survey (2MASS) catalog magnitudes (Skrutskie et al., 2006). The NIR photometry for SN 2012ca are reported in Table 6.
Our optical and NIR photometric measurements were performed using a point-spread function (PSF) fitting technique, with a fit to the transient and the sequence stars using the snoopy666snoopy makes use of the photometry routines within the daophot package. http://sngroup.oapd.inaf.it/snoopy.html package within iraf777iraf is distributed by the National Optical Astronomy Observatory, which is operated by the Association of Universities for Research in Astronomy (AURA) under cooperative agreement with the National Science Foundation..
Since instruments with very different passbands were used for the follow-up of SN 2012ca we applied a P-correction (Inserra et al., 2015), which is a passband correction similar to the S-correction (Stritzinger et al., 2002; Pignata et al., 2004), and allows us to standardise photometry to a common system, which were Sloan for griz and Bessell for UBVRI. This procedure takes into account the filter transmission function and the quantum efficiency of the detector, and the intrinsic spectrum of SN 2012ca, but does not include the mirror reflectance, as this is relatively flat across the optical range. The P-correction also does not include a correction for atmospheric transmission, as this is accounted for when calibrating our magnitudes to the local sequence of tertiary photometric standards. Our spectroscopic coverage allowed us to compute the P-correction using only the observed SN 2012ca spectra. As expected we found the largest effect in the U- and g- and -/-bands, with average corrections of , and mag, respectively. Whilst we found an average correction of . The greatest differences were found for the EFOSC2 filters (e.g. mag and mag). We note that the P-corrections from the EFOSC2 filter to both Sloan and Bessell filters were of a similar magnitude, allowing us to transform our photometry to both of these systems. Unfiltered images of the SN (including the discovery epoch) were obtained with a camera which has a response peaking in R-band, and so these were calibrated to this bandpass.
Swift+UVOT data (in the uvw2, uvm2, uvw1, u, b and v bands) were reduced using the HEASARC888NASA High Energy Astrophysics Science Archive Research Center. software package. Images obtained at the same epoch were co-added before aperture magnitudes were measured following the prescription of Poole et al. (2008). A 3″ aperture was used to maximise the signal-to-noise ratio (S/N). The standard Swift zero points were applied and subsequently Swift ubv magnitudes were transformed to the Landolt system applying shifts of , and . These shifts were quantified from the magnitudes of the sequence stars in the SN field.
Longslit optical spectra were obtained with the NTT+EFOSC2 on La Silla and with Gemini South + Gemini Multi-Object Spectrographs (GMOS) on Cerro Pachon, both in Chile. Integral field spectra were taken with the ANU 2.3 m telescope + the Wide Field Spectrograph (WiFeS, Dopita et al., 2010) at Siding Spring Observatory in northern New South Wales, Australia. All longslit spectra were reduced in the standard fashion (including trimming, overscan, bias correction, and flat-fielding) using standard routines within iraf. In the case of spectra observed with EFOSC2 these steps were performed within the PESSTO pipeline (Smartt et al., 2015). Wavelength calibration was performed using spectra of comparison lamps acquired with the same configurations as the SN observations. EFOSC2 spectra were corrected for telluric absorption by subtracting a model spectrum of the sky bands. For WiFeS the pywifes999http://www.mso.anu.edu.au/pywifes/ package (Childress et al., 2014) was used to reduce the spectra and produce data cubes, from which the final spectra were obtained using a PSF weighted extraction routine. The resolutions of the longslit spectra were checked against the full width at half-maximum (FWHM) of narrow night sky emission lines and are reported in Tab. 9. Flux calibration was performed using spectrophotometric standard stars observed on the same nights and with the same configuration as SN 2012ca. The flux calibration was checked against the photometry by integrating the spectral flux under standard Sloan or Bessell filters, and adjusting by a multiplicative factor when necessary. The resulting flux calibration is accurate to within 0.1 mag. We note that at the wavelength of H EFOSC2 and GMOS spectra have a resolution in velocity space of km s-1, while WiFeS has a resolution km s-1.
NIR spectroscopy was obtained solely with NTT+SOFI. Spectra were wavelength calibrated via spectra of comparison arc lamps acquired with the same configuration as the SN observations. Solar analogs were also observed at a similar airmass and time to SN 2012ca in order to facilitate the removal of telluric absorptions between 1 and 2 m. For three epochs a flux standard was observed on the same night and using the same configuration as the SN spectra, and was used to calibrate these. For the other epochs we used the telluric standard and Hipparcos photometry to flux calibrate the spectra of SN 2012ca. The difference in measured flux between the two methods were within mag.
All PESSTO spectra are available through the ESO Science Archive Facility (SAF) as standard phase 3 ESO products. The reduced images taken by PESSTO are also available for download from the PESSTO home page and data access instructions are available on www.pessto.org. All spectra, including the non-ESO data, are available on WISeREP101010http://wiserep.weizmann.ac.il/ (Yaron & Gal-Yam, 2012).
3 Photometry
3.1 Peak and explosion epoch
In this work we revised the epoch of maximum light with respect that of Inserra et al. (2014). The previous peak epoch was based on a spectroscopic comparison of our classification spectrum with that of SN 1997cy, which does not have precise information about peak epoch. In this paper we present additional photometric points in the UV and in the optical (cfr. Tabs. 3, 4 and 5) around the epoch of our first spectrum that allow us to better determine the peak epoch. Using a low order polynomial we fit the -band data and found the maximum light to be at MJD (2012 May 1.2), which is 60 days later than that previously reported. To estimate the uncertainty on the epoch of the lightcurve peak, we calculated the difference when using polynomial fits of second, third and fourth order; the difference in the peak epoch when fitting the -band and -band data; and the additional uncertainty due to the conversion from unfiltered to -band magnitudes. For the latter, we refitted the peak of the lightcurve using the lower and upper extrema of the 1 photometric error on the unfiltered data. We then added all of these in quadrature to determine the total uncertainty of d.
If we consider that SN 2012ca is probably already affected by CSM interaction in the earliest data, the peak epoch is somewhat uncertain. While the rise to peak is based on a limited number of pre-maximum measurements, taken with different filters, the spectral comparison also suggests that SN 2012ca was classified around peak or at the latest few weeks after. We note that the evaluation of the peak epoch has the largest effect on the kinetic energy estimate (see Sections 4 & 6) in that more energy would be required to power the light curve if the peak epoch is earlier than our estimate. Estimating the explosion epoch is made harder by the fact that we have no information about the underlying SN ejecta - and hence about the type of explosion mechanism - and when the interaction starts to dominate the light curve evolution. In -band we observe a rise time of 0.19 mag in 5 days. If we assume that the contribution to the luminosity from interaction does not change during the light curve rise, and that there is at least a 2 magnitude rise from the explosion to the peak, we can make a very rough estimate that the explosion happened on MJD (2012 March 12).
3.2 Light and colour curves
Pre-peak observations are available in gR bands, while and UV start at peak. We continued to observe the SN until it disappeared behind the Sun in late November 2012. We continued the follow-up from March 2013 until October 2013, when the SN was too faint to be detected with NTT.
The decline post maximum light is steady in all bands until November 2012 (shown as S1 in Fig. 2), when SN 2012ca disappeared behind the Sun. The decline in R is 0.62 mag 100d-1, which is similar to that shown by SNe 1997cy and 2005g (0.75 and 0.88 mag 100d-1 respectively), but slower than that of SN 2002ic (1.66 mag 100d-1, measured in V-band) and PTF11kx (3.30 mag 100d-1). Curiously, the only two SNe that showed type Ia spectra around peak, namely SN 2002ic and PTF11kx, are those with the fastest decline, whilst the decline of the other SNe resembles more that of type IIn SNe such as SN 2010jl (0.74 mag 100d-1).
When SN 2012ca was again observable in 2013 March, its decline rate had steepened, and went on to show two noticeable phases. The first phase (labelled S2 in Fig. 2), lasts from 2013 March to June, 322 to 409 days after peak, with a decline of 1.33 and 0.93 mag 100 in R- and V-band. There is a second, steeper decline afterwards ending at 531 days post peak with 2.4 and 3.3 mag 100 in R and V, respectively (labelled S3 in Fig. 2). Such a change in the decline may indicate the end of the main interaction that powered the luminosity of the SN since its first detection (see Section 6). The steepness of the decline looks to increase progressively as strengthened by a non-detection of the SN at 560 days after peak and the absence of SN spectral feature in the last spectrum (see Section 5) obtained 30 days before the non-detection.
The UV data also show a constant, slow decline in the first 30 days after maximum light. A similar behaviour is shown in the NIR bands during the 2012 follow-up campaign. However, in early 2013 we see a flattening of the light curve that lasts until 551 days in K-band, while the decline in J and H from 346 days onward is slower than that observed in the optical bands. We measured decline rates of 1.31 and 0.51 mag 100 d-1 for J- and H-band, respectively. This behaviour would suggest ongoing dust formation as a consequence of the interaction of the SN ejecta with the H-rich CSM, even if we do not see a blue shift over time in the H profile (see Section 5).
The colour evolution of SN 2012ca is shown in Figure 3 together with that of SNe 1997cy, 2005gj, 2010jl and PTF11kx. We note the colour curve has a slow monotonic increase towards the red until 120 days. After that, it remains constant at until 320 days when it increases again toward the red. With the exception of , all colours show almost constant evolution for the first 320 days. The last increase appears in all the colours and it is greatst in and . The comparison shows SN 2012ca has a constant optical colour through the entire evolution similar to that of SN 1997cy. Both SNe have a similar behaviour to that of a prototypical SN dominated by interaction as SN 2010jl. The early increase in PTF11kx is due to the underlying thermonuclear ejecta.
4 Bolometric luminosity
To obtain a direct measurement of the bolometric luminosity of a SN, UV to NIR photometry covering all epochs is required. While this is typically difficult to obtain at all epochs during a SN light-curve, for SN 2012ca we have extensive coverage. Nevertheless, the UV data end at 30 days after peak, and so we extrapolated the UV contribution in time until 80d after maximum, when the extrapolation reaches zero (see Figure 4). The extrapolation was chosen over a blackbody fit to the observed bands at each epoch, as the latter does not well reproduce the spectral energy distribution (SED) of a SN interacting with a circumstellar matter.
To construct the bolometric lightcurve, the broad band magnitudes in the available optical bands were converted into fluxes at the effective filter wavelengths, then were corrected for the adopted extinctions (cfr. Section 2.1). An SED was then computed over the wavelengths covered and the flux under the SED was integrated assuming there was zero flux beyond the integration limits. Fluxes were then converted to luminosities using the distance adopted previously. In the following, we will use the term “pseudo-bolometric light-curve” to refer to a bolometric light-curve determined using only the optical filters and “full bolometric light-curve” for a light-curve including UV through NIR contributions. We initially determined the points on the pseudo-bolometric light-curve at epochs when simultaneous (or very close in time) UBVRIgriz data were available; for later epochs ( 340 days) the bolometric luminosity was computed where there was coverage in less than four filters. Magnitudes from the missing bands were generally estimated by interpolating the light curves using low-order polynomials between the nearest points in time. For some points this interpolation was not possible and we used an extrapolation assuming constant colours from neighbouring epochs.
In Figure 4 (top left) we show the difference between the SN 2012ca pseudo-bolometric and full bolometric light-curves. The overall luminosity of the full bolometric light-curves is obviously higher over time. The full bolometric light-curve peaks at erg s-1, while the pseudo-bolometric light-curve has a maximum at erg s-1. As shown in the bottom left panel of Figure 4, the NIR contribution increases from 200 d onwards, and becomes the main contributor to the total luminosity after 500 days. This NIR excess is an indication of dust formation. Dust formation has been seen in SN 2012ca-like objects, especially at mid-infrared wavelengths (Fox & Filippenko, 2013).
In the Swift+XRT data taken along with the first seven epochs of UVOT imaging, which had average exposure times of 2 ks, we did not detected any x-ray emission at the position of the SN. We set an upper limit to the x-ray flux of 8.3 erg cm-2 s-1, corresponding to erg s-1. While this limit would have allowed us to detect the x-ray bright Type IIn SN 2010jl, which had a peak x-ray luminosity of erg s-1 (Chandra et al., 2015), many other SNe have x-ray fluxes below this limit (Dwarkadas & Gruszko, 2012).
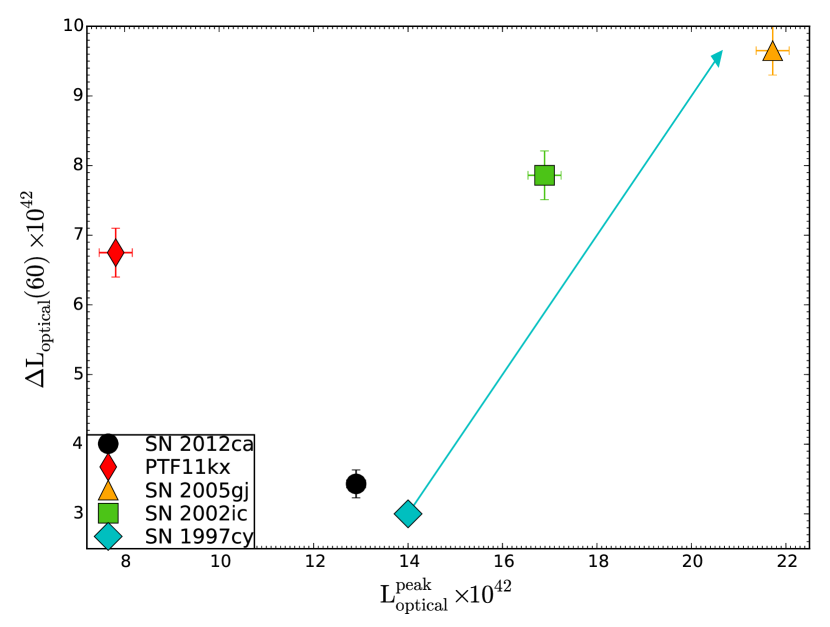
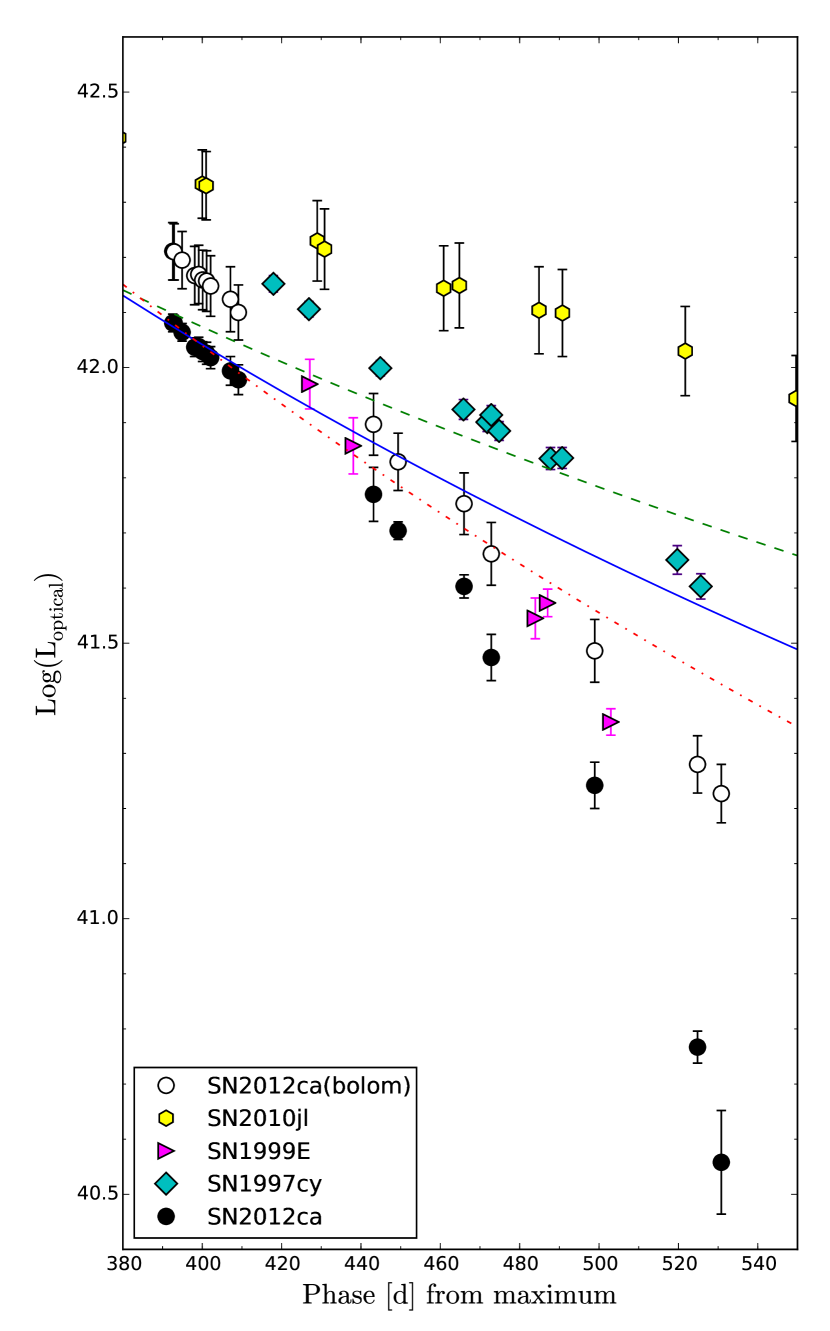
In the right panel of Figure 4 we show a comparison of SN 2012ca pseudo-bolometric light-curve with those of other type IIn/Ia-CSM, namely SNe 1997cy (BVRI; Germany et al., 2000; Turatto et al., 2000), 1999E (UBVRI Rigon et al., 2003), 2002ic (BVI; Hamuy et al., 2003; Wood-Vasey, Wang, & Aldering, 2004), 2005gj (ugriz; Prieto et al., 2007) and PTF11kx (gri; Dilday et al., 2012; Silverman et al., 2013b) together with a normal, long-lasting type IIn SN 2010jl (UBVRI; Zhang et al., 2012; Fransson et al., 2014) and the bright type Ia SN 1991T (UBVRI; Lira et al., 1998). Spectroscopic and photometric similitudes between SN 2002ic and PTF11kx - the only two objects showing early spectra not dominated by interaction - and bright type Ia SNe such as SN 1991T and SN 1999aa have already been shown in the literature (Hamuy et al., 2003; Dilday et al., 2012). SN 2012ca shows a slowly declining light-curve that is inconsistent with the decay of 56Co to 56Fe. A similar decline is seen in SN 2012ca, SN 1997cy and SN 1999E from 100d to 300d, while SN 2002ic and PTF11kx are also consistent from 200d to 300d when their light curves are also dominated by interaction. We note that the set of IIn/Ia-CSM SNe shown in Fig. 4 appear to divide into two classes. The first set of objects, comprising SNe 2012ca, 2005gj 2002ic, 1999E and 1997cy have a slow decline over timescales of 1 yr. Distinct from these is PTF11kx, which appears to show a similar peak luminosity, but a much more rapid initial decline similar to that seen in the Type Ia SN 1991T, followed by a slowly declining (and presumably interaction dominated) tail phase which is a factor 10 fainter than the first set of SNe.
Bearing in mind the caveat regarding the uncertainties on the epoch of maximum light (see Section 3.1), we note that the shape of the light-curve of SN 2012ca around peak appears different to that of SN 2002ic and PTF11kx, with a flatter decline and a less rounded shape. From the other objects with coverage around peak, it appears that SNe with a higher peak luminosity have a slower decline post peak (see Fig. 5). If the characteristics of the inner ejecta are the same for these SNe, then this could be explained with an increase in interaction due to a more massive or more dense CSM. SN 2012ca does not appear to follow such a trend (although we caution that if the peak was earlier, it would also have been brighter), while SN 1997cy has insufficient photometric coverage around maximum to test its evolution.
After 150d the interaction is the main power source of the luminosity both for PTF11kx and the bright type IIn/Ia-CSM like SN 2012ca. However, the difference in luminosity at 150d between PTF11kx and a SN 1991T-like object is a factor 3, while for SN 2012ca and the other comparison objects it is a factor 25. At one year post-maximum, SN 2012ca and the other type IIn/Ia-CSM SNe are more than 100 times brighter than a SN 1991T-like SN Ia at a comparable epoch. This means that at +1 yr, a spectrum of SN 2012ca, or another SN with similar luminosity such as SN 1997cy should be dominated by the CSM interaction, and that naively the lines arising from the SN ejecta should comprise less than 1 per cent of the emergent flux.
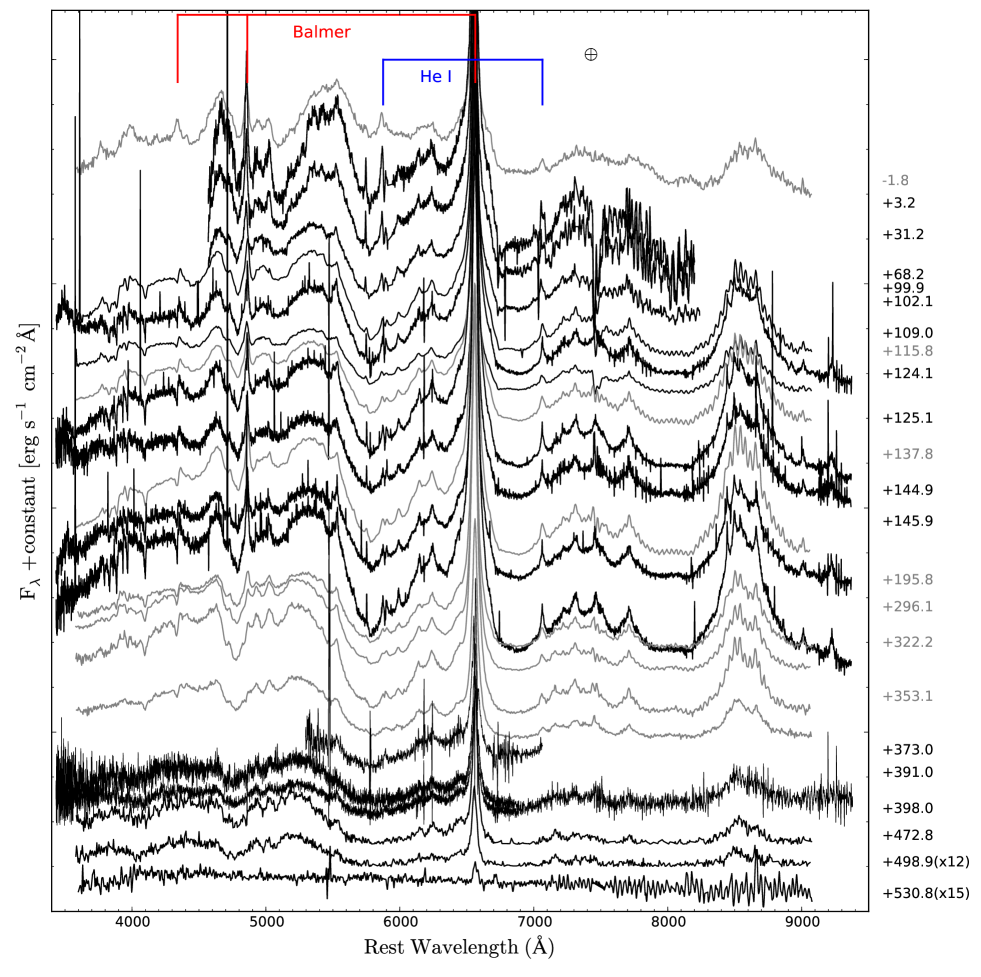
5 Spectroscopic evolution
In Figure 6 we show the optical spectroscopic evolution of SN 2012ca from soon before maximum light to 500 days after peak. At all epochs, the spectrum is characterised by a relatively flat continuum, and narrow emission lines of H and He with a Lorentzian profile. Ca NIR is also present, while Fe lines and are blended together to form a blue “pseudo-continuum” below 5500 Å.
The only noticeable evolution in the first 100 days is the slight relative change in flux between He i 5876 and the surrounding region of the spectrum. The blue pseudo-continuum (Smith et al., 2009), which mainly arrises due to multiple Fe lines is visible since the first spectrum and does not evolve for the whole first year. At wavelengths bluer than 5600Å the only differences from 400d onwards are the weakening of the Balmer lines and the decreasing toward the blue of the red shoulder of the pseudo-continuum (cfr. Figure 7). He i 5876 and 7065 are also present from the earliest to the last spectrum, along with the NIR He i lines 10830 and 20589. The NIR Ca is seen in the first spectrum, and is still visible at 500 days post peak, while the Ca H&K lines could contribute to some of the line at 4000 Å. The former, broad feature is due to electron scattering and the decrease in prominence of the wings over time is indicative of a reduction of the phenomenon (see Figures 2 & 3 of Inserra et al., 2014, for further line identifications). In a previous paper (Inserra et al., 2014) we identified the two emission lines on the blue side of H as [O ii] 6300,6364, and tentatively identified the line around 7000 Å as O i 7774 which is blueshifted by 2500 km s-1. However, Fox et al. (2015) noted that such apparent blueshifted O lines are seen at similar velocity offset in other type IIn/Ia-CSM such as SNe 2013dn and 2008J, making this explanation unlikely. Hence, a more plausible identification for these lines is multiplet 42 of Fe ii 6248 and [Fe ii] 7720.
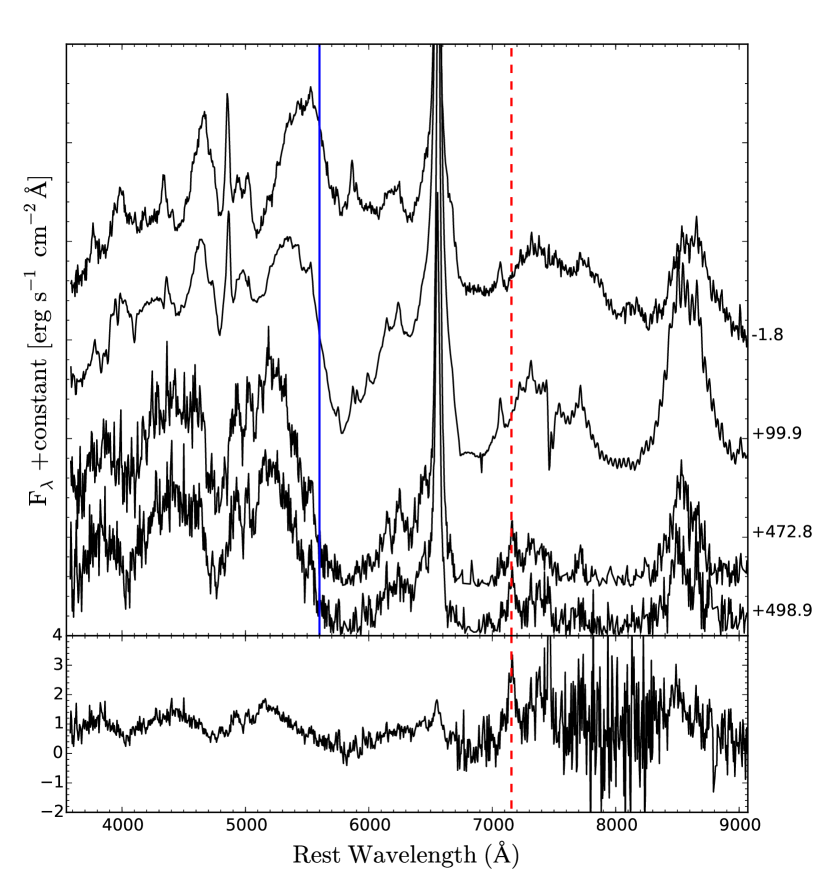
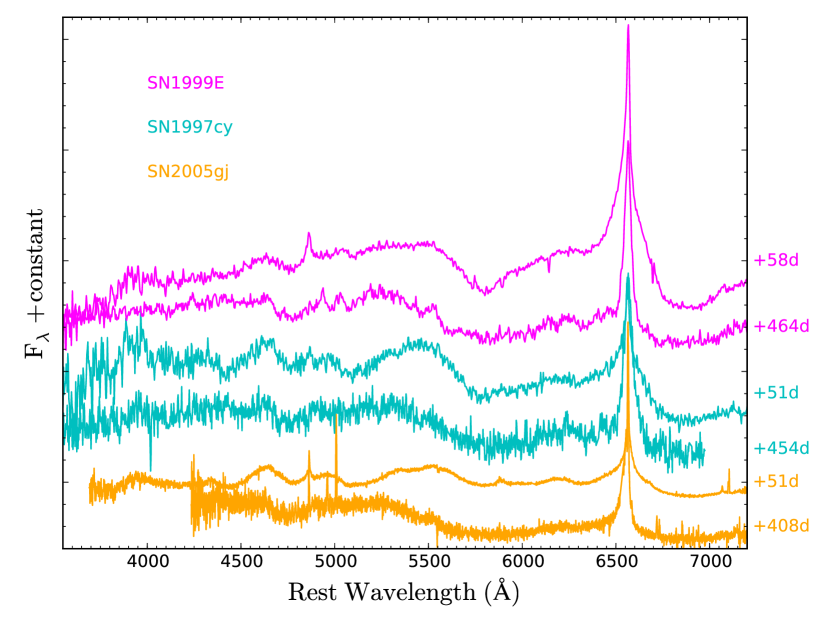
The almost complete lack of evolution of the spectra of SN 2012ca in 500 days is highlighted in Figure 7 where the spectra from pre peak, +100 days and the final two spectra obtained are compared. The most striking difference is the appearance of a new line in the latest spectra at 7155Å, which is not visible prior to 350 days. In order to confirm the presence of this line, in the bottom panel of Figure 7 we show the residual after subtracting the spectrum at 100 days from the final spectrum taken at 500 days. Both spectra were taken with the same telescope and instrumentation (see Table 9). Aside from some broad undulations due to a change in the strength of the pseudo-continuum and some weak residuals at the position of H and Ca ii, the only feature is the line at 7155Å, which we identify as [Fe ii] 7155 with km s-1. This line is usually seen in the late time spectra of both core-collapse and thermonuclear SNe, however we believe the origin of this feature is in the CSM, as it has a similar FWHM to H at that epoch ( km s-1). The absence of [Ni ii] 7378 and [Ca ii] 7291,7234 which are usually observed at similar epoch together with [Fe ii] strengthens the case that this line has CSM origin. The almost complete lack of evolution is also visible in the other SNe similar to SN 2012ca that have spectroscopic coverage spanning at least over 300 days from the first spectrum dominated by interaction. In Figure 8 such SNe, namely SNe 1997cy, 1999E and 2005gj show similar broad undulation to those of SN 2012ca - which is shown for comparison - although weaker in amplitude. This suggest as the lack of evolution is a common feature among these SNe.
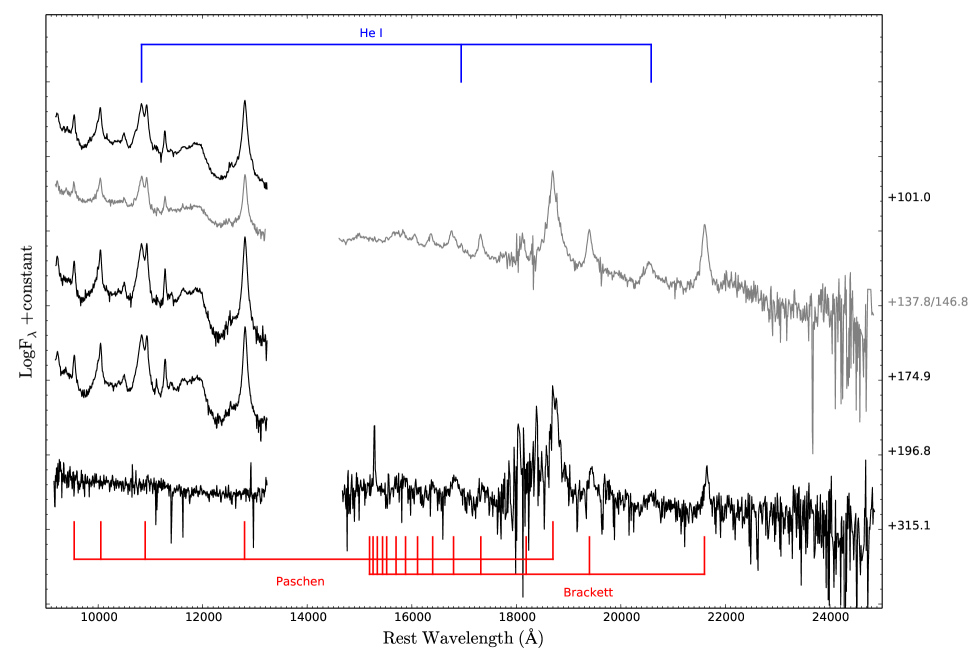
The NIR spectroscopic evolution of SN 2012ca (see Figure 10) is mostly dominated by the Paschen and Brackett series of H, together with the aforementioned He i lines. O i 1.129 m is also visible as well as Mg i 1.183 m, which is possibly blended with [Fe ii] lines. In case of normal recombination, the presence of O i 1.129 m would imply the presence of a stronger O i 7774 line, which is not observed in our data. The absence of this line suggests that O i 1.129 m line can be observed because of a fluorescence effect, as the O i 1025 2p4(3P)-3d(3D0) transition lies within the Ly Doppler core and the O i 1.129 m 3p(3P)-3d(3D0) transition is optically thin (see Jerkstrand et al., 2012, for further details).
In summary, the spectroscopic evolution of SN 2012ca is dominated exclusively by H, He, Fe, Ca, and O, together with some small contribution from other metals such as Mg. Lines from ionised species, except Fe ii, are absent. As already shown by Fraser et al. (2015) such elements are easy to reproduce by an inner hydrogen zone of a core-collapse SN showing only line flux arising from material present in the envelope of the pre-explosion progenitor (based on the model of Jerkstrand et al., 2012).
The last two spectra (473d and 499d) do not show any significant dimming of the red wing of H or blue-shift in the peak of H, which could be associated with the attenuation of emission originating in the receding layers by dust. Blue-shifted line peaks are one of the observational signatures of dust in SN ejecta and so this may appear in contrast to the NIR excess shown in Section 4. However, this could mean that dust is not formed inside the ejecta but in a cool dense shell created by the SN–CSM interaction, close to the layer responsible of the hydrogen emission. Unfortunately, the absence of mid infrared observations at late times makes the determination of the site of dust formation very difficult.
| SN | Host type | Peak | Pre-interaction-dominated | Unshocked wind | I-band | References |
|---|---|---|---|---|---|---|
| (mag) | spectra | (km/s) | double peak | |||
| SN 2012ca | late-type spiral | (R) | No | 200 | - | (1) |
| SN 1997cy | compact-faint | (V) | No | - | - | (2) |
| SN 1999E | late-type irregular | (V) | No | 200 | - | (3) |
| SN 2002ic | compact-faint | (V) | Yes (SN 1991T-like Ia | - | No | (4) |
| or SN 2004aw-like Ic) | ||||||
| SN 2005gj | late-type irregular | (r) | No | 100-300 | No | (5) |
| SN 2008J | late-type spiral | (V) | No | - | No | (6) |
| PTF11kx | late-type spiral | (R) | Yes (SN 1991T-like Ia) | 65 | Yes | (7) |
(1) - Inserra et al. (2014) and this work; (2) - Turatto et al. (2000), (3) - Rigon et al. (2003); (4) - Hamuy et al. (2003); Deng et al. (2004); Wood-Vasey, Wang, & Aldering (2004); Benetti et al. (2006); (5) Aldering et al. (2006); Prieto et al. (2007); Trundle et al. (2008); (6) - Taddia et al. (2012); (7) - Dilday et al. (2012); Silverman et al. (2013b)
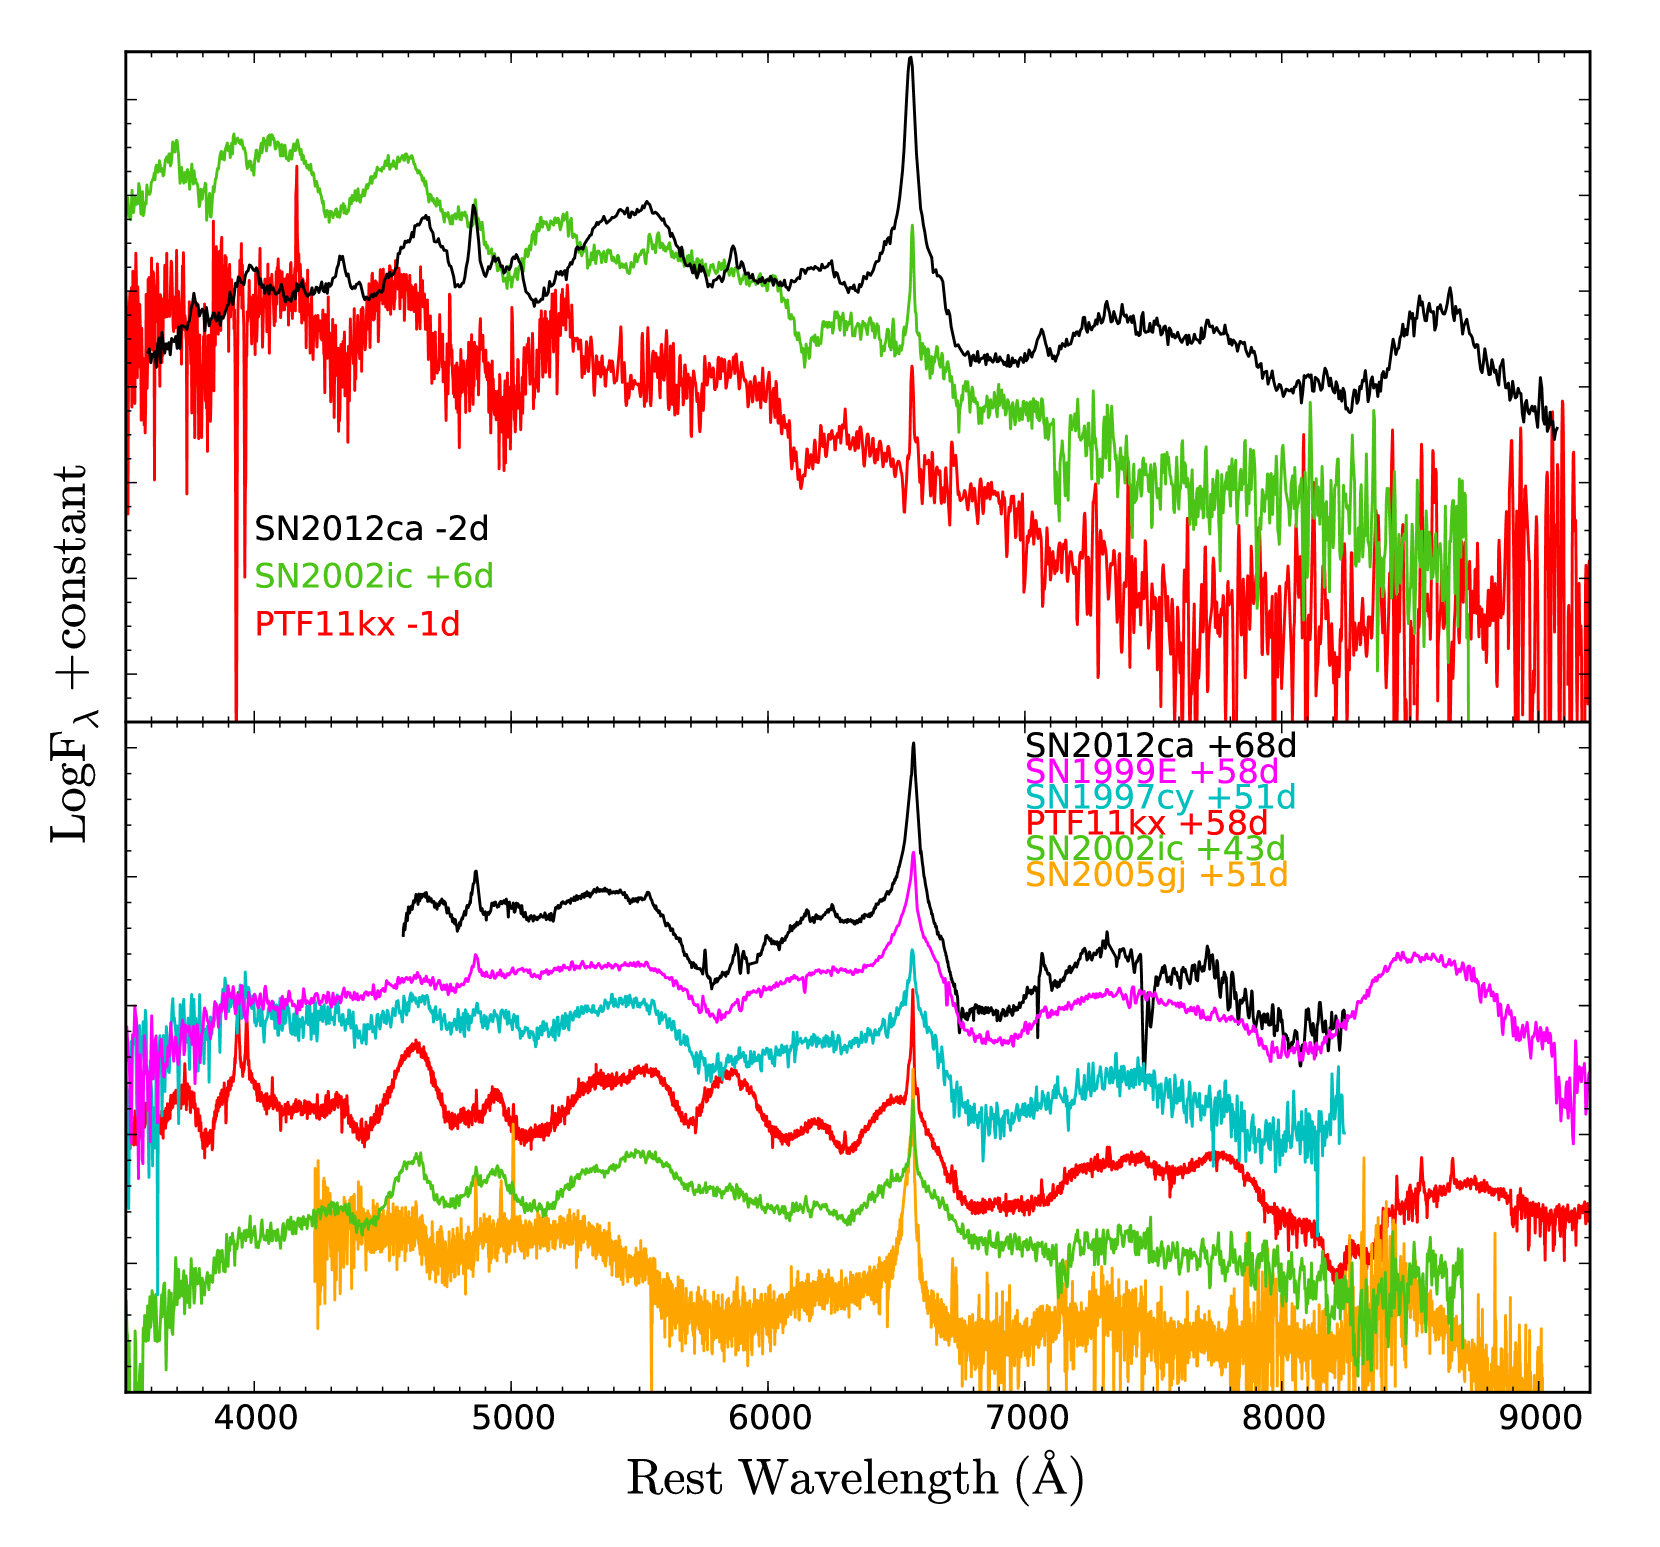
With the caveat that the epoch of maximum light for is not well constrained, the first spectra obtained for SN 2012ca are different from those of SN 2002ic and PTF11kx. Indeed, as shown in the top panel of Figure 9, the spectrum of SN 2012ca is already dominated around maximum light by H, Fe and Ca features arising from the ejecta interaction with the H-rich CSM. On the other hand (and with the exception of PTF11kx, which has the lowest degree of interaction as suggested from its photometric evolution), as the relative contribution of interaction to the lightcurve increases, the spectra of all objects in this observational class become more similar. However, some differences do remain: in the bottom panel of Fig. 9 we see that SN 2012ca, SN 1997cy and SN 1999E show a similar multi-component H profile with Lorentzian wings for the intermediate velocity component. Such wings are instead absent in both PTF11kx and SN 2002ic, which display a more Gaussian profile (for PTF11kx), or a combination of Gaussian and Lorentzian profiles (for SN 2002ic). The features arising in the blue pseudo-continuum and the NIR Ca ii triplet are comparable among SN 2012ca, SN 1997cy and SN 1999E. The features bluer than 5000 Å exhibited by SN 2002ic and PTF11kx are stronger with respect to the pseudo-continuum, but this could be a consequence of a smaller contribution from interaction, with PTF11kx showing the weakest interaction among this sample. The SN 2005gj spectrum has lower S/N than the others, but overall resembles SNe 1997cy, 1999E and 2012ca more than PTF11kx or SN 2002ic.
6 On the origin of SN 2012ca and type IIn/Ia-CSM
SN 2012ca is the best sampled object within the observational class111111We use the term “observational class” here to identify a group of objects which share a set of broadly similar observational characteristics, while remaining agonistic as to whether these come from a single set of physically similar progenitors. of possible type IIn/Ia-CSM SNe, albeit with limited information prior to maximum light. Moreover, it is the only object with UV monitoring. As a consequence, it can serve as an archetype for the post-maximum evolution of the set of type IIn/Ia-CSM SNe, or at least those which show a similar light curve, i.e. excluding PTF11kx. As mentioned in Section 4, the luminosity of SN 2012ca at 365 days from peak, as well as the luminosity of SNe 1997cy, 1999E, 2002ic and 2005gj are more than 100 times brighter than a bright type Ia SN at a comparable epoch. This implies that the interaction of ejecta with CSM is responsible for 99 per cent of the total luminosity of the SN at late times. Moreover, only the CSM should be responsible for the line flux observed in SN 2012ca from 365 days onward. We note that spectropolarimetric information is available for SN 2002ic at year from maximum (Wang et al., 2004) and suggests a dense, clumpy, disk-like CSM. Hence at early epochs there could be some caveats about the ejecta flux contribution due to viewing angle. Since we have shown that there is no spectroscopic evolution in SN 2012ca from the epoch of peak luminosity onwards, and that the relative intensity between lines does not change abruptly or significantly, then we can assume that the spectroscopic evolution of SN 2012ca is a consequence only of the physical conditions within the CSM and is not related to the underlying SN ejecta at any epoch. A similar result can be obtained by applying the criteria for a SN to be visible under circumstellar interaction presented by Leloudas et al. (2015). Taking the absolute magnitude of SN 2012ca at peak in V-band (), we find that for a SN to be effectively ”hidden” under the interaction requires it to be fainter than . The remarkable spectroscopic similitude between SN 2012ca and SNe 1997cy and 1999E suggests that this result also applies to the latter two. In contrast, this is only true for SNe like SN 2002ic and PTF11kx after 60-100 days, and when the early non-dominated interaction spectra have disappeared. In general we can assert that all the objects classified as type IIn/Ia-CSM and having luminosity comparable to that of SN 2012ca, SN 1997cy, SN 2002ic and SN 2005gj after 150 days have spectra fully dominated by the interaction, since the ejecta contribution to the observed spectrum is 5%.
A physical constraint on the light-curves of interaction powered SNe is that their integrated luminosity from CSM interaction must be lower than the total kinetic energy available from the SN ejecta. For SN 2012ca the integrated luminosity under the bolometric light-curve is E erg, while the available energy found in typical type Ia SN explosion models is E erg (Hillebrandt & Niemeyer, 2000; Röpke et al., 2007; Mazzali et al., 2007). If SN 2012ca is powered by the collision of the ejecta of a type Ia SN with a CSM, then it would necessitate a conversion efficiency from kinetic energy to luminosity of between 20 and 70 per cent. For comparison, Fraser et al. (2013) estimated from the relative ejecta and shock velocitites that the conversion efficiency in the interacting transient SN 2009ip could be as high as 90 per cent. Furthermore, if the peak happened before earlier than that estimated (see the uncertainties in Section 3.1), the integrated bolometric luminosity of SN 2012ca would be larger, implying a higher conversion efficiency, making the thermonuclear scenario even less likely. Core-collapse SNe can span from E erg (Filippenko, 1997; Iwamoto et al., 1998), and hence have a factor 2 to 100 times more energy available than from thermonuclear explosions. This would allow a lower, and perhaps more plausible conversion efficiency of between 1 and 30 per cent. However, while an efficient conversion may be required, a thermonuclear explosion cannot be ruled out for SN 2012ca on the basis of energetics.
We also note that after a year from maximum light the bolometric light-curve for SN 2012ca changes slope as discussed in Section 3.2. A change in the slopes of SNe 1997cy and 1999E was also observed at a similar phase. These three SNe are the only ones with data after a year from peak. The change in decline lasts almost 90 days for SN 2012ca and SNe 1999E, and 1997cy. That could be a consequence of the fact that the reverse shock stops playing a role and the forward shock is slowing down rapidly. This happens when the mass of the shocked CSM is comparable to that of the ejecta and the reverse shock finishes crossing the ejecta (Svirski, Nakar, & Sari, 2012). The slope of the decline depends on whether the shock is adiabatic (=5, Sedov-Taylor phase)121212 is the index of the power-law describing the density profile of the moving ejecta. or the internal energy behind the shock is radiated away (, snowplow phase). A power-law decline with =4 is similar to what is observed in the bolometric lightcurve of SN 2012ca from 360 to 450 days and the pseudo bolometric lightcurve of SN 1997cy from 410 to 500 days (see Figure 11). At these epochs the pseudo bolometric light curves of these objects have a steeper decline due to the decrease of the optical contribution to the total flux (see Section 4). This is broadly consistent with that experienced by SN 2010jl (Ofek et al., 2014). The second, even more abrupt decline, could be due to an increase in dust production leading to additional attenuation of the optical flux, or because the forward shock became definitively inefficient as a consequence of a drop in the wind density (Chevalier & Irwin, 2011).
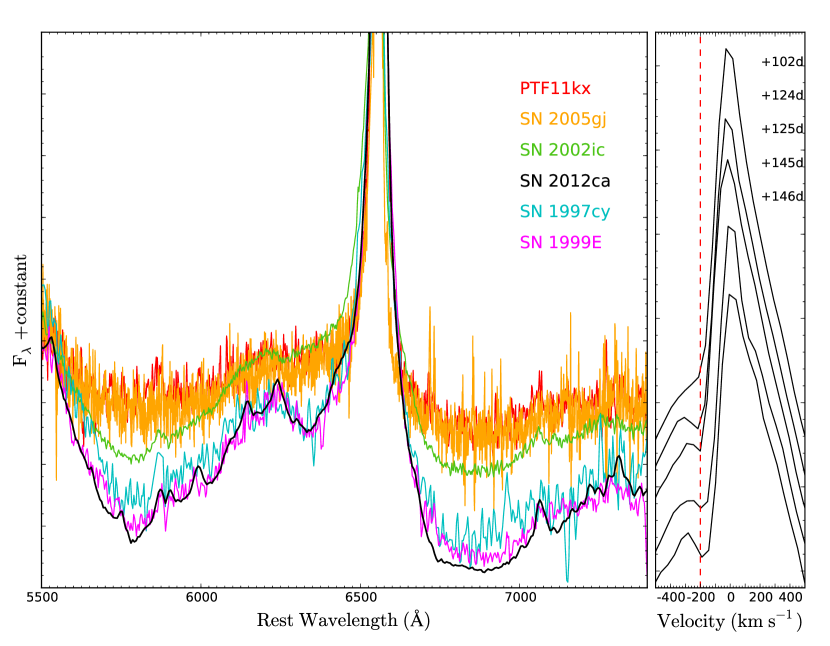
Another feature that could give us a valuable insight into the progenitor scenario is the narrow P-Cygni absorption seen in the line profile of H (see right panel of Figure 12). As discussed in Inserra et al. (2014), in high resolution spectra of SN 2012ca taken with WiFeS we observe a narrow P-Cygni absorption in H with km s-1. This velocity is a factor 2 or 3 greater than that observed in probable diffuse CSM arising from the progenitor companion to some SNe Ia ( km s-1; Patat et al., 2011) and similar to those observed in Luminous Blue variable (LBV) winds , but is still comparable to that observed in a small fraction of SNe Ia ( km s-1; Sternberg et al., 2011). We also note that SN 1999E had a similar narrow P-Cygni absorption in H ( km s-1; Rigon et al., 2003), while the less luminous PTF11kx has a lower velocity absorption at km s-1 (Dilday et al., 2012). Once again, the wind velocity is potentially consistent with both peculiar thermonuclear and core-collapse scenarios for SN 2012ca and other events such as SNe 1997cy and 1999E.
A possible additional clue is the variation of the line profile in the region 5800 Å – 7200 Å. As reported in Section 5 this region is the only one which evolves from the first spectrum before peak onwards. However, the sharp profile on the blue edge of this region, mainly dominated by H, is not observed at any stage in PTF11kx and SN 2005gj but are shown by SN 1997cy and SN 1999E (cfr. Figure 12). SN 2002ic seems a borderline case but the overall shape is more similar to PTF11kx and SN 2005gj than the others as already observed in the comparison with SN 1997cy shown by Hamuy et al. (2003). Although this is mere phenomenology, it is interesting how SNe 1997cy, 1999E and 2012ca are almost identical, and dissimilar to PTF11kx.
6.1 Modelling the CSM of type IIn/Ia-CSM
In Section 5 we have shown that all the elements observed in the spectra of SN 2012ca can be explained as originating in the CSM. This, together with the lack of spectral evolution over 500 days suggest how little information on the underlying physical cause of these SNe can be obtained from their spectra. As an alternative approach, we compared simple models to the light-curves of these SNe in order to retrieve information on the ejecta and CSM masses.
We fit our light curves with an analytical model implemented by Nicholl et al. (2014) and based on the equations of Chatzopoulos, Wheeler, & Vinko (2012) that presented a semi-analytical model for the case of ejecta colliding with an optically thick CSM. The approximation used for the radiative diffusion of shock-deposited energy in the CSM is similar to that of Arnett & Fu (1989). We note that for SNe Ia an exponential ejecta profile is perhaps preferred to a power-law. However, as already stated by Wood-Vasey, Wang, & Aldering (2004), this profile does not yield an analytical solution and so we assume a power-law profile.
Since we have a H-rich CSM we set our opacity to be cm2 g-1, and allow five variables to vary freely in the fit, namely the ejecta, CSM and 56Ni masses, the inner radius of the photosphere/pseudo-photosphere formed in the CSM, and the kinetic energy of the SN explosion. We also experimented with different CSM density profiles, including an profile as expected from a stellar wind, and a uniform density shell which could be produced by a single eruption. Finally, we tested the effect of applying additional physically-motivated constraints on the possible ejecta and CSM masses. We limit the ejecta mass to that expected for a type Ia SN (MM⊙, Scalzo et al., 2014), as well as that of 56Ni (MM⊙, Childress et al., 2015) that is more than 20% of the ejecta as suggested by Umeda & Nomoto (2008). We also constrain the CSM mass to less than the mass of a possible asymptotic giant branch (AGB) or super-AGB star companion (MM⊙; Meynet et al., 2015; Pumo et al., 2009, and references therein), as stars more massive than this are expected to explode as core-collapse supernovae in a relatively short time (40 Myr), and will hence are unlikely to survive long enough to produce the CSM for SN 2012ca if it arises from a Type Ia explosion.
The steady wind models give the lowest . Fig. 13 shows the best fits with and without the aforementioned constraints on progenitor and ejecta mass. To reproduce the bolometric light-curve of SN 2012ca we require M M⊙ and M M⊙ (see Table 2). Although the ejecta mass is consistent with that of a type Ia SN, the mass of CSM is higher than that expected to be stripped from the companion (0.11-0.20 M⊙; Pan, Ricker, & Taam, 2010, 2012; Liu et al., 2012). The kinetic energy retrieved Eerg would need a conversion efficiency from 500% to 2000% in the case of thermonuclear origin. On the other hand, such a kinetic energy would be reasonable for energetic core-collapse events (e.g. a broad line type Ic 10%-20%) and would need a conversion efficiency of 50%–70% for normal type Ibc. However, we caution that the model used has several free parameters, and is a simplified approximation which ignores potentially important effects such as deviations from spherical symmetry, or a clumpy CSM. In the absence of more sophisticated modelling, the ranges of masses (see Table 2) seem more plausibly associated with a core-collapse origin for SN 2012ca.
| Object | t0 | Mej | MCSM | MNi | R | Ek | |
|---|---|---|---|---|---|---|---|
| (days) | (M⊙) | (M⊙) | (M⊙) | ( cm) | ( erg) | ||
| SN 2012ca(with Ni) | 40.36 | 0.93 | 2.37 | 0.52 | 5.09 | 6.82 | 1.95 |
| SN 2012ca(without Ni) | 34.57 | 1.25 | 2.63 | 0.00 | 6.48 | 8.93 | 1.48 |
| SN 1997cy | - | 2.30 | 0.42 | 0.85 | 6.57 | 0.64 | 21.17 |
| SN 1999E | - | 1.64 | 2.93 | 0.90 | 4.56 | 0.06 | 8.06 |
| SN 2002ic | - | 0.60 | 4.35 | 0.00 | 6.14 | 1.01 | 4.05 |
| SN 2005gj (with Ni) | 19.16 | 0.82 | 1.70 | 1.06 | 5.53 | 0.93 | 2.64 |
| SN 2005gj (without Ni) | 18.37 | 0.40 | 3.80 | 0.00 | 1.10 | 1.54 | 13.74 |
| PTF11kx | - | 1.34 | 0.07 | 0.00 | 9.10 | 0.67 | 0.48 |
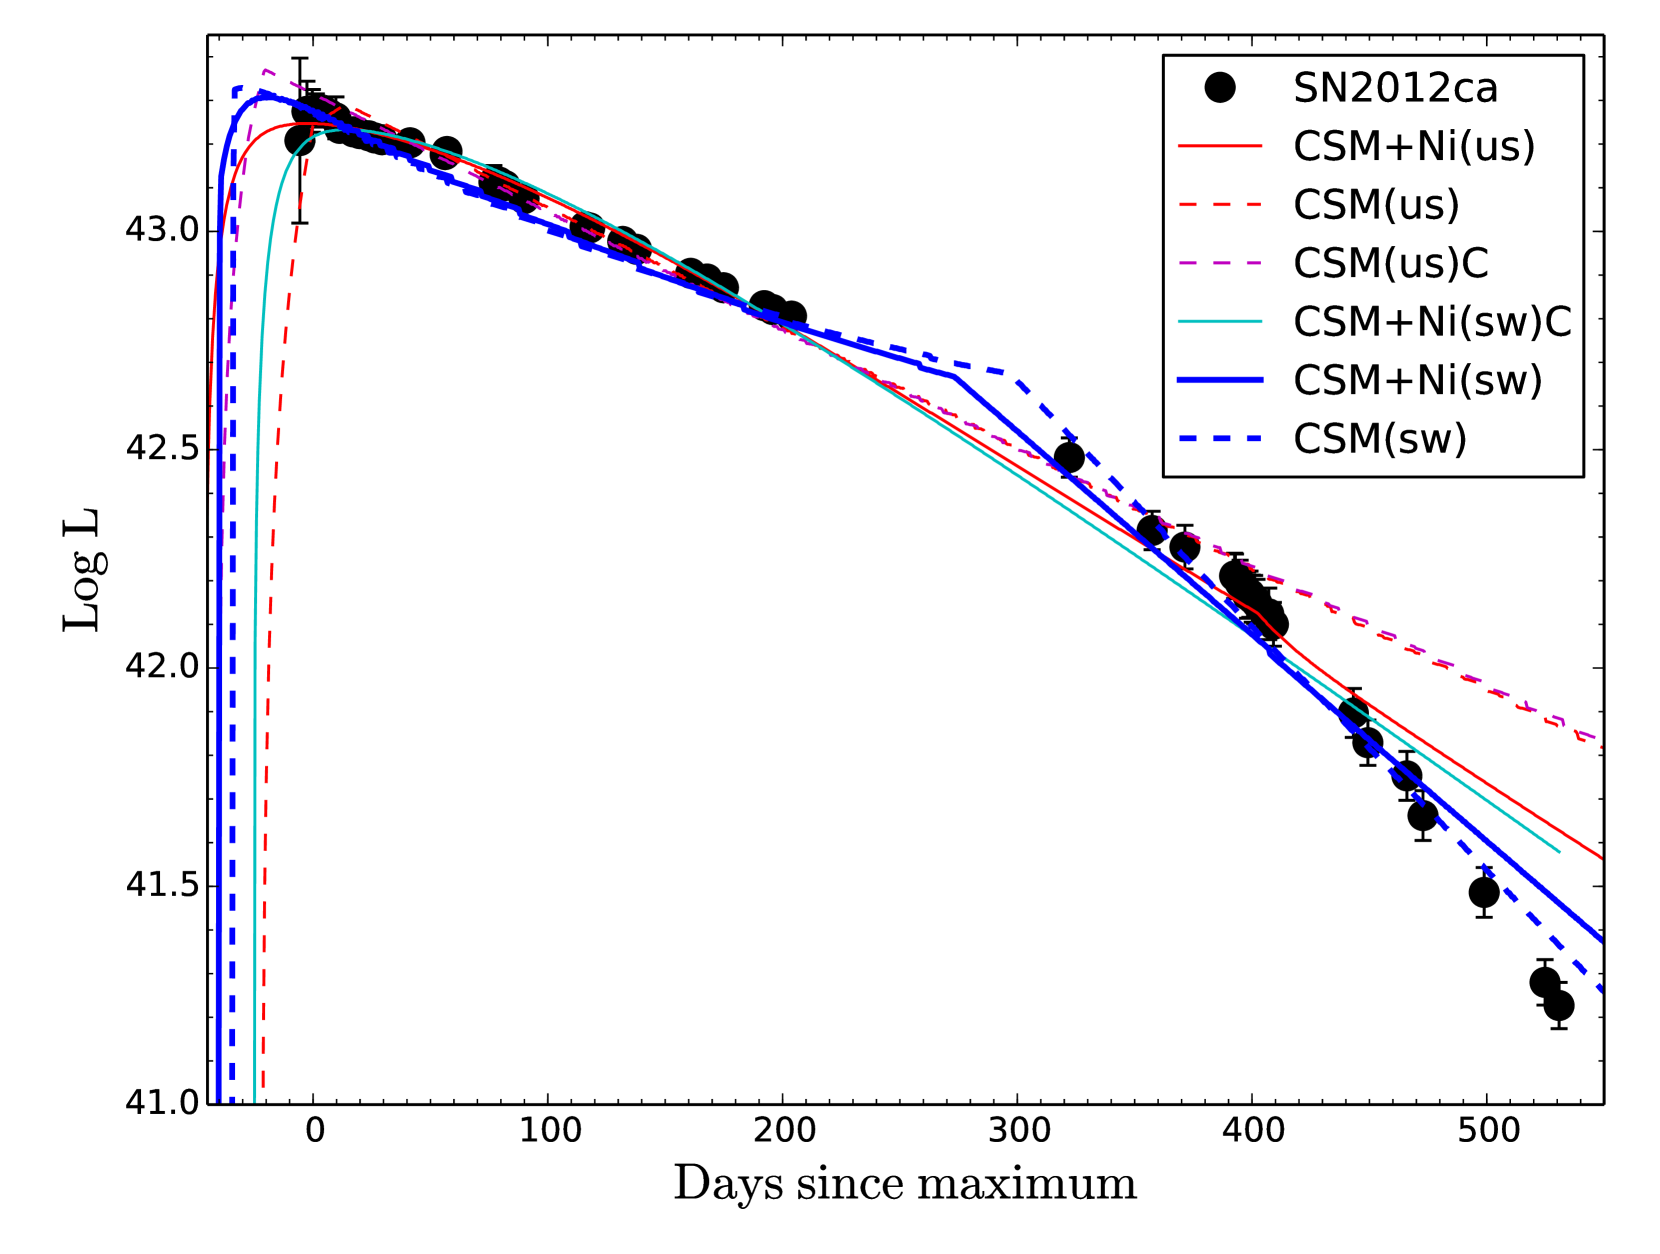
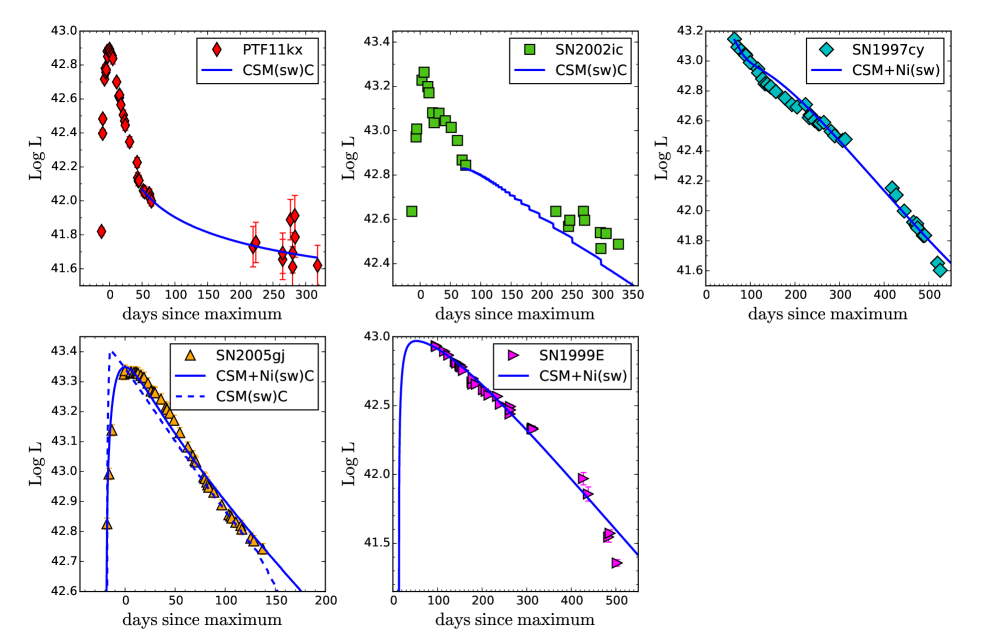
While SN 2012ca is the only type IIn/Ia-CSM with a full UVOIR bolometric light-curve, we repeated the previous analysis on the sample of similar SNe with pseudo-bolometric light-curves from Sect. 4. As a consequence the parameters retrieved have to be considered as limits, especially for the kinetic energy. The best fit and related parameters are shown in Figure 14 and reported in Table 2.
We note that both the ejecta and CSM mass for PTF11kx appear consistent with a thermonuclear scenario, which is encouraging. Conversely, we were unable to fit the section of the light-curve for SN 2002ic which is affected by interaction with a combination of masses appropriate for a thermonuclear explosion, even assuming that the companion is a massive SAGB star. Both PTF11kx and SN 2002ic showed pre-interaction spectra which resembled a bright Type Ia SN, but only the former also showed the classical double peak in the NIR light curve like normal type Ia, casting some doubts to the nature of the latter.
In contrast, the values retrieved for SN 1997cy suggests an ejecta mass too massive for a thermonuclear explosion. The SN 2012ca pseudo-bolometric light-curve is roughly a factor two dimmer than the bolometric. We can assume that all pseudo-bolometric light curves similar to that of SN 2012ca in luminosity and time coverage are also a factor two dimmer than the bolometric and hence the kinetic energy retrieved by the model has to be multiplied by at least a factor two. This would suggest a core-collapse explosion for at least SN 1997cy and SN 1999E. The high values of for these two objects are due to the absence of constraints for the first 70 days of evolution, also leading to lower values of masses and a ratio Mej/MNi too high for stripped envelope SNe, too. Indeed, this is a consequence of the limits of a simple code such as the aforementioned one.
The best fit for SN 2005gj is clearly unphysical since it requires a higher 56Ni mass than the ejecta mass. However, since the late time temporal coverage is lower than SN 2012ca, the degeneracy is higher than the other cases. For example, an alternative model (blue dashed line in Figure 14) with M M⊙ and M M⊙ well describe the light-curve behaviour. This CSM mass is inconsistent with that stripped by the WD from its companion but still in the range of an AGB stars.
From the above analysis the only possible scenarios that can explain SN 2012ca and similar type IIn/Ia-CSM objects are either a core collapse, or a thermonuclear explosion from a binary system which has a relatively massive CSM (such as from a WD + AGB star system). The latter has been already suggested by Hamuy et al. (2003) to explain the mass of the CSM in SN 2002ic. A wind Roche-lobe overflow (RLOF) of km s-1 (Podsiadlowski & Mohamed, 2007; Mohamed et al., 2014) - that happens when the companion fills its Roche lobe - can explain the process needed to account for a higher mass loss than what happens in normal WD + RG systems. A similar velocity was only observed in the unshocked CSM of PTF11kx (Dilday et al., 2012), while for SN 2012ca and SN 1999E the velocities were a factor 3 or 4 higher. Furthermore, the RLOF can push the mass-loss up to a solar mass and hence lower than what was retrieved. An alternative suggestion could be that of a merger of a WD companion with the hot core of a massive AGB star leading to a SN Ia explosion that occurs at the end of the common envelope phase or shortly after (Soker et al., 2013). However, this scenario would not explain the relatively high velocity of the unshocked wind observed in SNe 2012ca and 1999E.
7 Conclusion
We have presented extensive photometric and spectroscopic observations of the lowest redshift type IIn/Ia-CSM SN 2012ca. The light-curve for SN 2012ca covers the period of almost 600 days, likely including the peak epoch and comprises the first set of UV data obtained for a transient exhibiting such spectrophotometric behaviour.
The light-curve evolution of SN 2012ca is similar to that of SNe 1997cy and 1999E after 100 days from maximum light, while the peak luminosity is fainter than that of SN 2002ic but brighter than PTF11kx. The spectroscopic coverage from prior to what has been identified as possible maximum light shows a persistent interaction with a CSM that lasts until 500 days. From the highest resolution spectra we also measured the velocity of the narrow absorption component associated with H, and find it to be km s-1. This is comparable to what found for SN 1999E by Rigon et al. (2003) and a factor 3-4 higher than what was found for PTF11kx ( km s-1 Dilday et al., 2012).
From our spectroscopic analysis it is apparent that the spectra of SN 2012ca are dominated exclusively by H, He, Fe and Ca, with some small contributions possible from O and Mg. That is also true for other type IIn/Ia-CSM. Moreover, the luminosity of SN 2012ca at 1 year from peak, as well as those of SNe 1997cy, 1999E, 2002ic and 2005gj is more than 100 times brighter than that observed for a bright type Ia SN. Hence, only the CSM is responsible for the line profiles observed in SN 2012ca from 1 year onward, as an underlying Type Ia SN would be simply too faint to be seen or contribute. We note that even if the peak epoch could not be well constrained, the peak would only have reached before our best estimate and that would strengthen an analysis based on the light curve. Since we have shown that there is no spectral evolution in SN 2012ca from the first epoch until the last, it appears reasonable that spectroscopic properties of SN 2012ca, as well as SNe 1997cy and 1999E are determined solely by the physical conditions within the CSM and the ejecta.
We also find that the UV contribution to the total bolometric flux is low (%), which may indicate a flat ejecta density profile more similar to that of a H-free core-collapse SN. Furthermore, the total luminosity obtained by integrating over the entire light-curve of SN 2012ca implies a conversion efficiency of kinetic energy to luminosity of between 20 and 70 per cent in the case of a thermonuclear explosion (500% to 2000% in the case of the kinetic energy retrieved by the model), and 3 to 45 per cent in the case of a core-collapse (10% to 20% in the case of the kinetic energy retrieved by the model for a broad line type Ic), with the broad line CCSNe requiring the lowest conversion efficiency. We note that if the maximum of the lightcurve was even earlier than the date we adopted, these conversion efficiencies would need to be even higher.
We applied a semi-analytical code in order to estimate the ejecta and CSM masses, and the kinetic energy required to power the light-curves of SN 2012ca and similar SNe. For SN 2012ca we required even higher kinetic energies which would rule out the thermonuclear scenario, together with (M⊙) and (M⊙). We retrieved similar values for the other five type IIn/Ia-CSM SNe with derived masses (M⊙) and (M⊙). PTF11kx was the only object for which the modelling returned an ejecta mass and other parameters which were consistent with a thermonuclear explosion of a WD.
In the absence of an early period where the SN spectrum is not dominated by interaction (as for PTF11kx or SN 2002ic), it is difficult to unambiguously determine the true nature of a type IIn/Ia-CSM event. Even in the cases where such spectra are available, care must be taken in classifying the spectrum, as shown in the case of SN 2004aw, a type Ic SN which resembled a type Ia and hence was initially misclassified as the latter (Taubenberger et al., 2006).
Overall, the energy budget required for SN 2012ca and the necessary high conversion efficiency of the SN kinetic energy to luminosity provides the strongest evidence for it being a core-collapse SN. Secondary evidence for a core-collapse comes from the velocity of the narrow absorption component of H, and the ejecta and CSM masses retrieved from semi-analytic modelling.
As shown in this work, energetic arguments can provide information on the nature of some of these events, given simple constraints such as that the luminosity from interaction must be less than the kinetic energy of the underlying SN. The existence of ostensibly similar (at least spectroscopically) objects such as PTF11kx, which has been unambiguously shown to be a type Ia SN, and SN 2012ca, for which a core-collapse is favoured based on the mass and energy budget, may point towards the existence of two physical channels for these transients which lead to observationally similar SNe. Such a result is also hinted at by the very different lightcurves exemplified by PTF11kx and SN 2012ca.
Acknowledgments
CI thanks Stuart Sim, Bruno Leinbundgut, Maria Letizia Pumo and Andrea Pastorello for helpful discussions. CI and MF thanks Anders Jerkstrand for helpful comments. CI also thanks Melissa Graham for the LCOGT data acquisition. This work is based on observations collected at the European Organisation for Astronomical Research in the Southern Hemisphere, Chile as part of PESSTO, (the Public ESO Spectroscopic Survey for Transient Objects Survey) ESO program 188.D-3003, 191.D-0935. It is also based on observations taken at the Panchromatic Robotic Optical Monitoring and Polarimetry Telescope (PROMPT) through the CNTAC proposal CN2012A-103; the Australian National University 2.3m Telescope and the Swift satellite. This work makes use of observations from the LCOGT network. Funded by the European Research Council under the European Union’s Seventh Framework Programme (FP7/2007-2013)/ERC Grant agreement no [291222] (SJS). This work was partly supported by the European Union FP7 programme through ERC grant number 320360. SB and AP acknowledge the PRIN-INAF 2011 project “Transient Universe: from ESO Large to PESSTO". Support for G.P. is provided by the Ministry of Economy, Development, and Tourism’s Millennium Science Initiative through grant IC120009, awarded to The Millennium Institute of Astrophysics, MAS. This research has made use of the NASA/IPAC Extragalactic Database (NED) which is operated by the Jet Propulsion Laboratory, California Institute of Technology, under contract with the National Aeronautics and Space Administration.
References
- Aldering et al. (2006) Aldering G., et al., 2006, ApJ, 650, 510
- Arnett & Fu (1989) Arnett W. D., Fu A., 1989, ApJ, 340, 396
- Benetti et al. (2006) Benetti S., Cappellaro E., Turatto M., Taubenberger S., Harutyunyan A., Valenti S., 2006, ApJ, 653, L129
- Brown (2013) Brown T., 2013, POBeo, 92, 91
- Chandra et al. (2015) Chandra P., Chevalier R. A., Chugai N., Fransson C., Soderberg A. M., 2015, ApJ, 810, 32
- Chatzopoulos, Wheeler, & Vinko (2012) Chatzopoulos E., Wheeler J. C., Vinko J., 2012, ApJ, 746, 121
- Chevalier & Fransson (1994) Chevalier R. A., Fransson C., 1994, ApJ, 420, 268
- Chevalier & Irwin (2011) Chevalier R. A., Irwin C. M., 2011, ApJ, 729, L6
- Childress et al. (2015) Childress M. J., et al., 2015, arXiv, arXiv:1507.02501
- Childress et al. (2014) Childress, M. J., Vogt, F. P. A., Nielsen, J., & Sharp, R. G. 2014, Ap&SS,, 349, 617
- Deng et al. (2004) Deng J., et al., 2004, ApJ, 605, L37
- Dilday et al. (2012) Dilday B., et al., 2012, Sci, 337, 942
- Dopita et al. (2010) Dopita M., et al., 2010, Ap&SS, 327, 245
- Drescher, Parker, & Brimacombe (2012) Drescher C., Parker S., Brimacombe J., 2012, CBET,3101,1
- Dwarkadas & Gruszko (2012) Dwarkadas, V. V., Gruszko, J. 2012, MNRAS, 419, 1515
- Filippenko (1997) Filippenko A. V., 1997, ARA&A, 35, 309
- Foreman-Mackey et al. (2013) Foreman-Mackey D., Hogg D. W., Lang D., Goodman J., 2013, PASP, 125, 306
- Fox et al. (2015) Fox O. D., et al., 2015, MNRAS, 447, 772
- Fox & Filippenko (2013) Fox O. D., Filippenko A. V., 2013, ApJ, 772, L6
- Fransson et al. (2014) Fransson C., et al. 2014, ApJ, 797, 118
- Fraser et al. (2013) Fraser M. et al. 2013, MNRAS, 433, 1312
- Fraser et al. (2015) Fraser M., et al., 2015, MNRAS, 453, 3886
- Germany et al. (2000) Germany L. M., Reiss D. J., Sadler E. M., Schmidt B. P., Stubbs C. W., 2000, ApJ, 533, 320
- Hamuy et al. (2003) Hamuy M., et al., 2003, Natur, 424, 651
- Hillebrandt & Niemeyer (2000) Hillebrandt W., Niemeyer J. C., 2000, ARA&A, 38, 191
- Hunter et al. (2009) Hunter D. J., et al., 2009, A&A, 508, 371
- Inserra et al. (2015) Inserra C., et al., 2016, ApJ, in prep.
- Inserra et al. (2014) Inserra C., et al., 2014, MNRAS, 437, L51
- Inserra et al. (2012) Inserra C., et al., 2012, CBET, 3101, 1
- Iwamoto et al. (1998) Iwamoto K., et al., 1998, Natur, 395, 672
- Janka (2012) Janka, H.-T. 2012, Annu. Rev. Nucl. Part. Sci., 62, 407
- Jerkstrand et al. (2012) Jerkstrand A., Fransson C., Maguire K., Smartt S., Ergon M., Spyromilio J., 2012, A&A, 546, A28
- Kennicutt, Tamblyn, & Congdon (1994) Kennicutt R. C., Jr., Tamblyn P., Congdon C. E., 1994, ApJ, 435, 22
- Kotak et al. (2004) Kotak R., Meikle W. P. S., Adamson A., Leggett S. K., 2004, MNRAS, 354, L13
- Landolt (1992) Landolt A. U., 1992, AJ, 104, 340
- Leloudas et al. (2015) Leloudas G., et al., 2015, A&A, 574, A61
- Lira et al. (1998) Lira P., et al., 1998, AJ, 115, 234
- Liu et al. (2012) Liu Z. W., Pakmor R., Röpke F. K., Edelmann P., Wang B., Kromer M., Hillebrandt W., Han Z. W., 2012, A&A, 548, A2
- Madau, Pozzetti, & Dickinson (1998) Madau P., Pozzetti L., Dickinson M., 1998, ApJ, 498, 106
- Mazzali et al. (2007) Mazzali P. A., Röpke F. K., Benetti S., Hillebrandt W., 2007, Sci, 315, 825
- Matzner & McKee (1999) Matzner C. D., McKee C. F., 1999, ApJ, 510, 379
- Meynet et al. (2015) Meynet G., et al., 2015, A&A, 575, A60
- Mohamed et al. (2014) Mohamed S., et al., 2014, apn6.conf, 60
- Ofek et al. (2014) Ofek E. O., et al., 2014, ApJ, 781, 42
- Nomoto, Thielemann, & Yokoi (1984) Nomoto K., Thielemann F.-K., Yokoi K., 1984, ApJ, 286, 644
- Nicholl et al. (2014) Nicholl M., et al., 2014, MNRAS, 444, 2096
- Pan, Ricker, & Taam (2010) Pan K.-C., Ricker P. M., Taam R. E., 2010, ApJ, 715, 78
- Pan, Ricker, & Taam (2012) Pan K.-C., Ricker P. M., Taam R. E., 2012, ApJ, 750, 151
- Patat et al. (2011) Patat F., Chugai N. N., Podsiadlowski P., Mason E., Melo C., Pasquini L., 2011, A&A, 530, A63
- Podsiadlowski & Mohamed (2007) Podsiadlowski P., Mohamed S., 2007, BaltA, 16, 26
- Poole et al. (2008) Poole T. S., et al., 2008, MNRAS, 383, 627
- Pignata et al. (2004) Pignata G., et al., 2004, MNRAS, 355, 178
- Prieto et al. (2007) Prieto J. L., et al., 2007, arXiv, arXiv:0706.4088
- Pumo et al. (2009) Pumo M. L., et al., 2009, ApJ, 705, L138
- Reichart et al. (2005) Reichart D., et al., 2005, NCimC, 28, 767
- Rigon et al. (2003) Rigon L., et al., 2003, MNRAS, 340, 191
- Röpke et al. (2007) Röpke F. K., Hillebrandt W., Schmidt W., Niemeyer J. C., Blinnikov S. I., Mazzali P. A., 2007, ApJ, 668, 1132
- Scalzo et al. (2014) Scalzo R., et al., 2014, MNRAS, 440, 1498
- Schlafly & Finkbeiner (2011) Schlafly E. F., Finkbeiner D. P., 2011, ApJ, 737, 103
- Schlegel (1990) Schlegel E. M., 1990, MNRAS, 244, 269
- Silverman et al. (2013a) Silverman J. M., et al., 2013a, ApJS, 207, 3
- Silverman et al. (2013b) Silverman J. M., et al., 2013b, ApJ, 772, 125
- Sim et al. (2012) Sim S. A., Fink M., Kromer M., Röpke F. K., Ruiter A. J., Hillebrandt W., 2012, MNRAS, 420, 3003
- Skrutskie et al. (2006) Skrutskie M. F., et al., 2006, AJ, 131, 1163
- Smartt et al. (2015) Smartt S. J., et al., 2015, A&A, 579, A40
- Smith et al. (2009) Smith N., et al., 2009, ApJ, 695, 1334
- Soker et al. (2013) Soker N., Kashi A., García-Berro E., Torres S., Camacho J., 2013, MNRAS, 431, 1541
- Sternberg et al. (2011) Sternberg A., et al., 2011, Sci, 333, 856
- Stritzinger et al. (2002) Stritzinger M., et al., 2002, AJ, 124, 2100
- Svirski, Nakar, & Sari (2012) Svirski G., Nakar E., Sari R., 2012, ApJ, 759, 108
- Taddia et al. (2012) Taddia F., et al., 2012, A&A, 545, L7
- Taubenberger et al. (2006) Taubenberger S., et al., 2006, MNRAS, 371, 1459
- Taubenberger et al. (2011) Taubenberger S., et al., 2011, MNRAS, 412, 2735
- Trundle et al. (2008) Trundle C., Kotak R., Vink J. S., Meikle W. P. S., 2008, A&A, 483, L47
- Turatto et al. (2000) Turatto M., et al., 2000, ApJ, 534, L57
- Umeda & Nomoto (2008) Umeda H., Nomoto K., 2008, ApJ, 673, 1014
- Valenti et al. (2012) Valenti S., et al., 2012, ATel, 4076, 1
- Wang et al. (2004) Wang L., Baade D., Höflich P., Wheeler J. C., Kawabata K., Nomoto K., 2004, ApJ, 604, L53
- Wood-Vasey, Wang, & Aldering (2004) Wood-Vasey W. M., Wang L., Aldering G., 2004, ApJ, 616, 339
- Yaron & Gal-Yam (2012) Yaron O., Gal-Yam A., 2012, PASP, 124, 668
- Zhang et al. (2012) Zhang T., et al., 2012, AJ, 144, 131
Appendix A Tables
| Date | MJD | Phase* | U | B | V | R | I | Inst. |
|---|---|---|---|---|---|---|---|---|
| yy/mm/dd | (days) | |||||||
| 12/04/25 | 56042.58 | -5.6 | 14.94 (0.03) | BOSS | ||||
| 12/04/28 | 56045.58 | -2.6 | 14.78 (0.02) | BOSS | ||||
| 12/04/30 | 56047.88 | -0.3 | 16.31 (0.08) | 16.15 (0.07) | 15.46 (0.05) | SWIFT | ||
| 12/05/02 | 56049.57 | 1.4 | 14.77 (0.01) | BOSS | ||||
| 12/05/03 | 56050.06 | 1.9 | 16.31 (0.13) | SWIFT | ||||
| 12/05/04 | 56051.93 | 3.7 | 16.32 (0.09) | 16.15 (0.07) | 15.42 (0.06) | SWIFT | ||
| 12/05/05 | 56052.22 | 4.0 | 16.15 (0.06) | 15.43 (0.03) | 14.82 (0.06) | 14.64 (0.08) | PROMPT | |
| 12/05/06 | 56053.60 | 5.4 | 16.33 (0.09) | 16.16 (0.07) | 15.43 (0.06) | SWIFT | ||
| 12/05/08 | 56055.12 | 6.9 | 16.35 (0.08) | 16.17 (0.07) | 15.44 (0.06) | SWIFT | ||
| 12/05/08 | 56055.22 | 7.0 | 16.17 (0.04) | 15.46 (0.04) | 14.84 (0.05) | 14.68 (0.08) | PROMPT | |
| 12/05/10 | 56057.48 | 9.3 | 16.36 (0.08) | 16.16 (0.07) | 15.46 (0.06) | SWIFT | ||
| 12/05/10 | 56057.91 | 9.7 | 14.88 (0.03) | BOSS | ||||
| 12/05/12 | 56059.49 | 11.3 | 16.36 (0.08) | 16.17 (0.07) | 15.47 (0.06) | SWIFT | ||
| 12/05/18 | 56065.29 | 17.1 | 16.37 (0.08) | 16.18 (0.07) | 15.48 (0.07) | SWIFT | ||
| 12/05/21 | 56068.03 | 19.8 | 16.39 (0.08) | 16.18 (0.07) | 15.47 (0.06) | SWIFT | ||
| 12/05/24 | 56071.93 | 23.7 | 16.40 (0.08) | 16.19 (0.07) | 15.48 (0.06) | SWIFT | ||
| 12/05/27 | 56074.49 | 26.3 | 16.42 (0.10) | 16.19 (0.08) | 15.48 (0.08) | SWIFT | ||
| 12/05/30 | 56077.52 | 29.3 | 16.44 (0.08) | 16.20 (0.07) | 15.49 (0.06) | SWIFT | ||
| 12/06/11 | 56089.49 | 41.3 | 15.02 (0.04) | BOSS | ||||
| 12/06/26 | 56104.45 | 56.2 | 15.08 (0.05) | BOSS | ||||
| 12/06/27 | 56105.24 | 57.0 | 16.33 (0.08) | 15.58 (0.09) | 15.02 (0.10) | 14.88 (0.13) | PROMPT | |
| 12/07/17 | 56125.23 | 77.0 | 16.46 (0.10) | 15.65 (0.15) | 15.28 (0.17) | 14.98 (0.17) | PROMPT | |
| 12/07/19 | 56127.41 | 79.2 | 15.25 (0.05) | BOSS | ||||
| 12/07/21 | 56129.98 | 81.8 | 15.67 (0.15) | 15.29 (0.12) | 14.91 (0.13) | PROMPT | ||
| 12/07/30 | 56138.07 | 89.9 | 16.55 (0.08) | 15.69 (0.09) | 15.32 (0.09) | 15.04 (0.09) | PROMPT | |
| 12/08/24 | 56164.06 | 115.8 | 16.82 (0.04) | 15.50 (0.02) | NTT | |||
| 12/08/26 | 56166.05 | 117.8 | 16.84 (0.03) | NTT | ||||
| 12/09/09 | 56180.11 | 131.9 | 16.90 (0.10) | 15.61 (0.05) | NTT | |||
| 12/09/15 | 56186.01 | 137.8 | 16.92 (0.04) | 15.66 (0.03) | NTT | |||
| 12/10/08 | 56209.05 | 160.8 | 17.01 (0.16) | 15.77 (0.16) | NTT | |||
| 12/10/15 | 56216.03 | 167.8 | 17.02 (0.06) | 15.80 (0.03) | NTT | |||
| 12/10/22 | 56223.02 | 174.8 | 17.05 (0.06) | 15.86 (0.05) | NTT | |||
| 12/11/06 | 56238.04 | 189.8 | 17.13 (0.07) | NTT | ||||
| 12/11/09 | 56240.40 | 192.2 | 15.93 (0.07) | BOSS | ||||
| 12/11/11 | 56244.02 | 195.8 | 17.21 (0.09) | 15.96 (0.05) | NTT | |||
| 12/11/20 | 56252.01 | 203.8 | 17.25 (0.08) | 16.00 (0.05) | NTT | |||
| 13/03/18 | 56370.37 | 322.2 | 17.04 (0.04) | NTT | ||||
| 13/04/18 | 56401.35 | 353.1 | 17.30 (0.05) | NTT | ||||
| 13/04/23 | 56405.64 | 357.4 | 17.34 (0.07) | BOSS | ||||
| 13/05/07 | 56419.61 | 371.4 | 17.44 (0.06) | BOSS | ||||
| 13/05/28 | 56440.77 | 392.6 | 17.80 (0.12) | 17.56 (0.10) | 17.63 (0.11) | 17.79 (0.12) | FTS | |
| 13/05/28 | 56441.12 | 392.9 | 17.55 (0.04) | 17.63 (0.03) | 17.76 (0.04) | LCOGT | ||
| 13/05/30 | 56443.12 | 394.9 | 17.63 (0.06) | 17.66 (0.06) | LCOGT | |||
| 13/06/02 | 56446.30 | 398.1 | 17.70 (0.05) | 17.74 (0.07) | 17.86 (0.13) | LCOGT | ||
| 13/06/03 | 56447.31 | 399.1 | 17.72 (0.04) | 17.72 (0.04) | 17.87 (0.04) | LCOGT | ||
| 13/06/04 | 56448.31 | 400.1 | 17.74 (0.04) | 17.75 (0.10) | 17.88 (0.12) | LCOGT | ||
| 13/06/05 | 56449.30 | 401.1 | 17.75 (0.08) | 17.76 (0.12) | LCOGT | |||
| 13/06/06 | 56450.31 | 402.1 | 17.76 (0.09) | 17.78 (0.15) | 17.85 (0.13) | LCOGT | ||
| 13/06/11 | 56455.31 | 407.1 | 17.79 (0.10) | 17.85 (0.15) | 17.94 (0.15) | LCOGT | ||
| 13/06/13 | 56457.31 | 409.1 | 17.83 (0.09) | 18.03 (0.13) | LCOGT | |||
| 13/07/18 | 56491.36 | 443.2 | 18.51 (0.17) | 18.37 (0.16) | 18.43 (0.20) | FTS | ||
| 13/07/24 | 56497.56 | 449.4 | 18.57 (0.12) | 18.60 (0.05) | 18.62 (0.06) | FTS | ||
| 13/08/09 | 56514.18 | 466.0 | 18.82 (0.20) | SMARTS | ||||
| 13/08/12 | 56517.18 | 469.0 | 18.86 (0.28) | SMARTS | ||||
| 13/08/16 | 56521.04 | 472.8 | 19.31 (0.06) | NTT | ||||
| 13/09/11 | 56547.11 | 498.9 | 19.79 (0.08) | NTT | ||||
| 13/10/07 | 56573.02 | 524.8 | 21.75 (0.11) | 20.75 (0.12) | 20.79 (0.14) | NTT | ||
| 13/10/13 | 56579.01 | 530.8 | 21.27 (0.24) | NTT | ||||
| 13/11/11 | 56608.05 | 559.8 | 21.50 | 21.30 | NTT |
* Phase with respect to the R-band maximum.
| Date | MJD | Phase* | g | r | i | z | Inst. |
|---|---|---|---|---|---|---|---|
| yy/mm/dd | (days) | ||||||
| 12/04/28 | 56046.40 | -1.8 | 15.17 (0.02) | NTT | |||
| 12/05/05 | 56052.22 | 4.0 | 14.83 (0.03) | 14.78 (0.07) | 14.40 (0.07) | 14.37 (0.09) | PROMPT |
| 12/05/08 | 56055.22 | 7.0 | 14.88 (0.03) | 14.79 (0.08) | 14.46 (0.07) | 14.39 (0.09) | PROMPT |
| 12/06/27 | 56105.24 | 57.0 | 14.99 (0.09) | 14.50 (0.11) | 14.64 (0.13) | PROMPT | |
| 12/07/07 | 56115.11 | 66.9 | 15.10 (0.16) | 14.62 (0.14) | 14.74 (0.15) | PROMPT | |
| 12/07/17 | 56125.23 | 77.0 | 15.51 (0.20) | 15.13 (0.17) | 14.71 (0.20) | PROMPT | |
| 12/07/24 | 56132.26 | 84.1 | 15.16 (0.06) | 14.71 (0.07) | 14.85 (0.07) | PROMPT | |
| 12/07/31 | 56139.22 | 91.0 | 15.28 (0.08) | 14.84 (0.10) | 15.02 (0.06) | PROMPT | |
| 12/08/08 | 56148.09 | 99.9 | 15.76 (0.03) | 15.31 (0.03) | 14.85 (0.03) | 15.05 (0.03) | NTT |
| 12/08/18 | 56157.22 | 109.0 | 15.82 (0.07) | 15.35 (0.06) | 14.93 (0.10) | 15.10 (0.09) | NTT |
| 12/08/21 | 56160.17 | 112.0 | 15.84 (0.05) | 15.36 (0.05) | 14.93 (0.07) | 15.13 (0.10) | PROMPT |
| 12/08/24 | 56164.06 | 115.8 | 15.88 (0.04) | 15.36 (0.03) | 14.95 (0.03) | 15.14 (0.04) | NTT |
| 12/08/26 | 56166.05 | 117.8 | 15.89 (0.04) | 15.34 (0.06) | 14.94 (0.04) | 15.15 (0.09) | NTT |
| 12/09/09 | 56180.11 | 131.9 | 15.95 (0.04) | 15.43 (0.05) | 15.02 (0.05) | 15.20 (0.04) | NTT |
| 12/09/15 | 56186.01 | 137.8 | 15.99 (0.03) | 15.48 (0.04) | 15.12 (0.03) | 15.26 (0.03) | NTT |
| 12/10/08 | 56209.05 | 160.8 | 16.05 (0.05) | 15.57 (0.07) | 15.29 (0.04) | 15.47 (0.08) | NTT |
| 12/10/15 | 56216.03 | 167.8 | 16.06 (0.04) | 15.63 (0.04) | 15.30 (0.02) | 15.49 (0.03) | NTT |
| 12/10/22 | 56223.02 | 174.8 | 16.12 (0.03) | 15.67 (0.04) | 15.40 (0.03) | 15.51 (0.02) | NTT |
| 12/11/06 | 56238.04 | 189.8 | 16.16 (0.03) | 15.76 (0.05) | 15.48 (0.02) | 15.64 (0.02) | NTT |
| 12/11/11 | 56244.02 | 195.8 | 16.17 (0.03) | 15.80 (0.04) | 15.52 (0.02) | 15.66 (0.02) | NTT |
| 12/11/20 | 56252.01 | 203.8 | 16.20 (0.04) | 15.82 (0.04) | 15.52 (0.02) | 15.72 (0.03) | NTT |
| 13/03/10 | 56361.67 | 313.5 | 16.98 (0.10) | 16.52 (0.09) | 16.11 (0.11) | 16.15 (0.08) | NTT |
| 13/03/11 | 56362.67 | 314.5 | 16.96 (0.11) | 16.54 (0.11) | 16.18 (0.12) | 16.18 (0.09) | NTT |
| 13/03/31 | 56382.63 | 334.4 | 17.39 (0.12) | 16.81 (0.13) | 16.90 (0.14) | 16.50 (0.13) | NTT |
| 13/10/07 | 56573.02 | 524.8 | 20.90 (0.07) | 20.82 (0.10) | 20.54 (0.12) | 20.83 (0.10) | NTT |
| 13/11/11 | 56608.05 | 559.8 | 21.30 | 21.10 | 21.20 | NTT |
* Phase with respect to the R-band maximum.
| Date | MJD | Phase* | uvw2 | uvm2 | uvw1 |
|---|---|---|---|---|---|
| yy/mm/dd | (days) | ||||
| 12/04/30 | 56047.88 | -0.3 | 17.85 (0.12) | 17.49 (0.11) | 16.94 (0.10) |
| 12/05/03 | 56050.06 | 1.9 | 16.79 (0.10) | ||
| 12/05/04 | 56051.93 | 3.7 | 17.99 (0.12) | 17.87 (0.11) | 16.83 (0.10) |
| 12/05/06 | 56053.60 | 5.4 | 17.96 (0.12) | 17.62 (0.11) | 16.92 (0.10) |
| 12/05/08 | 56055.12 | 6.9 | 17.99 (0.12) | 17.49 (0.10) | 16.94 (0.10) |
| 12/05/10 | 56057.48 | 9.3 | 17.89 (0.12) | 17.61 (0.11) | 16.86 (0.10) |
| 12/05/12 | 56059.49 | 11.3 | 18.08 (0.12) | 17.80 (0.11) | 16.91( 0.10) |
| 12/05/18 | 56065.29 | 17.1 | 17.85 (0.12) | 17.78 (0.12) | 16.90 (0.09) |
| 12/05/21 | 56068.03 | 19.8 | 17.92 (0.12) | 17.66 (0.11) | 16.97 (0.09) |
| 12/05/24 | 56071.93 | 23.7 | 17.82 (0.12) | 17.62 (0.10) | 16.95 (0.10) |
| 12/05/27 | 56074.49 | 26.3 | 17.86 (0.15) | 17.65 (0.13) | 17.06 (0.12) |
| 12/05/30 | 56077.52 | 29.3 | 17.85 (0.12) | 17.70 (0.13) | 16.94 (0.09) |
* Phase with respect to the R-band maximum.
| Date | MJD | Phase* | J | H | K |
|---|---|---|---|---|---|
| yy/mm/dd | (days) | ||||
| 12/08/09 | 56149.20 | 101.0 | 14.96 (0.04) | 14.69 (0.04) | 14.77 (0.04) |
| 12/09/15 | 56186.03 | 137.8 | 15.11 (0.04) | 15.01 (0.08) | 14.89 (0.10) |
| 12/11/14 | 56246.01 | 197.8 | 15.58 (0.04) | 15.57 (0.04) | 15.45 (0.04) |
| 13/03/05 | 56357.37 | 309.2 | 16.37 (0.05) | 16.14 (0.07) | 15.61 (0.04) |
| 13/04/11 | 56394.28 | 346.1 | 16.70 (0.08) | 16.21 (0.11) | 15.43 (0.07) |
| 13/10/14 | 56580.02 | 531.8 | 19.25 (0.19) | 17.08 (0.09) | 15.30 (0.07) |
| 13/11/02 | 56598.99 | 550.8 | 19.37 (0.34) | 17.26 (0.07) | 15.38 (0.10) |
* Phase with respect to the R-band maximum.
| Star | U | B | V | R | I |
|---|---|---|---|---|---|
| 1 | 16.10 (0.01) | 15.59 (0.01) | 15.50 (0.03) | 15.12 (0.02) | 15.54 (0.02) |
| 2 | 18.01 (0.03) | 17.31 (0.02) | 17.07 (0.05) | 16.60 (0.02) | 17.01 (0.03) |
| 3 | 18.30 (0.01) | 17.70 (0.01) | 17.48 (0.02) | 17.10 (0.01) | 17.13 (0.02) |
| 4 | 16.63 (0.01) | 16.33 (0.01) | 16.20 (0.02) | 15.89 (0.01) | 15.92 (0.03) |
| 5 | 19.31 (0.03) | 18.32 (0.02) | 17.87 (0.01) | 17.31 (0.02) | 17.19 (0.02) |
| 6 | 15.72 (0.01) | 14.84 (0.01) | 14.45 (0.03) | 14.02 (0.01) | 14.00 (0.01) |
| 7 | 17.46 (0.02) | 16.99 (0.02) | 16.74 (0.03) | 16.37 (0.01) | 16.36 (0.02) |
| 8 | 19.00 (0.02) | 18.34 (0.04) | 18.05 (0.01) | 17.65 (0.02) | 17.60 (0.02) |
| 9 | 19.04 (0.04) | 18.51 (0.03) | 18.20 (0.02) | 17.82 (0.01) | 17.78 (0.02) |
| 10 | 20.42 (0.06) | 18.97 (0.05) | 18.36 (0.06) | 17.76 (0.02) | 17.60 (0.02) |
| 11 | 19.95 (0.03) | 18.35 (0.04) | 17.33 (0.04) | 16.36 (0.01) | 15.58 (0.01) |
| 12 | 19.70 (0.03) | 18.27 (0.04) | 17.63 (0.04) | 16.96 (0.01) | 16.72 (0.02) |
| Star | g | r | i | z |
|---|---|---|---|---|
| 1 | 15.60 (0.01) | 15.17 (0.01) | 14.50 (0.01) | 14.90 (0.01) |
| 2 | 17.20 (0.01) | 16.63 (0.01) | 15.91 (0.01) | 16.25 (0.02) |
| 3 | 17.64 (0.01) | 17.15 (0.01) | 16.46 (0.01) | 16.84 (0.01) |
| 4 | 16.33 (0.01) | 15.92 (0.01) | 15.27 (0.01) | 15.67 (0.01) |
| 5 | 18.10 (0.01) | 17.28 (0.01) | 16.51 (0.01) | 16.81 (0.01) |
| 6 | 14.65 (0.01) | 14.05 (0.01) | 13.32 (0.01) | 13.66 (0.01) |
| 7 | 16.89 (0.01) | 16.37 (0.01) | 15.66 (0.01) | 15.99 (0.01) |
| 8 | 18.22 (0.01) | 17.69 (0.01) | 16.96 (0.01) | 17.33 (0.01) |
| 9 | 18.38 (0.01) | 17.78 (0.01) | 17.10 (0.01) | 17.39 (0.02) |
| 10 | 18.65 (0.01) | 17.74 (0.01) | 16.91 (0.01) | 17.17 (0.01) |
| 11 | 17.80 (0.01) | 16.36 (0.01) | 14.88 (0.01) | 14.99 (0.01) |
| 12 | 17.95 (0.01) | 16.93 (0.01) | 16.02 (0.01) | 16.26 (0.01) |
| Date | MJD | Phase* | Range | Resolution | Instrumental |
|---|---|---|---|---|---|
| yy/mm/dd | (days) | (Å) | (Å) | Configuration | |
| 12/04/28 | 56046.40 | -1.8 | 3585–9070 | 30 | NTT+EFOSC2+gm13 |
| 12/05/03 | 56051.41 | 3.2 | 4550–8730 | 3,4 | Gemini+GMOS+B600/R400 |
| 12/05/31 | 56079.40 | 31.2 | 4550–8730 | 3,4 | Gemini+GMOS+B600/R400 |
| 12/07/07 | 56116.42 | 68.2 | 4550–8230 | 3,4 | Gemini+GMOS+B600/R400 |
| 12/08/08 | 56148.06 | 99.8 | 3585–9070 | 18 | NTT+EFOSC2+gm13 |
| 12/08/09 | 56149.23 | 101.0 | 9180–13220 | 23 | NTT+SOFI+BG |
| 12/08/10 | 56150.30 | 102.1 | 3430–9370 | 2 | ANU 2.3m+WiFeS+B300/R300 |
| 12/08/17 | 56157.18 | 109.0 | 3585–9070 | 18 | NTT+EFOSC2+gm13 |
| 12/08/24 | 56164.02 | 115.8 | 3585–9070 | 18 | NTT+EFOSC2+gm13 |
| 12/09/06 | 56172.30 | 124.1 | 3430–9370 | 2 | ANU 2.3m+WiFeS+B300/R300 |
| 12/09/07 | 56173.30 | 125.1 | 3430–9370 | 2 | ANU 2.3m+WiFeS+B300/R300 |
| 12/09/15 | 56185.98 | 137.8 | 3585–9070 | 18 | NTT+EFOSC2+gm13 |
| 12/09/15 | 56186.05 | 137.8 | 9180–13220 | 23 | NTT+SOFI+BG |
| 12/09/22 | 56193.11 | 144.9 | 3430–9370 | 2 | ANU 2.3m+WiFeS+B300/R300 |
| 12/09/23 | 56194.10 | 145.9 | 3430–9370 | 2 | ANU 2.3m+WiFeS+B300/R300 |
| 12/09/24 | 56195.01 | 146.8 | 14600–24710 | 33 | NTT+SOFI+RG |
| 12/10/22 | 56223.06 | 174.9 | 9180–13220 | 23 | NTT+SOFI+BG |
| 12/11/12 | 56244.04 | 195.8 | 3585–9070 | 18 | NTT+EFOSC2+gm13 |
| 12/11/13 | 56245.00 | 196.8 | 9180–13220 | 23 | NTT+SOFI+BG |
| 13/02/20 | 56344.34 | 296.1 | 3585–9070 | 18 | NTT+EFOSC2+gm13 |
| 13/03/11 | 56363.28 | 315.1 | 9180–24710 | 23,33 | NTT+SOFI+BG/RG |
| 13/03/18 | 56370.38 | 322.2 | 3585–9070 | 18 | NTT+EFOSC2+gm13 |
| 13/04/18 | 56401.35 | 353.1 | 3585–9070 | 18 | NTT+EFOSC2+gm13 |
| 13/05/08 | 56421.20 | 373.0 | 5280–7060 | 2 | ANU 2.3m+WiFeS+R300 |
| 13/05/26 | 56439.20 | 391.0 | 3430–9370 | 2 | ANU 2.3m+WiFeS+B300/R300 |
| 13/06/03 | 56446.20 | 398.0 | 3430–6890 | 2 | ANU 2.3m+WiFeS+B300/R700 |
| 13/08/16 | 56521.04 | 472.8 | 3585–9070 | 18 | NTT+EFOSC2+gm13 |
| 13/09/11 | 56547.11 | 498.9 | 3585–9070 | 18 | NTT+EFOSC2+gm13 |
| 13/10/13 | 56579.05 | 530.8 | 3585–9070 | 18 | NTT+EFOSC2+gm13 |
* Phase with respect to the R-band maximum.