Dynamics of homogeneous nucleation
Abstract
The classical nucleation theory for homogeneous nucleation is formulated as a theory for a density fluctuation in a supersaturated gas at a given temperature. But Molecular Dynamics simulations reveal that it is small cold clusters which initiates the nucleation. The temperature in the nucleating clusters fluctuate, but the mean temperature remains below the temperature in the supersaturated gas until they reach the critical nucleation size. The critical nuclei have, however, a temperature equal to the supersaturated gas. The kinetics of homogeneous nucleation is not only caused by a grow or shrink by accretion or evaporation of monomers only, but by an exponentially declining change in cluster size per time step equal to the cluster distribution in the supersaturated gas.
I Introduction
The classical nucleation theory (CNT) Volmer ; Becker was formulated for almost ninety years ago. The theory describes the nucleation of a liquid droplet in a supersaturated gas as the creation of a critical nucleus, where the gain in free energy of the liquid in the nucleus by increasing the number of particles equals the cost of an increased surface free energy. Since then there has been continuous refinements of the basic ideas of CNT Lothe ; Reiss ; Kalikmanov , and formulations of semiphenomenological models Dillmann ; Viisanen ; Laaksonen ; Reiss1 .
Parallel with the development in the theories and the experimental investigations of nucleation, the development in computer capability has make it possible to determine homogeneous nucleation by various simulation methods Daan ; Matsumoto ; Tox1 ; Diemand . The Molecular Dynamics (MD) simulations make it possible directly to obtain detailed information, not only about the thermodynamics, but also the kinetics at homogeneous nucleation. The present simulations reveal that the creation of a critical nucleus always is initiated by a small cold cluster, much smaller than the the critical nucleus, and the cluster remains colder than the supersaturated gas until the critical nucleus is created. The dynamics and the properties of the nucleating cluster deviate at several points from the assumptions in the traditional CNT and its refinements.
The article is organized as follows. Section II describes the MD simulation of homogeneous nucleation, and the data collection of the properties of the nucleating clusters are given in subsections (IIa, IIb). The properties of the nucleating clusters are presented in Section III, which first describes the supersaturated state in subsection IIIa. A short summary is given in Section IV.
II Molecular Dynamics simulation of homogeneous nucleation
The system consists of Lennard Jones (LJ) particles in a cubic box with periodical boundaries ToxMD . The MD simulations are performed with the central difference algorithm in the leap-frog version, and the forces for pair interactions greater than are ignored. There are different ways to take the non-analyticity of the potential at into account. The most stable and energy conserving way is to cut and shift the forces (SF) Tox2 , but most simulations are for cutted and shifted potentials (SP). The extensive MD simulations of homogeneous nucleations Diemand ; Angelil were performed for a SP cut with , and with the conclusion, that even the very weak attractions behind this long range interaction increases the nucleation rate a little. The present simulations are for SF with . We have investigated ensembles of 25 simulations with SP and SF with and found no significant differences in the obtained data, inclusive the temperatures of the nucleating cluster, within the statistical uncertainties.
The discrete MD is exact in the sense that there exist a ”shadow Hamiltonian” for sufficient small time steps for which the discrete MD positions lie on the trajectories for the Newtonian dynamics with the shadow Hamiltonian Tox3 . The proof is based on an analytic expansion, but it is not possible to determine the range of convergence of the expansion. Numerical investigations indicate, however, that the energy is conserved for time steps, , significant bigger than traditional used in MD Tox4 . The simulations in Diemand ; Angelil were performed for a time increment , well inside the estimated convergence radius. We have performed ensemble simulations with and and found no significant differences in the data ( ) for the nucleations within the statistical uncertainties.
The time averages of the MD simulations correspond to the microcanonical averages with a constant energy (NVE). The dynamics can, however, be constrained to a given mean temperature (NVT), e.g by a Nosé-Hover constraint Tox5 . As concluded in Wedekind and Diemand , a temperature constraint does not affect the homogeneous nucleation in the very big particle systems. We have performed NVE and NVT ensemble simulations and have reached to the same conclusion. The nucleation data in Table 1 and Table 2 in Section III are for nucleations at the temperature and for five different densities, and for ensemble simulations of 25 independent NVT simulations at each density with a time increment and with the Nosé-Hoover thermostat with a friction .
II.1 MD simulation of homogeneous nucleation
A supercooled gas can remain in the quasiequilibrium state (QES) for some times, but sooner or later it will form some critical nuclei and separate into a gas with liquid droplets. Homogeneous nucleation with MD is a stochastic and chaotic process. It is not possible to predict, when a nucleation takes place, and the round-off errors of the floating point data for the chaotic MD dynamics make it difficult to reproduce the dynamics of the nucleation in detail. For these reasons we have (for the first time) determined the cluster distribution and their properties directly in the system at each time step during the simulation and thereby collect the necessary information about the kinetics and the temperature of the nucleating cluster directly during the nucleation.
The dynamics and the energies, temperatures and coordination number of the nucleating clusters are determined for the QES densities 0.027, 0.0275, 0.028, 0.0285 and 0.029 along the isotherm . But although the nucleating cluster exhibits some rather well defined behaviour, it varies, however, for the different nucleating clusters. For this reason ensembles of independent nucleating clusters are performed, and the results in Table 1 and Table 2 are the means of 25 independent nucleations, and with the uncertainties obtained from the standard deviations of the 25 independent nucleations at each density.
It is necessary to determine the distribution of clusters every time step in order to obtain the dynamics of nucleation. This can be done without a significant increase in computer time. Normally a MD program for a system of many thousand particles is optimized by sorting the particles in pairs of particles, which interact or might interact within a short time interval. The present MD is performed by a double sorting, first by sorting the particles into subboxes of side length , following by a neighbour linked-list sorting of pairs of interacting particles within subboxes and their neighbour subboxes. The list is then updated when one of the particles have moved more than a distance . The computer time increases almost linearly with the number of particles in the system by this double sorting of nearest neighbours whereby one can simulate big systems.
The cluster distribution can be obtained from the list of pairs of neighbour particles at the same time as the forces between the particles is determined. The force between pairs of particles, no. and is calculated for . At this point in the program one also notices if the distance is smaller than the binding distance . The total distribution of clusters are obtained in the following way: At a given time, and before the forces are calculated, all the particles are given a cluster number equal to zero (in an array ). They are not yet associated to any cluster. The MD program starts the force calculation by calculating the distance for the first pair of neighbours, and if these two particles are associated to cluster number 1 (i.e. ), and the cluster number 1 contains (in a corresponding array, and ) the information that particle number and is associated to this cluster. A new pair of neighbors is investigated and it happens that or already are associated to a cluster ( or ), then is included in ’s cluster or , or it happens that both particles are within two different clusters, which then are merged together. The full determination of all the clusters and with particle numbers is then completed at the end of the force calculations. The computer time increases linearly with , and it is possible to obtain the cluster distribution every time steps for very big MD systems without a significant increase in computer time Laradji .
II.2 Determination of cluster properties
The particles in a cluster are within a ”binding” distance, , to some other particles in the cluster. Traditionally one chooses this distance to be significant smaller than the range of the first coordination shell Tox6 in order to ensure that only particles which are energetically tied together are included in the cluster. In the present investigation we have used . The precise definition of how many particles a given particle is close to- and how close to it is, is not important for the determination of a cluster and critical nucleus . For details concerning the definition of a cluster see e.g. Daan ; Tox1 . The size of the critical nucleus depends, however, on the choice of the coordination number.
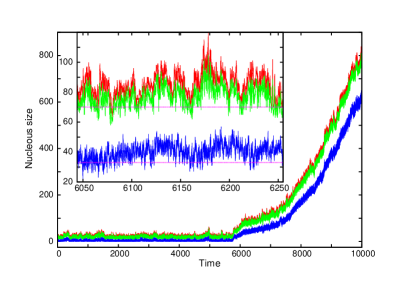
The particles within a cluster are here characterized by that they have coordination numbers, , greater than one, i.e a particle is at least near two other particles. By this definition particles within the ”corona” of the cluster are included whereas a particle which just collide with a particle at the ”surface” of the cluster is not. An example of the time evolution of the number of particles, , in a nucleating cluster is shown in Figure 1. A small cluster of particles grow to a critical nucleation size at time (inset). The time evolution of is obtained for three different definitions. The red curve is for a nucleating cluster where all particles have at least one neighbour particle in the cluster. The green curve is with the definition used here, where a particle has at least two other neighbours. In Daan it is demonstrated that all LJ particles in a liquid have at least five nearest neighbours, and the blue curve shows with this definition. The time evolutions of are, however synchronous for the three criteria, and the obtained data for the homogeneous nucleation, except the size of the critical nucleus, depend not on the precise definition of a cluster.
The temperatures, densities, energies, etc. are obtained from the positions and velocities of the particles in the first nucleating cluster. But there is a practical problem. The nucleation is a stochastic and chaotic process, and it is not possible to determine in advance which of the small clusters in the supersaturated gas which begin to nucleate. In practice it requires a very complicated and extensive record of clusters, if one, in this way shall identify the nucleating clusters from the birth to when they reach the size of the critical nucleus. We have overcome this problem by only recording the properties of the each time step. The biggest cluster is the first to overcome the nucleating energy barrier. But although the nucleation is a rare event this can, however, lead to errors if the recorded start of the growth of the biggest cluster is for another cluster than a cluster which shortly after overhauls and nucleates. This event, which happens in a few cases is, however, easily identified from a jump in the recorded position of the center of mass of the biggest cluster during the nucleation, which indicates that the record of size and data is shifted to another cluster. The simulation is then rejected, and a new independent nucleation is performed. By this procedure we obtain the complete data for the first nucleating cluster in the system.
The instant temperature, , of the nucleating cluster is determined in the usual way from the kinetic energy, , of the particles in the cluster at time as . (For a determination and discussion of the temperature in small clusters and in a non-equilibrium system see Wedekind , Hoover .) The density at the center of a cluster is determined indirectly from the coordination number of the particle closest to the centre of mass of the cluster. In the LJ system with spherical symmetrical potentials the mean coordination number of particles within a given distance gives a precise measure of the mean density in the uniform fluid. The question is: when is the density of the corresponding liquid established at the center of the nucleating cluster? The present simulations are performed for densities along the isotherm , where the corresponding liquid density is Watanabe and where bulk liquid particles with a sphere with have a mean coordination and a mean potential energy . The data for the corresponding gas with density are and .
The connection between the coordination number and the density at the center of the cluster is established by determining the coordination number for particles in an uniform fluid for different densities. There is, however a problem since a fluid with a density in between the corresponding densities and will phase separate. This problem is circumvented by performing MD where only the forces from particles within the first coordination shell are included in the dynamics Tox6 . A system with only these forces has a radial distribution similar to the LJ system, and the exclusion of the long attractions in the dynamics ensures that the uniform distribution is maintained without phase separation Tox7 . The mean coordination numbers for a particle in these uniform fluids at and with the mean densities = 0.70, 0.65, 0.60 and 0.5 are =8.40 for = 0.70; =7.66 for = 0.65; =6.94 for = 0.60 and =5.53 for = 0.50. These data are used to determine the density at the center of the nucleating clusters by interpolation.
III Dynamics of homogeneous nucleation
III.1 The quasi-equilibrium state (QES)
A QES state with supersaturations is caraterized by that the pressure is higher than the pressure in the corresponding equillibrium system of liquid and gas. The five supersaturated states correspond to moderate supersaturations (). The supercooled QES are characterized by that they only contain clusters with cluster sizes significant smaller than the size of the critical nucleus. The clusters are identified at each time step and the biggest cluster is investigated in details. The biggest cluster contains in mean particles for the density states at the isotherm , whereas the critical cluster size is (Figure 1). The biggest cluster in the QES occasionally reach a size of within a fluctuation, but the nucleation appears only for a cluster which exceeds .
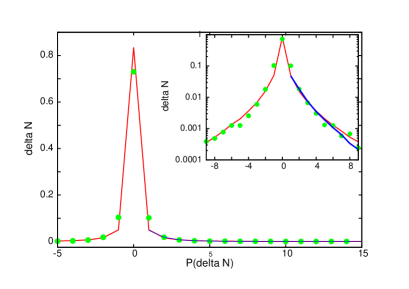
The mean distribution of clusters in the QES state is shown in Figure 2 (blue line) together with the change in cluster size, , per time step of the biggest cluster in the QES (red line) and at nucleation (green filled circles). The distributions in the figure show that the kinetics of homogeneous nucleation, given by , is not only caused by a grow or shrink by accretion or evaporation of monomers only, as in general assumed in classical nucleation theories, but by an exponentially declining change in cluster size per time step. Secondly we notice that the kinetics in the QES state as well as at nucleation, scales well with the distribution of clusters in the supersaturated gas, so the change in cluster size per time step of the biggest cluster at nucleation is proportional with the cluster distribution in the QES, as expected for the kinetics in an equilibrium state.
The coordination number, , of the particle nearest the center of mass of the cluster, which corresponds to a density , reveals that the local sphere at the center is not very liquid-like. (The densities of the corresponding liquid and gas at are 0.7367 and 0.0174, respectively Watanabe , and with a mean coordination number, =9.02 in the liquid and a potential energy per particle, . The central particle in biggest clusters in the QES has a mean potential energy .)
The temperature of an ensemble of particles at equilibrium fluctuates proportional to and the temperature in the small clusters in the QES state fluctuates very much. But the mean temperature of the biggest non-nucleating cluster in the QES state is determined to be for ) and equal to the mean temperature of the system, as must be the case for an equilibrium state. This result is, however, rather misleading since it is always a cold cluster which initiates the nucleation and nucleate.
III.2 The nucleation
The temperature of the nucleating clusters varies during the nucleating, as also observed by Wedekind ; Angelil , but this observation overshadows the fact that the nucleating clusters are cold at the onset of nucleation and remain cold during the nucleation.
The result of the ensemble simulations of nucleation for the different densities are collected in Table 1 and Table 2.
Table 1 contains the averages over the time interval for the twenty five successful clusters
with from they begin the growth at , and reach the barrier .
This nucleation barrier is not exact, but we have noticed that a cluster when it reaches
either continues the growth, (Figure 1),
or in a few cases
shrinks and disappears. is the mean temperature in the time interval of the nucleating clusters
and is the mean coordination number of the particles at the centre of mass of the clusters and with mean potential
energy .
Data for the onset of nucleation are collected in Table 2. The data are the average values over the time interval
(5000 time steps) at the beginning of the nucleation.
The corresponding data for the end of the nucleation time, , are also determined (Table 2, column 3).
Table 1. Data for the cluster nucleation at .
| 0.027 | 57000±44000 | 343±276 | 0.782±9 | 7.0±4 | -3.62±20 |
| 0.0275 | 46000±58000 | 401±261 | 0.782±11 | 7.2±2 | -3.69±12 |
| 0.028 | 37000±26000 | 390±225 | 0.786±7 | 7.2±4 | -3.69±21 |
| 0.0285 | 8800±8000 | 359±203 | 0.792±8 | 6.9±4 | -3.59±20 |
| 0.029 | 8300±7800 | 390±225 | 0.795±9 | 7.0±3 | -3.62±17 |
Table 2. The mean temperature at the onset and at the end of nucleation.
| Onset: | End: |
| 0.027 | 1.55 | 0.765±18 | 0.789±19 |
| 0.0275 | 1.58 | 0.771±20 | 0.796±16 |
| 0.028 | 1.61 | 0.776±17 | 0.797±16 |
| 0.0285 | 1.64 | 0.783±17 | 0.799±16 |
| 0.029 | 1.67 | 0.788±16 | 0.798±16 |
The mean times, , for the start of nucleation (Table 1, Column 2) increase with decreasing
QES densities and corresponding supersaturation . The uncertainties of , which are of the same order as ,
reflect the fact that homogeneous nucleating is a stochastic process. The mean nucleation times, (Column 3) are
, corresponding to 40000 time steps. The temperature is obtained at each time step
during the nucleation. The mean temperatures (Column 4) are the mean of 25 independent nucleations
with standard deviations obtained from the 25 events, each with of the order 40000 instant
values of the temperature during the nucleation. The mean temperatures
are less than the mean
temperature in the systems, and there is a systematic trend with colder nucleating clusters
for smaller QES densities. The mean temperatures at the onset of nucleation (Table 2) confirm
this observation. The temperatures at the onset of nucleation are colder than the mean temperature at nucleation, and colder with decreasing
QES densities. The mean temperatures at the end of nucleation show that the
clusters now are just colder than the supercooled gas, although not very much.
A question arises whether the low temperatures are caused by aggregations of cold particles and small cold clusters to the surface of the growing nucleus or whether also the core of the clusters remain colder than the mean temperature in the QES. The core of the clusters are characterized by that the particles there have at least five neighbours. The mean temperature in these cores for the 25 nucleations at is , and in excellent agreement with the corresponding mean temperature for the clusters. So the cold nucleating clusters are in internal temperature equilibrium.
Another observation is that the mean lengths of the nucleation period, (Table1, Column 3) are almost the same for the different state QES states despite of that the nucleation times varies with a factor of eight. The states with less QES densities overcome the transition barrier within the same time, but it is only a colder cluster which nucleates.
The mean coordination number, , for the central particle in the clusters is smaller than the mean coordination number for a particle in the corresponding liquid. A mean coordination number in the interval (Table 1, Column 5) corresponds to a density . At the onset of nucleation , which corresponds to a center density and at the end of the nucleation period where the density at the center of the critical nucleus is only increased to , which is significant less than the liquid density . So the nucleating cluster and the critical nucleus do not have a liquid-like center. This observation agrees with previous investigations Angelil . The mean potential energy per particle at the center of the nuclei is significant higher than the mean potential energy of corresponding bulk liquid due to the less dense core of the nucleating nuclei.
The critical nuclei remain with a nucleus size of particles for a certain (transition) time in many of the nucleations and for all five QES states (Figure 1). This ”barrier tumbling” is because that there is only a small gain of free energy by the growth at the extremum of the free energy. It is possible to locate a transition zone in most of the nucleations. The end of the transition period is determined as the time from where the size of the nucleus remain above , and twenty four out of the twenty five nucleations for the QES with exhibit a transition zone, .
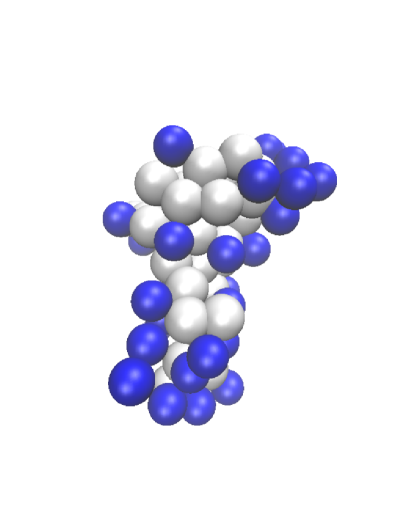
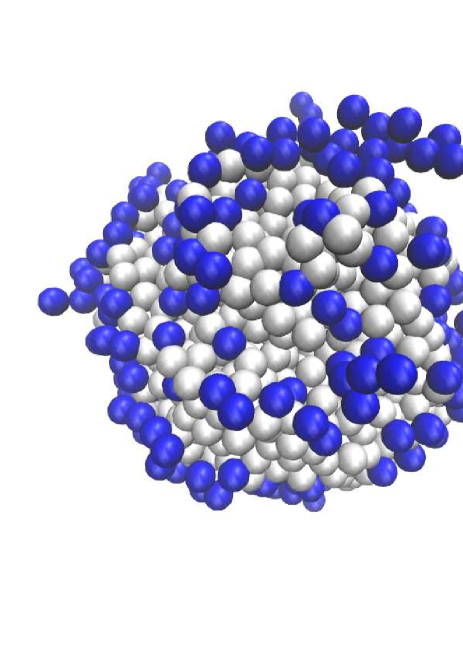
The behaviour in the transition zone is investigated in details for the QES state . The mean temperature is now and equal to the mean temperature in the system, but the mean coordination number and potential energy of the central particle in the nuclei show that the critical nuclei in the transition zone still do not have a liquid-like core. The liquid like core is however established rather short after the passage of the critical nucleating barrier. Figure 5 shows the nucleus after a time of with droplet growth. The nucleus consist of 1665 liquid-like particles in a spherical droplet and with a bulk liquid core.
IV Summary
Homogeneous nucleation in a supercoled gas of Lennard-Jones particles is obtained by MD simulations. The temperature of the nucleating cluster is for the first time obtained every time step, and the simulations reveal that it is always a small cold cluster which initiates the nucleation. The temperature in a nucleating cluster fluctuates, but the mean temperature of the cluster remains below the temperature in the supersaturated gas until the critical nucleus is created. The temperature of the nucleating cluster changes in a systematic way with the degree of supersaturation. For less supersaturation an even colder cluster starts the nucleation (Table 1,Table 2). The initial results are obtained for five moderate supersaturations at a temperature between the triple- and critical temperature. We have, however, tested that the dynamics are valid for nucleation of liquid droplets at other temperatures ( and 0.90), but further work needs to be carried out to clarify e.g. whether it also is valid for more complex systems like nucleation of water droplets.
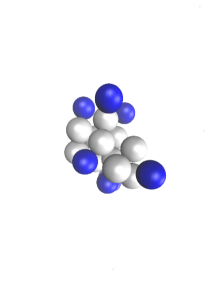
The critical nucleus has a temperature , equal to the temperature in the gas and with a slow growth, indicating that the critical nucleus is in an extremum state of the free energy. The critical nuclei do not have a compact spherical shape, and the coordination number of the central particles in the critical nuclei show that the density at their centre are not liquid-like, as also observed by Angelil . A representative example is shown in Figure 4. The nuclei take, however, quickly a compact spherical-like form during the succeeding droplet growth (Figure 5).
The kinetics of homogeneous nucleation, , is not only caused by a grow or shrink by accretion or evaporation of monomers only, but by an exponentially declining change in cluster size per time step. The kinetics at nucleation is equal to the kinetics in the supercooled quasi equilibrium state, and given by the cluster distribution in the supercooled gas (Figure 2), as expected for the kinetics in an (quasi-) equilibrium state.
Acknowledgments
The center for viscous liquid dynamics ‘Glass and Time’ is sponsored by the Danish National Research Foundation (DNRF).
References
- (1) M. Volmer and A. Weber, Z. Phys. Chem. 119, 277 (1926).
- (2) R. Becker and W Döring, Ann. Phys. (Leipzig) 24, 719 (1935).
- (3) J. Lothe and G: M. Pound, J. Chem. Phys. 36, 2080 (1962).
- (4) H. Reiss, L.J. Katz, and E.R. Cohen, J. Stat. Phys. 2, 83 (1968).
- (5) For a resent review see V. Kalikmanov, Nucleation Theory, Springer,2013.
- (6) A. Diilmann and G.E.A. Meier, J. Chem. Phys. 94, 3872 (1991).
- (7) Y. Viisanen, R. Strey, and H. Reiss, J. Phys. Chem. 99, 4680 (1993).
- (8) A. Laaksonen, I.Ford, and M.Kulmala, Phys.Rev. E 49, 5517 (1994).
- (9) D. Reguera and H. Reiss, J. Phys. Chem B 108,19831 (2004).
- (10) P. R. ten Wolde and D. Frenkel, J. Chem. Phys. 109, 9901 (1998).
- (11) K. Yasuoka and M. Outsmart, J. Chem. Phys. 109, 8451 (1998); 109, 8463 (1998).
- (12) S. Toxvaerd, J. Chem. Phys. 115, 8913 (2001).
- (13) J. Diemand, and R. Angélil, K. K. Tanaka, and H. Tanaka, J. Chem. Phys. 139, 074309 (2013).
- (14) In MD the mass is usually included in the time unit. The unit length, energy and time used for LJ systems are, respectively, , and .
- (15) S. Toxvaerd and J. C. Dyre, J. Chem. Phys. 134, 081102 (2011).
- (16) R. Angélil, J. Diemand, K. K. Tanaka,and H. Tanaka, J. Chem. Phys. 140, 074303 (2014).
- (17) S. Toxvaerd, O. J. Heilmann, and J. C. Dyre, J. Chem. Phys. 136, 224106 (2012).
- (18) S. Toxvaerd, J. Chem. Phys. 137, 214102 (2012).
- (19) S. Toxvaerd, J. Chem. Phys. 139, 224106 (2013).
- (20) J. Wedekind, D. Reguera, and R. Strey, J. Chem. Phys. 127, 064501 (2007).
- (21) W. G. Hoover, B. L. Holian, and H. A. Posch, Phys. Rev. E 48, 3196 (1993).
- (22) M. Laradji, (unpublished).
- (23) S. Toxvaerd and J. C. Dyre, J. Chem. Phys. 135, 134501 (2011).
- (24) H. Watanabe, N. Ito, and C-K. Hu, J. Chem. Phys. 136, 204102 (2012).
- (25) S. Toxvaerd, Condens. Matter Phys. 18, 13002 (2015).