DPF2015-66
Search for associated production of a Higgs boson with a single top quark
Kenneth Bloom
Department of Physics and Astronomy
University of Nebraska-Lincoln, Lincoln, NE 68588-0299
We present a search for the production of a Higgs boson in association with a single top quark (), using data samples collected by the CMS detector in collisions at center-of-mass energy of 8 TeV corresponding to integrated luminosity of 19.7 fb-1. The search exploits a variety of top quark and Higgs boson decay modes resulting in final states with photons, bottom quarks, or multileptons, and employs a variety of machine learning techniques to maximize the sensitivity to the signal. The present analysis is optimized for a scenario where the Yukawa coupling has sign opposite to the standard model prediction, which would result in a large enhancement of the signal cross section. Results for individual final states and the combined results will be presented.
PRESENTED AT
DPF 2015
The Meeting of the American Physical Society
Division of Particles and Fields
Ann Arbor, Michigan, August 4–8, 2015
1 Introduction
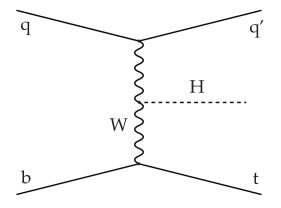
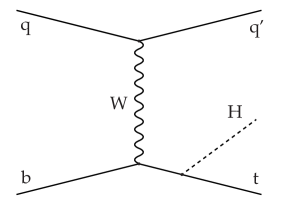
Since the discovery of a Higgs boson, we have all become quite familiar with the four favorite Higgs production modes: direct production through gluon fusion, vector boson fusion, associated production with a or boson, and associated production with a pair. The measurements of the rates for these production processes generally agree well with the predictions of the standard model [1]. But there is another production mode to consider: the associated production of a Higgs boson with a single top quark through a -channel electroweak interaction. (The final state is denoted as because of the spectator quark that appears.) The cross section for this process is expected to be about a thousand times smaller than that for gluon fusion, with = 18.3 fb. Why even bother looking for something with such a tiny rate in the Run 1 LHC data?
The answer can be seen in the two diagrams for production shown in Figure 1. The Higgs boson emerges from either an internal boson or an external top quark. The cross section is small because of the destructive interference between these two diagrams. There is nothing deep about this – there is no symmetry that keeps the rate small – but it is how the calculation turns out. However, should the sign of the top Yukawa coupling be inverted (, the destructive interference becomes constructive, and the predicted cross section would increase by a factor of about 13 [2]. While is disfavored by the current data, it is not completely eliminated, and other new physics such as flavor-changing neutral current (FCNC) processes could also enhance the rate for production. Thus this channel provides an interesting path to discovery through interference effects.
The CMS Collaboration has completed four direct searches for the process, corresponding to different Higgs boson decay modes. All four search explicitly for the process. All take advantage of top-quark leptonic decay, which provides a lepton, jet and missing energy in the final state. All have production as the most significant background, as events (including ) contain many of the same elements as the the signal. The four Higgs final states explored are (small branching ratio but very pure, plus an enhancement in the branching fraction due to ); / decaying to multiple leptons (large branching fraction, but has non-prompt lepton backgrounds); (similar issues to multileptons but even smaller rate); and (largest branching ratio but very large background). The results of the four searches are combined into a single limit on anomalous production. The [3], / [4] and [5] results have previously been presented in preliminary form; the result and the combination were presented for the very first time at this conference. The remainder of this paper gives brief descriptions of each of the four analyses and of the combination.
2 The searches
2.1
The analysis searches for a narrow di-photon resonance with a mass near that of the Higgs boson, GeV. In addition, candidate events are required to have a single isolated electron or muon candidate, one identified jet, and one forward jet; these are the decay products of the single top and the spectator quark.
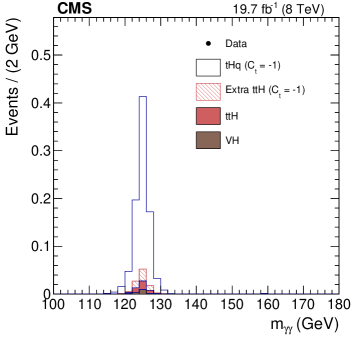
Background processes that produce real decays will give events in the signal region of . These are reduced with a cut on a likelihood discriminant designed to distinguish from production that is formed from various kinematic quantities in the event. Simulations are then used to estimate the rate. The contributing processes are (0.03 + 0.05 events), (0.01 + 0.01 events); all other Higgs production mechanisms give neglible contributions. The second number in the pairs listed reflects the enhancement in due to the assumed value of . All remaining backgrounds have a smooth shape in and can be estimated from the data using the sidebands in that quantity. The spectrum is fit with an exponential function, and higher-statistics control regions are used to estimate systematic uncertainties on the fit.
The resulting spectrum is shown in Figure 2. Zero events are observed in the sidebands, and zero events are observed in the signal region also. This results in a 95% confidence level upper limit of , which coincides with the expected limit.
2.2 /
The multilepton final state targets cases where the Higgs boson decays to which then decay to leptons (either or ), but also captures some amount of with each decaying to or . Along with the semileptonic top decay, this gives three leptons in the final state. This allows for a trilepton search in the final states , , and . In addition to those leptons, exactly one -tagged jet, at least one forward non--tagged jet and missing energy are required. Events consistent with a boson decay are vetoed.
A search involving same-sign dileptons will detect events in which one of the bosons decays hadronically and the other decays leptonically. A same-sign pair ( or ) is chosen to reduce backgrounds from Drell-Yan processes. In addition, events are required to have at least one -tagged jet, at least one central jet, and at least one forward non--tagged jet. Hadronic tau decays are explicitly rejected.
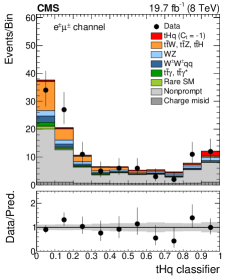
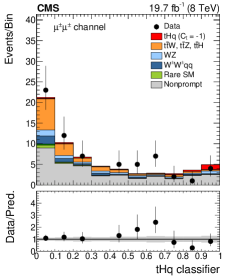
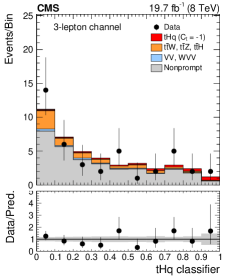
In all of the channels, about half of the background events come from non-prompt leptons, most of which come from decays. The rate for this background is estimated with a “tight-loose” method, in which a fake rate is measured in control samples, and then applied to events that have similar kinematics to those in the signal sample but reside in identification and isolation sideband regions. There are also background events due to misidentified lepton charge; the rate for this is estimated from boson events. The signal events can be distinguished from other events through a discriminating likelihood function that is formed from information on forward activity, jet and -jet multiplicity, and lepton kinematics and charge. The expected number of signal and background events are 3.3 and 106 in the sample, 2.2 and 53 in the sample and 1.5 and 42 in the sample.
Figure 3 shows the output of the discriminating function for those data samples, along with the physics components of the sample normalized to the results of a likelihood fit that is used to set a limit on the production rate. A combination of the results from the three samples gives an expected upper limit of at the 95% confidence level, and an observed limit of . The largest systematic uncertainties arise from the non-prompt lepton rate estimate.
2.3
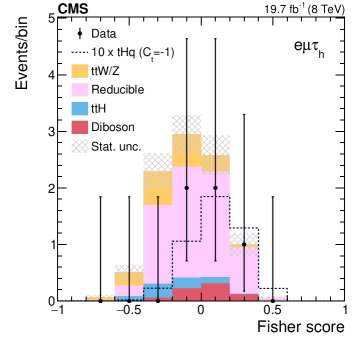
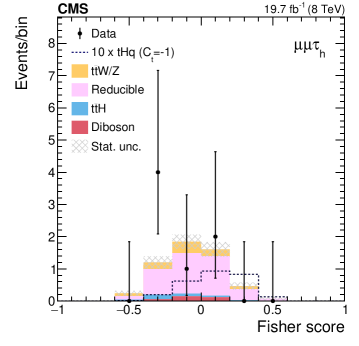
The search space for can be expanded further by including decays. This search is similar to the trilepton analysis, but incorporates a hadronically-decaying as one of the three leptons. The desired signature is a same-sign or pair, with one lepton coming from top decay and the other from a leptonic decay. The analysis uses a multivariate technique to evaluate the lepton isolation. An isolated and a least one -tagged jet are also required. The largest background in the analysis is from events with non-prompt leptons. As with the trilepton analysis, the contribution from non-prompt leptons is estimated by determining a fake rate and applying it to a sideband sample. And similarly to the trilepton analysis, a Fisher discriminant is built to separate the background processes, using the properties of the most-forward jet, -jet properties and other kinematic variables. A sample with inverted isolation is used for training and validation of the discriminant.
A total of 0.48 (0.30) signal events are expected in the () sample, along with 9.5 (5.4) background events. A total of 5 (7) events are observed in the data. The distributions of the Fisher discriminant values is shown in Figure 4. A maximum likelihood fit of these distributions is used to obtain limits on the production rate. For these two samples, the fit gives an expected upper limit of at the 95% confidence level, and an observed limit of . The largest systematic uncertainties in the analysis come from the estimate of the non-prompt lepton background rates, but the statistical uncertainties dominate the limit that is obtained.
2.4
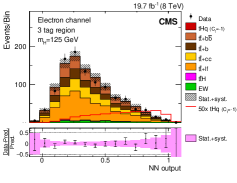
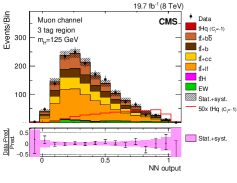
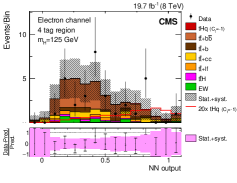
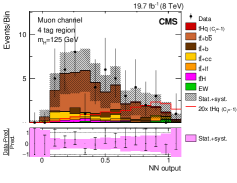
The decay mode provides a promising avenue for the search because of the large branching ratio for that decay. The event selection requires one isolated high transverse momentum () lepton ( or ), missing energy from the neutrino in the boson decay, a non--tagged jet that is either forward or higher in , and three or four -tagged jets – one from the top-quark decay, two in the Higgs boson decay, and possibly one more from gluon splitting in the initial-state partons. Unfortunately, with extra heavy-flavor jets or mistagged light jets can also produce such a final state. The expected signal to background ratio is 13/1900 in the 3 sample and 1.4/66 in the 4 sample.
The large number of jets in the final state leads to complications. Each of the jets needs to be assigned to parent quarks in final state. A multivariate discriminator based on event quantities such as invariant masses, jet angular separations, jet and values and jet charges is used to do the assignment. The single best assignment of jets to quarks is used as the reconstruction hypothesis. This is done twice, under two different assumptions of the final state – signal and background. Once these reconstructions are performed, kinematic quantities specific to each reconstruction are formed, and used to develop another discriminator that distinguishes the two processes. Templates in that variable are then used to extract the signal fraction. The template is taken from simulation, allowing the amount of additional heavy flavor quarks in those events to vary. The simulation is verified with a data-driven method that makes use of 2 events to model the kinematics in the signal sample and gives consistent results.
Figure 5 shows the event-discriminator distributions for four subsamples that are considered (3 and 4, with and as the leptons), and the results of a fit that are used to set an upper limit on the production rate. The expected upper limit is at the 95% confidence level, and the observed limit is . The largest systematic uncertainties come from the modeling and the -tag efficiencies and mistag rates.
3 Combined results
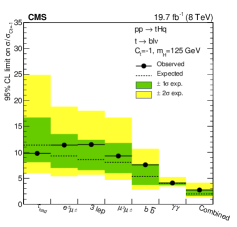
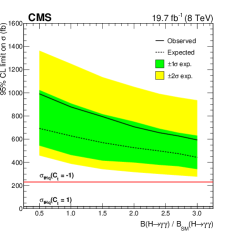
Table 1 summarizes all of the limits on production described so far. All of the information can be put into a single likelihood fit to obtain a single limit for all four searches. The fit has many bins and many free parameters to describe the systematic uncertainties; careful attention is paid to correlations amongst the uncertainties. Two different approaches are taken. One is to test sensitivity to and count any enhancement to production and the decay rate as signal. Under that assumption, the expected limit is at 95% confidence level, and the observed limit is . These results are displayed in the left panel of Figure 6. An alternative approach is to quote a limit on as a function of . That result is also shown in Figure 6.
| / | ||||
|---|---|---|---|---|
| Expected | 4.1 | 5.0 | 11.4 | 5.4 |
| Observed | 4.1 | 6.7 | 9.8 | 7.6 |
4 Conclusions and outlook
The production rate is sensitive to the sign of the top Yukawa coupling and other new physics. The CMS Collaboration has now completed searches for in four different final states; the channel was presented for the first time at this conference. A combination of the four searches, also new for this conference, yields a cross section limit of at 95% confidence level with the 19.7 fb-1 dataset of the 8 TeV LHC run. A paper describing all of these results was recently submitted for publication [6]. The measurement is not yet sensitive to the anomalous production of , but the prospects for Run 2 are quite good. is four times larger at 13 TeV, and there should be enough LHC data in 2016 to exclude (or perhaps observe?) the hypothesis. Beyond that, it will be possible to set limits in the Higgs fermion coupling-vector coupling plane, have sensitivity to Higgs-mediated FCNC processes with and more. There some very interesting opportunities ahead in these searches.
ACKNOWLEDGMENTS
I thank my many colleagues on CMS: the 3000 scientists and engineers who built and operate the experiment, and the subset of them who worked specifically on these results. I also thank the leaders of the CMS physics organization who allowed me to make the first presentation of some of these results. My work on CMS is supported by the National Science Foundation through award NSF-1306040.
References
- [1] CMS Collaboration, Eur. Phys. J. C75 212 (2015); CMS-HIG-14-009.
- [2] Discussions of the cross section calculations can be found in F. Maltoni, K. Paul, and S. Willenbrock, Phys. Rev. D64 094023 (2001); M. Farina et al., JHEP 05 022 (2013); and S. Biswas, E. Gabrielli, and B. Mele, JHEP 01 088 (2013).
- [3] CMS Collaboration, CMS-PAS-HIG-14-001.
- [4] CMS Collaboration, CMS-PAS-HIG-14-026.
- [5] CMS Collaboration, CMS-PAS-HIG-14-015.
- [6] CMS Collaboration, CMS-HIG-14-027, CERN-PH-EP-2015-255, http://arxiv.org/abs/1509.08159.