proceeding of the SF2A 2015. 7 pages, 2 Fig
Mapping optically variable quasars towards the Galactic plane
Abstract
We present preliminary results of the CIDA Equatorial Variability Survey (CEVS), looking for quasar (hereafter QSO) candidates near the Galactic plane. The CEVS contains photometric data from extended and adjacent regions of the Milky Way disk ( 500 sq. deg.). In this work 2.5 square degrees with moderately high temporal sampling in the CEVS were analyzed. The selection of QSO candidates was based on the study of intrinsic optical photometric variability of 14,719 light curves. We studied samples defined by cuts in the variability index (), periodicity index (), and the distribution of these sources in the plane (), using a slight modification of the first-order of the structure function for the temporal sampling of the survey. Finally, 288 sources were selected as QSO candidates. The results shown in this work are a first attempt to develop a robust method to detect QSO towards the Galactic plane in the era of massive surveys such as VISTA and Gaia.
keywords:
quasar: general - surveys1 Introduction
In the past few years the intrinsic variability of the QSO
(Rengstorf et al. 2004b, a, 2006; Schmidt et al. 2010; Ross et al. 2013; Graham et al. 2014)
has been used as an alternative and efficient selection method to distinguish QSO exhibiting variability from the non-variable stellar locus. Additionally,
it provides unique information about the physics of the unresolved central source.
This technique is free of bias in comparison with the inherent biases present
in the traditional methods based in specific cuts in the color-color diagram
(Hall et al. 1996; Croom et al. 2001; Richards et al. 2002; Graham et al. 2014).
The intrinsic variability of QSO has been observed in different photometric
bands from UV, optical to X-ray. This intrinsic property
has been proposed as an efficient method of selection
(Rengstorf et al. 2006; MacLeod et al. 2012; Graham et al. 2014), and is commonly quantified using the
structure fuction such that the amplitude of variability
changes with time (Hughes et al. 1992; Collier & Peterson 2001; Bauer et al. 2009; Welsh et al. 2011). The
properties of the variability in QSO have been studied in
the literature and they depend on the physical properties
of the source, as the presence of radio emission, timescale and others (MacLeod et al. 2012) and
the large luminosity of these sources is provided by mass
accretion onto super massive black holes in its center (Salpeter 1964; Lynden-Bell 1969; Rees 1984).
Both methods are now used to select QSO candidates, especially in surveys with extended time coverage like the
SDSS Strip 82 (MacLeod et al. 2012), MACHO (Pichara et al. 2012), Catalina Real-Time Transient Survey (Drake et al. 2009; Graham et al. 2014) and
in the future with Gaia (Mignard 2012). The variability selection is a technique with a high degree
of confidence (Graham et al. 2014), and recent studies have shown that variability as method for QSO selection
is more accurate and has a higher degree of purity in comparison with the use of color-only cuts (Morganson et al. 2014).
Precise identification of QSOs along the Galactic plane is very valuable for astronomical reference frame purposes.
The large extinction present in the area has meant that all QSO-oriented
surveys have systematically avoided this region, and the scarcity of
confirmed QSO there is evident. Kinematical studies of the Galactic Disk
and Bulge, especially when working in small fields of view,
would benefit enormously by having a dense and deep “network”
on confirmed QSO, to which tie in their observations.
For large-scale surveys like Gaia, it is also important to have a large enough
number of QSOs identified everywhere on the sky, to improve
the overall quality and spatial uniformity of the QSO reference system.
Finally, the ICRF always will benefit from adding more new QSO,
as the densification of their sources obviously improves
the final accuracy of such fundamental reference frame.
The extensive variability survey compiled in the CIDA Equatorial Variability Survey (CEVS) since 2001 has been used so far
to study a variety of topics, including RR Lyrae stars, T Tauri stars and young Brown Dwarfs, etc. (e.g. Vivas et al. 2004; Briceño et al. 2005; Downes et al. 2008; Mateu et al. 2012). At high galactic latitudes Rengstorf et al. (2004a, b, 2009) used the QUEST Variability Survey data, predecessor to the CEVS, to conduct a variability survey of QSOs over sq. deg. However, the CEVS has not been applied to extragalactic studies so far, particularly in the search for QSOs.
2 Data
The CEVS provides optical multi-epoch information in the , and photometric bands. For our work we have combined data from the QUEST***Quasar Equatorial Survey Team high-galactic latitude survey data, obtained during 1998 to 2001, with the CEVS data collected from 2001 to 2008. The full catalog contains more than sources, observed multiple times from 1998 to 2008. All observations were obtained with the QUEST mosaic camera (16 CCDs) installed at the 1.0/1.5m Jürgen Stock Schmidt telescope
located at the National Astronomical Observatory of Venezuela. The survey has been scanned 476 deg2 of the sky during ten years in a region defined between
and
around the Galactic plane. A detailed description of the survey is given in Mateu et al. (2012).
We selected one specific section of the catalog (with a large number of observations in each band, ), restricted to the range
and , with 14,719 sources covering an area
of 2.5 deg2 near the Galactic plane that also has with observations over 1.96 deg2 from the SDSS DR9 (Ahn et al. 2012). This region in the CEVS has typically about
30 observations per source.
3 Selection criteria
In subsections 3.1, 3.2 and 3.3 below, we describe
three methods (modified in this work), proposed in the literature to explore the intrinsic optical
variability, periodicity, and the first-order of the structure function, with the main goal to
separate variable QSO and point sources of non-variability sources (more likely associated with the stellar locus).
3.1 Variability
We adopted a formulation to that of eq. 1 in Rengstorf et al. (2006), in order to characterize the variability over three optical photometric bands, , and of the CEVS. For this purpose, we defined the index of variability according to the following criteria: (i) A minimum of 10 observations was imposed in each photometric band; (ii) The index given by the CEVS, represents the probability of variability for each photometric band, and its value is related to the (e.g., Vivas et al. 2004). The of a star is redefined in this work as:
| (1) |
where indexes over filters ( for , for , for );
is the number of observations for the i-th source and is the maximum number of observations
inside a cone search of 30 arcsec radius centered on the i-th source of the catalog. We have computed , for 14,719 sources, and
we have found for each photometric band the following percentages of sources for which
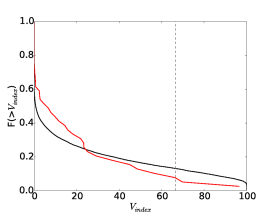
: , and . Figure 1 shows the cumulative probability distribution () for these
14,719 sources (black line) and 39 spectrally confirmed QSO (red line) from the SDSS DR9. The black
vertical dashed line, correspond to the limit imposed in this work to separate non-variable sources of
variable sources, which is the same value
proposed by Rengstorf et al. (2006). Finally, we selected 1,931 variable sources with
, for which the cumulative probability distribution of is about 13% and for the
QSO reported in this region of the sky.
3.2 Periodicity
For our pre-selection of 1,931 variable sources in §3.1, we redefined the parameter , in
order to separate periodic from aperiodic variable sources. We analyzed each light-curve
independently, considering a minimum of
ten available epochs taken from 1998 to June 2008,
for the temporal sampling in the light-curves. The parameter , was redefined in a very similar way as eq. 7 in (Rengstorf et al. 2006):
| (2) |
where the index , and are defined as in the previous subsection; the index correspond
to the number of 15-days intervals within the time series of observations of the star; and correspond to the number of observations
in each bin and the standard deviation of the magnitudes by bin in the light curve, respectively;
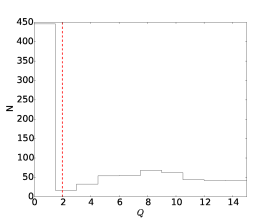
correspond to the total standard deviation of the magnitudes. Figure 1 shows the distribution for our pre-selected 1,931 variable sources. We found
1,481 sources, and 2 spectrally confirmed QSO from SDSS DR9, satisfying the condition of aperiodicity, that is ,
based in previous studies (Rengstorf et al. 2006), set to minimize contamination by likely periodic variables.
3.3 First-order of the structure function
So far, we have done a pre-selection of 1,481 sources identified as potential variable and aperiodic QSO in the CEVS.
Our final step, consist in identifying the location of QSO candidates in the plane ().
The first-order of the structure function, which quantify the variability amplitude
as a function of time, has been used used for this purpose. We computed an equivalent formulation, rewriting Eq. 3 in
Schmidt et al. (2010):
| (3) |
where is the measured magnitude difference between observation and , and
and are the photometric errors, being the time difference between
two observations. Thus, the average is taken over all epoch pairs , that falls in the bin . In the same way as Schmidt et al. (2010), we parametrized the structure function as:
| (4) |
where the subindex stands for filter, and can take the values, V, R, I, and:
| (5) |
and
| (6) |
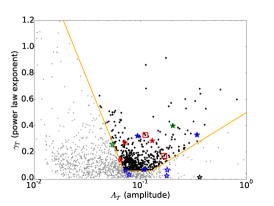
Figure 1 show the distribution and for the pre-selected 1,481 sources, and the best fitting values of Eq. (4) to Eq. (6) to the data.
We defined a QSO selection box as Eq. 7 to Eq. 9 in Schmidt et al. (2010), which led us to select a sample of 288 QSO candidates.
The final sample of candidates is shown in the Table 1, containing all the relevant information for each star in it: column 1-10 list ID (CEVS-QSO-XXX; notation adopted in this work), mean , and magnitudes, number of times each star was observed in each photometric band and amplitud. The index of variability and aperiodicity are presented in columns 11 and 12 respectively, and column 13 and 14, correspond to the parameters of the structure function ( and , respectively). Table 1 is published in its entirety in a public repository†††http://fernandez-trincado.github.io/Fernandez-Trincado/simulations.html‡‡‡jfernandez@obs-besancon.fr. A sample of the table is shown here for guidance regarding its content.
| ID | Nv | Nr | Ni | AmpV | AmpR | AmpI | Vindex | Q | |||||
|---|---|---|---|---|---|---|---|---|---|---|---|---|---|
| [mag] | [mag] | [mag] | [mag] | [mag] | [mag] | ||||||||
| CEVS-QSO-001 | 19.323 | 18.045 | 17.855 | 11 | 41 | 79 | 1.009 | 1.019 | 0.951 | 100.00 | 58.671 | 0.109 | 0.285 |
| CEVS-QSO-002 | 19.449 | 19.010 | 18.299 | 18 | 43 | 70 | 0.566 | 0.412 | 0.696 | 99.99 | 59.737 | 0.068 | 0.253 |
| CEVS-QSO-003 | 19.371 | 18.791 | 18.037 | 16 | 47 | 91 | 0.875 | 0.670 | 0.897 | 100.00 | 115.831 | 0.088 | 0.232 |
| CEVS-QSO-004 | 19.438 | 18.699 | 17.644 | 9 | 45 | 87 | 1.072 | 0.584 | 0.591 | 100.00 | 124.065 | 0.066 | 0.126 |
| CEVS-QSO-005 | 18.747 | 18.450 | 17.170 | 17 | 49 | 99 | 0.947 | 0.493 | 0.319 | 73.36 | 1243.269 | 0.049 | 0.425 |
| CEVS-QSO-006 | 19.182 | 17.886 | 16.372 | 26 | 52 | 90 | 0.455 | 0.454 | 0.357 | 100.00 | 986.204 | 0.341 | 0.329 |
| CEVS-QSO-007 | 19.505 | 18.916 | 18.172 | 3 | 32 | 36 | 0.431 | 0.508 | 0.517 | 99.72 | 28.757 | 0.115 | 0.071 |
| CEVS-QSO-008 | 18.999 | 18.545 | 17.540 | 30 | 50 | 78 | 0.703 | 1.012 | 0.607 | 91.33 | 54.579 | 0.062 | 0.346 |
| CEVS-QSO-009 | 19.632 | 18.743 | 17.851 | 14 | 43 | 69 | 0.563 | 0.569 | 0.561 | 99.99 | 6.741 | 0.132 | 0.467 |
4 Expected Milky Way contamination
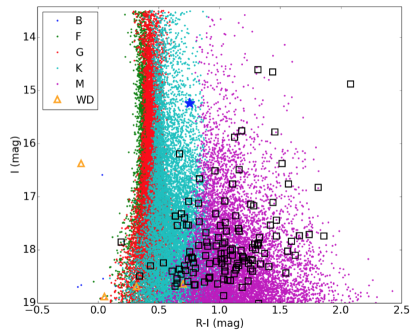
We have compared the synthetic colour-magnitude diagram computed with the Besançon galaxy model (hereafter BGM) (Robin et al. 2003, 2014), for the same line-of-sight and solid angle studied in this paper. The simulation was generated taking the selection function of the data into account. Since we are near the Galactic plane, we expect a high degree of contamination (foreground stars), not present in previous surveys of QSO using variability. The absence of a complete catalog of confirmed QSOs in this part of the Galaxy makes it difficult to estimate such contamination, a key point to validate our methodology and its application in future surveys like Gaia or VISTA. At this moment we are in the process of determining this contamination, since the CEVS is a not homogeneous survey. However we can do a simple and rough estimate of the more likely contaminants in our sample, namely K and M-type stars, using the BGM and comparing the synthetic colors with those observed in our sample candidates (see Figure 2).
5 Conclusion
In this work, we have used the multiepoch data in the large scale CEVS to search for low-galactic latitude QSOs by their intrinsic optical variability, using an alternative formulation
similar to the proposed in the literature, in order to detect QSO candidates from
inhomogeneous temporal sampling.
We have selected 288 QSO candidates according to their variability, aperiodicity and parameters
of the structure function, over an area of 2.5 deg2. Extrapolating these results
to the full CEVS with an total area of deg2, we estimate that is possible to detect 52,000 new QSO candidates in this survey. However, we have shown that the methods presented in this work
are sensitive to variations in the temporal sampling of the light curves. This
explains the fact our method rejects 95% of the QSO spectroscopically confirmed in the region
in common with the SDSS DR9 survey. Follow-up spectroscopic observations for our QSO candidates are currently conducted at the REOSC Spectrograph installed on the 2.15-m telescope at CASLEO, Argentina.
In the near future, large spectroscopic surveys as Gaia may help to confirm QSO sources, selected from variability surveys towards the Galactic plane, allowing us to quantify the selection efficiency.
Acknowledgements.
J.G.F-T is currently supported by Centre National d’Etudes Spatiales (CNES) through Ph.D grant 0101973 and the Région de Franche-Comté, and by the French Programme National de Cosmologie et Galaxies (PNCG). This research was supported by the Munich Institute for Astro- and Particle Physics (MIAPP) of the DFG cluster of excellence ”Origin and Structure of the Universe”. V.M. acknowledges the support from FONDECYT 1120741, and Centro de Astrofísica de Valparaiso.References
- Ahn et al. (2012) Ahn, C. P., Alexandroff, R., Allende Prieto, C., et al. 2012, ApJS, 203, 21
- Bauer et al. (2009) Bauer, A., Baltay, C., Coppi, P., et al. 2009, ApJ, 696, 1241
- Briceño et al. (2005) Briceño, C., Calvet, N., Hernández, J., et al. 2005, AJ, 129, 907
- Collier & Peterson (2001) Collier, S. & Peterson, B. M. 2001, ApJ, 555, 775
- Croom et al. (2001) Croom, S. M., Smith, R. J., Boyle, B. J., et al. 2001, MNRAS, 322, L29
- Downes et al. (2008) Downes, J. J., Briceño, C., Hernández, J., et al. 2008, AJ, 136, 51
- Drake et al. (2009) Drake, A. J., Djorgovski, S. G., Mahabal, A., et al. 2009, ApJ, 696, 870
- Graham et al. (2014) Graham, M. J., Djorgovski, S. G., Drake, A. J., et al. 2014, MNRAS, 439, 703
- Hall et al. (1996) Hall, P. B., Osmer, P. S., Green, R. F., Porter, A. C., & Warren, S. J. 1996, ApJ, 462, 614
- Hughes et al. (1992) Hughes, P. A., Aller, H. D., & Aller, M. F. 1992, ApJ, 396, 469
- Lynden-Bell (1969) Lynden-Bell, D. 1969, Nature, 223, 690
- MacLeod et al. (2012) MacLeod, C. L., Ivezić, Ž., Sesar, B., et al. 2012, ApJ, 753, 106
- Mateu et al. (2012) Mateu, C., Vivas, A. K., Downes, J. J., et al. 2012, MNRAS, 427, 3374
- Mignard (2012) Mignard, F. 2012, Mem. Soc. Astron. Italiana, 83, 918
- Morganson et al. (2014) Morganson, E., Burgett, W. S., Chambers, K. C., et al. 2014, ApJ, 784, 92
- Pichara et al. (2012) Pichara, K., Protopapas, P., Kim, D.-W., Marquette, J.-B., & Tisserand, P. 2012, MNRAS, 427, 1284
- Rees (1984) Rees, M. J. 1984, ARA&A, 22, 471
- Rengstorf et al. (2006) Rengstorf, A. W., Brunner, R. J., & Wilhite, B. C. 2006, AJ, 131, 1923
- Rengstorf et al. (2004a) Rengstorf, A. W., Mufson, S. L., Abad, C., et al. 2004a, ApJ, 606, 741
- Rengstorf et al. (2004b) Rengstorf, A. W., Mufson, S. L., Andrews, P., et al. 2004b, ApJ, 617, 184
- Rengstorf et al. (2009) Rengstorf, A. W., Thompson, D. L., Mufson, S. L., et al. 2009, ApJS, 181, 129
- Richards et al. (2002) Richards, G. T., Fan, X., Newberg, H. J., et al. 2002, AJ, 123, 2945
- Robin et al. (2003) Robin, A. C., Reylé, C., Derrière, S., & Picaud, S. 2003, A&A, 409, 523
- Robin et al. (2014) Robin, A. C., Reylé, C., Fliri, J., et al. 2014, A&A, 569, A13
- Ross et al. (2013) Ross, N. P., McGreer, I. D., White, M., et al. 2013, ApJ, 773, 14
- Salpeter (1964) Salpeter, E. E. 1964, ApJ, 140, 796
- Schmidt et al. (2010) Schmidt, K. B., Marshall, P. J., Rix, H.-W., et al. 2010, ApJ, 714, 1194
- Vivas et al. (2004) Vivas, A. K., Zinn, R., Abad, C., et al. 2004, AJ, 127, 1158
- Welsh et al. (2011) Welsh, B. Y., Wheatley, J. M., & Neil, J. D. 2011, A&A, 527, A15