The Ca ii triplet in red giant spectra: [Fe/H] determinations and the role of [Ca/Fe]
Abstract
Measurements are presented and analyzed of the strength of the Ca ii triplet lines in red giants in Galactic globular and open clusters, and in a sample of red giants in the LMC disk that have significantly different [Ca/Fe] abundance ratios to the Galactic objects. The Galactic objects are used to generate a calibration between Ca ii triplet line strength and [Fe/H], which is then used to estimate [Fe/H]CaT for the LMC stars. The values are then compared with the [Fe/H]spec determinations from high dispersion spectroscopy. After allowance for a small systematic offset the two abundance determinations are in excellent agreement. Further, as found in earlier studies (e.g., Battaglia et al., 2008), the difference is only a very weak function of the [Ca/Fe] ratio. For example, changing [Ca/Fe] from +0.3 to –0.2 causes the Ca ii based abundance to underestimate [Fe/H]spec by only 0.15 dex, assuming a Galactic calibration. Consequently, the Ca ii triplet approach to metallicity determinations can be used without significant bias to study stellar systems that have substantially different chemical evolution histories.
keywords:
(galaxies:) Magellanic Clouds; stars: abundances; stars: Population II; (Galaxy:) globular clusters: general; techniques: spectroscopic1 Introduction
The lines of the Ca ii triplet at 8498, 8542, and 8662Å are the strongest lines in the far-red spectral region in late-type red giant stars. As a result, measurements of the strength of these lines have been extensively used as a metallicity indicator in a variety of stellar systems. These include Galactic globular clusters (e.g., Armandroff & Da Costa, 1991; Da Costa & Armandroff, 1995; Rutledge et al., 1997; Saviane et al., 2012), Galactic open clusters (e.g., Cole et al., 2004; Warren & Cole, 2009; Carretta et al., 2009; Carrera et al., 2015) and stars in the Galactic Bulge (e.g., Vásquez et al., 2015). It has also been used to study both field stars and star clusters in the LMC (e.g., Olszewski et al., 1991; Cole et al., 2005; Carrera et al., 2008a) and SMC (e.g., Da Costa & Hatzidimitriou, 1998; Carrera et al., 2008b; Parisi et al., 2010; Dobbie et al., 2014; Parisi et al., 2015), as well as red giants in dwarf spheroidal (e.g., Armandroff & Da Costa, 1991; Pont et al., 2004; Tolstoy et al., 2004; Battaglia et al., 2008, 2011) and dwarf irregular galaxies (e.g., Leaman et al., 2013).
The calibration of the measured Ca ii line strengths is usually carried out by observing with the same instrument stars in systems whose abundances are known from another source. Usually, but not always, the calibration is carried out in terms of [Fe/H], which is adopted as a proxy for overall abundance. The alternative is to calibrate to [Ca/H] (e.g., Norris et al., 1996; Bosler et al., 2007) although naturally this requires knowledge of the [Ca/H] values for the calibration objects. The original studies concentrated primarily on metallicity determinations for relatively old and metal-poor systems. Subsequent work, however, has demonstrated that the influence of age on the technique is relatively small (Cole et al., 2004; Carrera et al., 2007), so that it can be applied to stellar systems with ages as young as 0.3 Gyr. The form of the metallicity calibration has also been investigated at both the metal-rich and metal-poor regimes. At higher metallicities, i.e., near solar and above, the form of the line strength calibration relation remains relatively linear (e.g., Vásquez et al., 2015), but as shown by Starkenburg et al. (2010) and Carrera et al. (2013), at metallicities below [Fe/H] –2.5 the relation between Ca ii triplet line strength and abundance becomes notably non-linear.
A question that remains relatively little explored, however, is the role of [Ca/Fe] – if the objects under study have very different [Ca/Fe] ratios from those in the calibrating objects, are the derived [Fe/H] values significantly biased? The answer to this question is important because, for example, low mass dwarf galaxies have a different chemical enrichment history to the halo and disk of the Galaxy, generally showing substantially lower [alpha/Fe] ratios compared to Galactic stars of similar [Fe/H] (e.g., Tolstoy et al., 2009).
Battaglia et al. (2008) investigated this question (see also Idiart et al., 1997; Carrera et al., 2007; Starkenburg et al., 2010) and found the effect of different [Ca/Fe] abundance ratios is relatively minor, but further studies of the issue are required. That then is the purpose of this paper – to investigate the influence of [Ca/Fe] on [Fe/H] determinations from the Ca ii method. This is achieved by developing a standard Ca ii line strength calibration using a number of Galactic calibrators, and then applying the calibration to Ca ii line strength measurements for red giants in the disk of the LMC. The LMC stars have been observed at high resolution so that both [Fe/H] and [Ca/Fe] values are available, allowing a direct comparison between the two abundance measures and an investigation of whether any differences are related to the [Ca/Fe] values.
The observations and data reduction techniques are discussed in the following section, along with an evaluation of the membership status of the cluster stars observed. In §3 the line strength analysis method adopted is presented, while in §4 the abundance calibration relation is derived. The results are then presented and discussed in the final section.
2 Observations and Reductions
The data for this study consist of observations of Galactic globular and open clusters, which are used to provide a calibration between Ca ii triplet line strength and abundance [Fe/H], and observations of a sample of red giants in the disk of the LMC orginally studied at high dispersion by Pompeia et al. (2008), and for which an updated analysis is available in Van der Swaelmen et al. (2013). All observations were carried out at the Anglo-Australian Telescope using the 2dF multi-object fibre positioner and the AAOmega dual beam spectrograph111Manuals and technical information at http://www.aao.gov.au/science/instruments/current/AAOmega. (Saunders et al., 2004; Sharp et al., 2006). The red arm of the spectrograph was configured with the 1700D grating centred at 8600Å to give coverage of the Ca ii triplet lines with a resolution R of approximately 10000. The corresponding blue spectra are not used in this work.
Five Galactic globular clusters (NGC 104 (47 Tuc), 288, 1904, 2298 and 7099 (M30)) and two Galactic open clusters (Melotte 66 and M67) were observed over a number of different nights as parts of other programs, usually when conditions were not optimal for the main program. The LMC disk field was observed as part of a larger program concentrating on the LMC. Details of the observations of the Galactic calibrators and the LMC disk field are given Table 1.
For the globular clusters the input catalogues to the fibre allocation software were drawn initially from the position and photometry information available in the photometric standard star fields database maintained by Stetson222http://www3.cadc-ccda.hia-iha.nrc-cnrc.gc.ca/community/STETSON/standards/. Stars brighter than the horizontal branch on both the red giant (RGB) and asymptotic giant branches (AGB) were selected with final positions sourced from the UCAC4 catalogue (Zacharias et al., 2013). For Melotte 66 candidate red giants at the magnitude of the red clump and brighter were selected from the photometry of Anthony-Twarog et al. (1994) with positions again sourced from the UCAC4 catalogue. The Stetson photometry and position information were also used as the initial source for the open cluster M67. Here, given the sparseness of the giant branch, the input catalogue included 3 red clump stars as well as 2 additional bright red giant members that lack Stetson photometry. Positions were again taken from the UCAC4 catalogue.
| Target | Date | Exposure (sec) |
|---|---|---|
| NGC 104 (47 Tuc) | 2011 Oct 30 | 3 600 |
| NGC 288 | 2011 Oct 31 | 3 1200 |
| NGC 1904 | 2011 Oct 31 | 3 1000 |
| NGC 2298 | 2011 Oct 30 | 3 1000 |
| NGC 7099 (M30) | 2011 Oct 31 | 2 1200 |
| Melotte 66 | 2011 Nov 01 | 3 1000 |
| M67 | 2010 Dec 29 | 3 300 |
| LMC Disk | 2010 Dec 28 | 2 1800 |
The observations were reduced with the 2dF data reduction pipeline 2dfdr333http://www.aao.gov.au/science/software/2dfdr using the standard approach in which fibre flat-field exposures set the location of the fibres on the detector and arc-lamp exposures provide the wavelength calibration. Sky subtraction was achieved using the skyflux(med) approach, in which the relative throughputs of the fibres are determined from the observed intensities of night-sky emission lines present in the raw spectra. The wavelength-calibrated sky-subtracted spectra from the individual integrations were then combined to remove cosmic ray contamination. Final signal-to-noise ratios were generally excellent (50 pixel-1) for the spectra of the Galactic objects but are much lower (15–20 pixel-1) for the LMC disk stars because of the fainter magnitudes and poorer seeing (FWHM 2′′) during the observations. Fig. 1 shows two example spectra – a red giant in the globular cluster NGC 288 and a LMC disk star.

2.1 Globular Cluster Membership
Two approaches were used to determine the membership status for the stars observed in the Galactic globular clusters. The first involved measuring the radial velocities of the stars to detect any radial velocity non-members. The radial velocities were determined from the observed wavelengths of the Ca ii triplet lines using the IRAF444Information and distribution for IRAF is available through http://iraf.noao.edu/. routine rvidlines. The observed velocities were corrected to heliocentric values and then compared to the mean cluster velocities tabulated in the 2010 on-line version555http://physwww.mcmaster.ca/harris/mwgc.dat of the Harris (1996) catalogue666Hereafter all references to the Harris (1996) catalogue refer to the 2010 on-line version. and likely non-members flagged. The precision of radial velocities observed with this instrumental setup is 2 km s-1 or better for spectra with good signal-to-noise (e.g., Da Costa, 2012) making membership discrimination straightforward. For the 5 globular clusters the numbers of radial velocity non-members in the observed samples were 2 (47 Tuc), 4 (NGC 288), 8 (NGC 1904), 8 (NGC 2298) and 1 (NGC 7099).
The second approach relies on the reasonable assumption that the stars in each cluster have approximately the same overall abundance so that there should be a monotonic relationship between the measured strength of the Ca ii lines and a luminosity indicator such as (), where is the apparent magnitude of the horizontal branch as given in the Harris (1996) catalogue. The measurement of the Ca ii line strengths is described in the following section, here we are only interested in stars that do not follow the relation exhibited by the majority of the cluster stars. Such stars are classified as line strength non-members. For the cluster samples observed here only three 47 Tuc stars were classified as line strength non-members. The final mean cluster radial velocities and the number of members are given in Table 2. The agreement with the velocities tabulated by Harris (1996) is excellent – the largest difference is for NGC 2298 where the value determined here is 146.2 0.6 km s-1 while Harris (1996) lists 148.9 1.2 km s-1.
| Target | Na | Radial Velocity |
|---|---|---|
| km s-1 | ||
| NGC 104 (47 Tuc) | 64 | –18.2 0.9 |
| NGC 288 | 40 | –45.1 0.4 |
| NGC 1904 | 22 | 205.9 0.7 |
| NGC 2298 | 12 | 146.2 0.6 |
| NGC 7099 (M30) | 25 | –184.3 0.5 |
| Melotte 66 | 17 | 19.8 0.9 |
| M67 | 10 | 32.5 0.5 |
a Number of cluster members, including both RGB and AGB
stars for 47 Tuc, NGC 288 and NGC 1904.
An additional pair of points can be made concerning the globular cluster samples. First, TiO bands are clearly present in the spectra of the most luminous stars in the cluster 47 Tuc. The presence of TiO depresses the local continuum against which the line strengths are measured (see §3) leading to anomalously low line strengths. As a result the 4 brightest stars in the 47 Tuc sample, all of which have –2.10, have been excluded from further analysis. The onset of the effects of TiO is, at least in , quite rapid as the next most luminous 47 Tuc red giant observed, which has = –2.04, is clearly unaffected. This is not surprising as the colour-magnitude diagram (CMD) for the cluster shows that the magnitudes are decreasing only slowly near the RGB-tip while the colours become substantially redder (see Fig. 2).
The second point relates to the presence of AGB stars in the observed samples. In the cluster CMDs, given the exquisite precision of the Stetson photometry, AGB stars are readily separated from the RGB. The AGB stars are brighter than the RGB at the same colour, or equivalently at the same , the AGB stars are bluer (hotter). The effect is that at a given , the AGB stars have a lower line strength compared to the RGB stars. This is illustrated in Fig. 2 which shows the CMD for the 47 Tuc cluster members in the upper panel and the (Ca ii line strength, ) diagram the lower panel. The AGB stars lie systematically below the RGB stars at the same value, in this case by 0.16Å. Consequently, we have excluded the AGB stars observed from the 47 Tuc, NGC 288 and NGC 1904 samples; no AGB stars were included in the NGC 2298 and M30 samples.

2.2 Melotte 66 and M67 membership
For Melotte 66 a sample of 20 stars were observed. Two stars were immediately identified as non-members on the basis of discrepant radial velocities. Nine of the remaining stars are classified as cluster members in Cole et al. (2004), a categorization consistent with the velocities and line strengths derived here. As for the balance of the sample, eight of the nine stars also have velocities and line strengths consistent with membership. The final star is Mel66-W1580 (WEBDA id number), which Sestito et al. (2008) indicate is a fast rotator. The radial velocity determined here is 50.9 2.0 km while that given by Carlberg (2014) is –14 17 km ; the star is probably a binary. It has not been considered further. The mean velocity of the 17 stars classified as members is 19.8 0.9 km s-1 (std error of mean) which agrees well with the values of 20.7 0.6 and 22.1 0.9 km s-1 given by Sestito et al. (2008) and Carlberg (2014), respectively.
The ten M67 stars observed are all known to be cluster members and the current data support that classification. The mean radial velocity for these stars is 32.5 0.5 km s-1 which is in excellent agreement with other determinations. For example, Carlberg (2014) give the cluster radial velocity as 33.1 0.6 km s-1. Six of the stars were also observed by Cole et al. (2004).
2.3 The LMC disk stars
The 2df configuration software allowed 57 of the 59 stars in the Pompeia et al. (2008) sample to be observed. Unfortunately a CCD bad column fell exactly on the 8662Å line for star 1118-LMCDisc01 (using the naming convention of Van der Swaelmen et al. (2013) – this is star RGB_1118 in the Pompeia et al. (2008) list) and thus the spectrum of this star could not be used in the analysis. The seeing during the observations varied from FWHM 1.5′′ to 2.5′′ leading to the possibility of contamination of the individual stellar spectra by neighbouring stars, given the 2dF fibre diameter of 2′′ and the crowded nature of the LMC disk field. As a result, only those stars whose observed radial velocity agreed well with that given by Pompeia et al. (2008) were retained. There are 33 such stars and for this sample the mean difference in radial velocity () is 0.4 km s-1 with a standard deviation of 2.9 km s-1. A further cut on the sample was applied by requiring the signal-to-noise to exceed 15 per pixel in the predominantly continuum region between the stronger pair of Ca ii lines. This left a final sample of 32 LMC disk stars for analysis.
3 Line Strength Analysis
The strengths of the 8542Å and 8662Å lines of the Ca ii triplet were measured on all the spectra using feature and continuum band passes identical to those specified originally in Armandroff & Da Costa (1991). Unlike that work, however, which fitted gaussians to the line profiles, the psuedo equivalent widths were determined by fitting a gaussian plus lorentzian function using a procedure similar to that described in Cole et al. (2004). The equivalent widths were then summed to form the line strength index W and the values for the cluster member stars plotted against . The values for the globular clusters were taken from the Harris (1996) catalogue while for Melotte 66 and M67, was taken as the mean magnitude of the red clump in the CMDs using the photometry sources cited above.
As is now well-established (e.g., Armandroff & Da Costa, 1991; Rutledge et al., 1997; Carrera et al., 2007; Saviane et al., 2012) for red giants brighter than approximately the magnitude of the horizontal branch, and for the metallicity range covered by the calibration objects, the slope of the relation between W and is essentially independent of metallicity. Consequently, the weighted average of the slopes of the least squares fits to the individual cluster data was calculated, and then refit to the individual data sets. The average slope found was –0.660 0.016 Åmag-1 which is consistent with other determinations of this parameter; e.g., Saviane et al. (2012) found a value of –0.627 Åmag-1.
In Fig. 3 the individual W values are plotted against for each of the Galactic calibration clusters. The rms deviation about the fitted lines lie in the range 0.11 – 0.15 Å, which is consistent with the measurement errors in the W values. An independent check is provided by a comparison with the values, denoted by WCole, given in Cole et al. (2004) for the 15 Melotte 66 and M67 stars in common, bearing in mind that Cole et al. (2004) used the sum of all three Ca ii lines rather than just the sum of the strongest two. For 14 of the 15 stars there is an excellent correlation between the two data sets:
| (1) |
The rms about the relation is 0.15Å, which suggests the W errors are of order 0.11Å in both data sets, which have excellent signal-to-noise values. The one discrepant star is W2236 in Melotte 66 for which the listed WCole value is 0.7 Å (9%) weaker than the value predicted from the measurement here and equation 1. Since the value measured here is consistent with the other Melotte 66 stars in Fig. 3 the star has been retained. The identifications, positions, magnitudes, W(8542) and W(8662) line strengths, and heliocentric radial velocities for all the cluster stars contributing to Fig. 3 are given in the associated on-line material. Table 3 outlines the format of the data file.
| Star ID | RA(J2000) | Dec(J2000) | W(8542) | W(8662) | Radial Velocity | |
|---|---|---|---|---|---|---|
| (Å) | (Å) | km s-1 | ||||
| M67-IV-202 | 08 50 12.30 | +11 51 24.5 | 8.84 | 4.29 | 3.36 | 32.3 |
| M67-T626 | 08 51 20.10 | +12 18 10.4 | 9.36 | 4.05 | 3.19 | 33.5 |
| M67-F170 | 08 51 29.91 | +11 47 16.8 | 9.64 | 3.77 | 2.98 | 33.6 |
| M67-F108 | 08 51 17.48 | +11 45 22.7 | 9.69 | 3.84 | 3.06 | 33.4 |
| M67-F105 | 08 51 17.10 | +11 48 16.1 | 10.29 | 3.60 | 2.85 | 33.0 |
a The full Table is available in the associated on-line material. This version outlines the format of the data file.
Because of the lack of dependence on metallicity of the slope of the relations shown in Fig. 3, the information for each cluster can be reduced to a single parameter, the reduced equivalent width , which is defined as the value of W at = 0. We now explore the relation between and [Fe/H] for these Galactic calibration objects, noting that the uncertainties in the values are small: they range between 0.02 and 0.05 Å.

4 Abundance Calibration
In the upper panel of Fig. 4 the value of for each Galactic calibration object is plotted against the adopted [Fe/H] value. For the globular clusters the [Fe/H] values are taken from Appendix I of Carretta et al. (2009) where the tabulated abundances can be traced back to a consistent set of high dispersion analyses of red giants in a number of clusters (Carretta et al., 2009). For the open clusters Melotte 66 and M67 the results of high dispersion studies have also been adopted: that of Sestito et al. (2008) who find [Fe/H] = –0.33 0.03 for Melotte 66, and that of Yong et al. (2005) who find [Fe/H] = +0.02 0.08 for M67. A linear least squares fit to the (, [Fe/H]) data points is also shown in the Figure. This fit is given by the equation:
| (2) |
with the rms about the fit being 0.06 dex. There is no convincing indication of any deviation from linearity within the range for which the equation is valid: –2.4 [Fe/H] +0.1 dex, although as noted by Starkenburg et al. (2010) and Carrera et al. (2013) a linear relation ceases to be appropriate in the extremely metal-poor regime.
It is of interest to compare this calibration with other recent determinations. For example, Saviane et al. (2012) used essentially identical measurement and analysis techniques as those employed here to determine values for a number of Galactic globular clusters from samples of red giants observed with the FORS2 multi-object spectrograph. Although there are no clusters in common, the similarity in approach suggests that the values for the calibration clusters in Saviane et al. (2012) should be directly analogous to those measured here. The lower panel of Fig. 4 shows these values again plotted against [Fe/H] values from Carretta et al. (2009). Saviane et al. (2012) adopted a cubic calibration relation and that is also shown on the Figure. In general there is quite reasonable agreement between this work and that of Saviane et al. (2012) for the clusters less metal-rich than [Fe/H] –0.8 dex (i.e., 47 Tuc and M71) but the more metal-rich clusters in Saviane et al. (2012), particularly NGC 5927 and NGC 6528, have notably smaller values than would be expected for their abundances and the linear calibration given in equation 2, necessitating the cubic calibration relation. It is not at all clear why these metal-rich clusters differ from the location of old open clusters with similar metallicities, although small sample sizes (e.g., 4 stars in NGC 5927 and 7 in NGC 6528) combined with significant differential reddening may play a role (see also the discussion in Saviane et al., 2012) . Other calibrations such as those of Cole et al. (2004), Carrera et al. (2007) and Warren & Cole (2009), for example, that have employed old open clusters for the metal-rich part of the calibration, generally find linear relations analogous to equation 2. We further note that if we use the clusters Melotte 66, 47 Tuc, NGC 288, 1904, 2298, 4590 and 7078 to establish a linear relationship between as measured here or in Saviane et al. (2012), and as given by Carrera et al. (2007), then the relationship is well defined with an rms dispersion of only 0.09 Å. If we then use that relationship to convert the values for NGC 5927 and NGC 6528 given by Carrera et al. (2007) to the scale used here, then the resulting values of 5.94 and 6.33 Å, respectively, are much closer to the calibration defined by equation 2. As further support we note that the recent calibration presented by Vásquez et al. (2015), which is shown as the dot-dash line in the lower panel of Fig. 4, is also consistent with that adopted here.

5 Results and Discussion
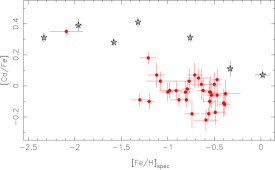
In Fig. 5 we illustrate the issue under investigation by plotting [Ca/Fe] abundance ratios against [Fe/H]spec777The subscript spec is used to denote [Fe/H] determinations based on high dispersion analyses. for the Galactic calibration objects and for the 32 LMC disk red giants observed here that pass the radial velocity and S/N checks. For the globular clusters the [Ca/Fe] values are taken from the high resolution study of Carretta et al. (2010) for NGC 7099, 1904, 288 and 47 Tuc, while that for NGC 2298 comes from McWilliam et al. (1992), which is also based on high dispersion spectroscopic data. The [Ca/Fe] values for Melotte 66 and M67 come from the high dispersion analyses of Sestito et al. (2008) and Yong et al. (2005), respectively. The abundances, abundance ratios, and their uncertainties for the LMC disk red giants are taken directly from Van der Swaelmen et al. (2013). The LMC sample used here has a median [Fe/H]spec of –0.69 and a median [Ca/Fe] of –0.04 dex. At this [Fe/H]spec value the Galactic calibration objects typically have [Ca/Fe] ratios that are approximately 0.3 dex higher.
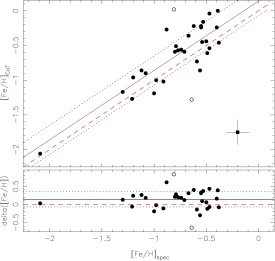
In order to derive [Fe/H] values for the LMC stars using the calibration developed here, i.e., via equation 2, we proceed as follows. The magnitudes of the LMC disk giants observed by Pompeia et al. (2008) are available on-line888http://cdsarc.u-strasbg.fr/viz-bin/Cat?J/A%2bA/480/379, while Cole et al. (2000) list the mean magnitude of the red clump in this LMC disk field as = 19.26. Adopting this value as then allows us to correct the measured W for each LMC star to the equivalent value, which can then be used with equation 2 to derive abundance values. These are denoted by [Fe/H]CaT. Fig. 6 shows the outcome of this process – the upper panel plots [Fe/H]CaT against [Fe/H]spec while the lower panel shows the difference ([Fe/H]CaT – [Fe/H]spec) against [Fe/H]spec for the 32 LMC disk red giants. The two [Fe/H] determinations are clearly well-correlated but equally clearly a systematic offset is present. After removing two stars that are more than 2 discrepant, the mean difference for the remaining 30 stars is 0.14 dex, in the sense that the [Fe/H]CaT is more metal-rich, with a standard deviation of 0.21 dex. The standard deviation is consistent with that expected from the errors: [Fe/H]spec = 0.11 dex (Van der Swaelmen et al., 2013) combined with a typical error in W for the LMC stars of 0.3 Å and the calibration uncertainty of 0.06 dex. Further, as is apparent in the lower panel of Fig. 6, aside from the offset between the two measures there is no evidence for any systematic dependence of the difference on [Fe/H]spec, indicating that the abundance scales are consistent. This is not unexpected since both scales ultimately depend on high dispersion spectroscopic analyses but is reassuring nevertheless. The result here contrasts with that in Van der Swaelmen et al. (2013) where, above [Fe/H]spec –0.5, there is an increasing difference between the [Fe/H]spec values and the [Fe/H]CaT values from Cole et al. (2005). The sense is that the [Fe/H]CaT values become more metal-rich.
As for the systematic offset between the abundance values found here, it most likely has a straightforward explanation, one already anticipated to some extent by, for example, Da Costa & Hatzidimitriou (1998) and Carrera et al. (2007). Using the reddening for the LMC disk field given by Van der Swaelmen et al. (2013), E = 0.12 mag, and an LMC distance modulus (m-M)0 of 18.50 (Pietrzynski et al., 2013), the adopted LMC value of 19.26 corresponds to = 0.38 – a value that is 0.4 mag brighter than the red clump stars in Melotte 66 or M67, for example, which have 0.8. If a value of value of 19.66 had been used instead for the LMC stars, then the resulting metallicities would have been lower by 0.4 0.66 0.528 = 0.14 dex, precisely the offset seen. This reinforces the result that the abundance scale used in the calibration of the Ca ii line strengths is in excellent agreement with direct [Fe/H] determinations via high dispersion spectroscopy.
It also suggests that the approach advocated by Carrera et al. (2007, 2013), where or is used in place of , may be prefereable in situations where there is a large age range, or a dominant younger population, present, as is the case here. In particular, as noted by Carrera et al. (2007), in systems like the disk of the LMC where there has been extensive on-going star formation, the magnitude of the old core-helium burning stars, i.e., , is often not well defined as the red clump region of the CMD is dominated by more luminous younger stars. In such situations, however, the distance modulus is often well established, e.g., via Cepheids, and thus the absolute magnitude is known more precisely than (see also Pont et al., 2004).
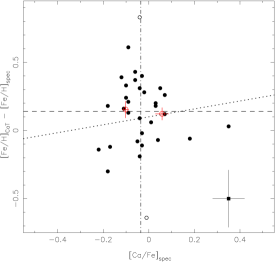
Turning now to the role of [Ca/Fe], we show in Fig. 7 the relation between the difference [Fe/H]CaT – [Fe/H]spec and [Ca/Fe] for the 32 LMC disk red giants. If the [Ca/Fe] abundance ratio plays a significant role in influencing the overall abundance estimated from the Ca ii line strengths, then a positive correlation is expected in this diagram – the abundance from the Ca ii triplet line strength and the Galactic calibration should underestimate [Fe/H]spec when the [Ca/Fe] value is low compared to the calibrators. While the standard deviation of the abundance differences is sizeable, the data in Fig. 7 demonstrate little compelling evidence for any significant dependence of the abundance difference on the [Ca/Fe] abundance ratio. In particular, if the data are separated into two sub-samples, one containing the 17 stars with [Ca/Fe] less than the overall mean, and one with the 13 stars where the [Ca/Fe] exceeds the overall mean, then the mean abundance differences for these two sub-samples do not differ. While better signal-to-noise spectra at the Ca ii triplet for this sample of stars may have allowed tighter constraints, the data of Fig. 7 indicate that the effect on [Fe/H]CaT of [Ca/Fe] is relatively limited – at most a 0.2 dex underestimate when [Ca/Fe] is substantially below the solar value.
In many respects the results presented here are a confirmation of those presented in Battaglia et al. (2008) who also found little indication of any substantial dependence of [Fe/H]CaT on [Ca/Fe]. In their work Battaglia et al. (2008) obtained moderate resolution spectra at the Ca ii triplet, as well as high dispersion spectroscopy, for a large sample of red giants in the Sculptor and Fornax dwarf Spheroidal galaxies. The high dispersion results were used to directly calibrate the Ca ii triplet line strengths in terms of [Fe/H]spec. Fig. 8 shows their data presented in the same way as for Fig. 7. Not surprisingly given the calibration process used, there is a negligible offset between [Fe/H]CaT and [Fe/H]spec: formally for the 125 stars in the combined Sculptor and Fornax samples, the mean difference [Fe/H]CaT – [Fe/H]spec is –0.04 with a standard deviation of 0.11 dex. Again there is little evidence for any substantial dependence on [Ca/Fe] – as for Fig. 7, the change in [Fe/H]CaT – [Fe/H]spec over the full range of [Ca/Fe] observed is relatively small, of order 0.2 dex. A least squares fit to the data points in Fig. 8 yields the following equation:
| (3) |
The correlation coefficient from the least squares fit is 0.377 indicating that the null hypothesis, namely that the data points are uncorrelated, can be ruled out with a high degree of significance. In other words, there is a genuine dependence of the abundance difference on [Ca/Fe]. As regards the slope of the relation, applying a bootstrap resampling process (e.g., Wall & Jenkins, 2012) with 1000 trials to the 125 ([Fe/H], [Ca/Fe]) pairs shown in Fig. 8, yields a mean slope of 0.276 dex/dex, entirely consistent with that in equation 3. The relation from equation 3 is also shown in Fig. 7, after allowing for the 0.14 dex abundance offset, and is clearly compatible with the LMC results derived here. Indeed a slope of 0.3 lies within the inter-quartile range of those derived from the data in Fig. 7 in a similar bootstrap resampling analysis.
In summary, a change [Ca/Fe] from a typical Galactic value of +0.3 to a value of –0.2 typical of those seen in the LMC and dwarf spheroidal galaxies will result, assuming the use of Galactic calibrators, in an underestimate of the true [Fe/H] value by 0.15 dex when using the Ca ii triplet method to estimate the overall abundance. Since effects of this size are frequently less than the random error in the abundance determinations via the Ca ii triplet method for red giants in relatively distant dwarf galaxies (e.g., Leaman et al., 2013), where the chemical evolution history is generally unknown, the results here reaffirm that the Ca ii triplet approach can be used in the knowledge that the outcomes are not significantly affected by ignorance of the actual [Ca/Fe] abundance ratios.

Acknowledgements
The author would like to acknowledge research support from the Australian Research Council through Discovery Grant programs DP120101237 and DP150103294. He is also grateful for the support received during an extended visit to the Institute for Astronomy, University of Edinburgh during which this paper was largely written. Thanks also to Ken Freeman, Russell Cannon and Elizabeth Maunder who conducted the 2010 December observations, and to Andrew Cole for providing a copy of the line profile fitting code (whose heritage can be traced back to that of Armandroff & Da Costa “plus ça change, plus c’est la même chose”). This research has made use of the WEBDA database, operated at the Institute for Astronomy of the University of Vienna, and of the VizieR catalogue access tool, CDS, Strasbourg, France. The original description of the VizieR service was published in A&AS 143, 23.
References
- Anthony-Twarog et al. (1994) Anthony-Twarog, B. J., Twarog, B. A., Sheeran, M., 1994, PASP, 106, 486
- Armandroff & Da Costa (1991) Armandroff, T. E., Da Costa, G. S., 1991, AJ, 101, 1329
- Battaglia et al. (2008) Battaglia, G., Irwin, M., Tolstoy, E., Hill, V., Helmi, A., Letarte, B., Jablonka, P., 2008, MNRAS, 383, 183
- Battaglia et al. (2011) Battaglia, G., Tolstoy, E., Helmi, A., Irwin, M., Parisi, P., Hill, V., Jablonka, P., 2011, MNRAS, 411, 1013
- Bosler et al. (2007) Bosler, T. L., Smecker-Hane, T. A., Stetson, P. B., 2007, MNRAS, 378, 318
- Carlberg (2014) Carlberg, J. K., 2014, AJ, 147, 138
- Carrera et al. (2007) Carrera, R., Gallart, C., Pancino, E., Zinn, R., 2007, AJ, 134, 1298
- Carrera et al. (2008a) Carrera, R., Gallart, C., Hardy, E., Aparicio, A., Zinn, R., 2008a, AJ, 135, 836
- Carrera et al. (2008b) Carrera, R., Gallart, C., Aparicio, A., Costa, E., Méndez, R. A., Noël, N. E. D., 2008b, AJ, 136, 1039
- Carretta et al. (2009) Carretta, E., Bragaglia, A., Gratton, R., D’Orazi, V., Lucatello, S., 2009, A&A, 508, 695
- Carretta et al. (2010) Carretta, E., Bragaglia, A., Gratton, R., Lucatello, S., Bellazzini, M., D’Orazi, V., 2010, ApJ, 712, L21
- Carrera et al. (2013) Carrera, R., Pancino, E., Gallart, C., del Pino, A., 2013, MNRAS, 434, 1681
- Carrera et al. (2015) Carrera, R., Casamiquela, L., Ospina, N., Balaguer-Núñez, L., Jordi, C., Monteagudo, L., 2015, A&A, 578, A27
- Cole et al. (2000) Cole, A. A., Smecker-Hane, T. A., Gallagher, J. S., 2000, AJ, 120, 1808
- Cole et al. (2004) Cole, A. A., Smecker-Hane, T. A., Tolstoy, E., Bosler, T. L., Gallagher, J. S., 2004, MNRAS, 347, 367
- Cole et al. (2005) Cole, A. A., Tolstoy, E., Gallagher, J. S., Smecker-Hane, T. A., 2005, AJ, 129, 1465
- Da Costa (2012) Da Costa, G. S., 2012, ApJ, 751, 6
- Da Costa & Armandroff (1995) Da Costa, G. S., Armandroff, T. E., 1995, AJ, 109, 2533
- Da Costa & Hatzidimitriou (1998) Da Costa, G. S., Hatzidimitriou, D., 1998, AJ, 115, 1934
- Dobbie et al. (2014) Dobbie, P. D., Cole, A. A., Subramaniam, A., Keller, S., 2014, MNRAS, 442, 1680
- Harris (1996) Harris, W. E., 1996, AJ, 112, 1487
- Idiart et al. (1997) Idiart, T. P., Thevenin, F., de Freitas Pacheco, J. A., 1997, AJ, 113, 1066
- Leaman et al. (2013) Leaman, R., Venn, K. A., Brooks, A. M., Battaglia, G., Cole, A. A., et al., 2013, ApJ, 767, 131
- McWilliam et al. (1992) McWilliam, A., Geisler, D., Rich, R. M., 1992, PASP, 104, 1193
- Norris et al. (1996) Norris, J. E., Freeman, K. C., Mighell, K. J., 1996, ApJ, 462, 241
- Olszewski et al. (1991) Olszweski, E. W., Schommer, R. A., Suntzeff, N. B., Harris, H. C., 1991, AJ, 101, 515
- Parisi et al. (2010) Parisi, M. C., Geisler, D., Grocholski, A. J., Clariá, J. J., Sarajedini, A., 2010, AJ, 139, 1168
- Parisi et al. (2015) Parisi, M. C., Geisler, D.; Clariá, J. J., Villanova, S., Marcionni, N., Sarajedini, A., Grocholski, A. J., 2015, AJ, 149, 154
- Pietrzynski et al. (2013) Pietrzynski, G., Graczyk, D., Gieren, W., Thompson, I. B., Pilecki, B., et al., 2013, Nature, 496, 76
- Pompeia et al. (2008) Pompéia, L., Hill, V., Spite, M., Cole, A., Primas, F., Romaniello, M., Pasquini, L., Cioni, M.-R., Smecker-Hane, T., 2008, A&A, 480, 379
- Pont et al. (2004) Pont, F., Zinn, R., Gallart, C., Hardy, E., Winnick, R., 2004, AJ, 127, 840
- Rutledge et al. (1997) Rutledge, G. A., Hesser, J. E., Stetson, P. B., Mateo, M., Simard, L., Bolte, M., Friel, E. D., Copin, Y., 1997, PASP, 109, 883
- Saunders et al. (2004) Saunders, W., Gillingham, P., Haynes, R., et al., 2004, Proc. SPIE, 5492, 389
- Saviane et al. (2012) Saviane, I., Da Costa, G. S., Held, E. V., et al., 2012, A&A, 540, A27
- Sestito et al. (2008) Sestito, P., Bragaglia, A., Randich, S., Pallavicini, R., Andrievsky, S. M., Korotin, S. A., 2008, A&A, 488, 943
- Sharp et al. (2006) Sharp, R., Saunders, W., & Smith, G., et al., 2006, Proc. SPIE, 6269, 62690G
- Starkenburg et al. (2010) Starkenburg, E., Hill, V., Tolstoy, E., González Hernández, J. I., Irwin, M., Helmi, A., et al., 2010, A&A, 513, A34
- Tolstoy et al. (2004) Tolstoy, E., Irwin, M. J., Helmi, A., Battaglia, G., et al., 2004, ApJ, 617, L119
- Tolstoy et al. (2009) Tolstoy, E., Hill, V., Tosi, M., 2009, ARA&A, 47, 371
- Van der Swaelmen et al. (2013) Van der Swaelmen, M., Hill, V., Primas, F., Cole, A. A., 2013, A&A, 560, A44
- Vásquez et al. (2015) Vásquez, S., Zoccali, M., Hill, V., Gonzalez, O. A., Saviane, I., Rejkuba, M., Battaglia, G., 2015, A&A, 580, A121
- Wall & Jenkins (2012) Wall, J. V., Jenkins, C. R., 2012, Practical Statistics for Astronomers, 2nd edition, Cambridge Univ. Press, Cambridge, UK
- Warren & Cole (2009) Warren, S. R., Cole, A. A., 2009, MNRAS, 393, 272
- Yong et al. (2005) Yong, D., Carney, B. W., Teixera de Almeida, M. L., 2005, AJ, 130, 597
- Zacharias et al. (2013) Zacharias, N., Finch, C. T., Girard, T. M., Henden, A., Bartlett, J. L., Monet, D. G., Zacharias, M. I., 2013, AJ, 145, 44