Can pair-instability supernova models match
the observations of superluminous supernovae?
Abstract
An increasing number of so-called superluminous supernovae (SLSNe) are discovered. It is believed that at least some of them with slowly fading light curves originate in stellar explosions induced by the pair instability mechanism. Recent stellar evolution models naturally predict pair instability supernovae (PISNe) from very massive stars at wide range of metallicities (up to , Yusof et al. 2013). In the scope of this study we analyse whether PISN models can match the observational properties of SLSNe with various light curve shapes. Specifically, we explore the influence of different degrees of macroscopic chemical mixing in PISN explosive products on the resulting observational properties. We artificially apply mixing to the 250 PISN evolutionary model from Kozyreva et al. (2014) and explore its supernova evolution with the one-dimensional radiation hydrodynamics code STELLA. The greatest success in matching SLSN observations is achieved in the case of an extreme macroscopic mixing, where all radioactive material is ejected into the hydrogen-helium outer layer. Such an extreme macroscopic redistribution of chemicals produces events with faster light curves with high photospheric temperatures and high photospheric velocities. These properties fit a wider range of SLSNe than non-mixed PISN model. Our mixed models match the light curves, colour temperature and photospheric velocity evolution of two well-observed SLSNe PTF12dam and LSQ12dlf. However, these models’ extreme chemical redistribution may be hard to realise in massive PISNe. Therefore, alternative models such as the magnetar mechanism or wind-interaction may still to be favourable to interpret rapidly rising SLSNe.
keywords:
pair-instability supernovae – super-luminous supernovae – PTF12dam – LSQ12dlf1 Introduction
Thanks to the launch of an increasing number of supernova surveys, the number of superluminous supernovae (hereafter, SLSNe; see Gal-Yam (2012) for a review) grows (see e.g., Gal-Yam et al., 2009; Quimby et al., 2011; Cooke et al., 2012; Benetti et al., 2014; McCrum et al., 2014; Nicholl et al., 2014, 2015). The extreme property for all of them is high peak luminosity, and many show blue featureless spectra at the discovery. Some of them have slow decline, while others have more rapid decline.
There are three possible mechanisms currently suggested for SLSNe. These are (1) central engine, such as magnetar or accreting black hole (see e.g., Mazzali et al., 2006; Woosley, 2010; Kasen & Bildsten, 2010; Dexter & Kasen, 2013), (2) interaction-powered mechanism (Chevalier & Irwin, 2011; Ginzburg & Balberg, 2012; Moriya et al., 2013; Baklanov et al., 2015), and (3) nickel-powered mechanism (Gal-Yam et al., 2009; Moriya et al., 2010; Gal-Yam, 2012). In the current paper we focus on supernovae powered by radioactive nickel-cobalt decay, which occurs in pair instability supernovae (hereafter, PISNe).
Stars with initial masses above 150 definitely exist in the visible Universe (Schnurr et al., 2008; Crowther et al., 2010; Schneider et al., 2014). Their evolution is fairly clear and successfully reproduced by stellar evolution simulations (Fowler & Hoyle, 1964; Bisnovatyi-Kogan & Kazhdan, 1967; Rakavy & Shaviv, 1967; Barkat et al., 1967; Fraley, 1968; El Eid & Langer, 1986; Heger & Woosley, 2002; Umeda & Nomoto, 2002; Langer et al., 2007; Chatzopoulos & Wheeler, 2012; Yusof et al., 2013; Kozyreva et al., 2014b, and others). Many of these studies predict that these stars form massive oxygen core (above 60 ) which eventually explodes due to pair creation instability mechanism. In theory, explosions of these very massive stars should be detected among other supernova explosions. According to the relative number of progenitors, one pair-instability explosion of a very massive star is expected for every one thousand core-collapse explosions of massive stars (Langer et al., 2007; Young et al., 2008). Nevertheless, the explosion of PISN even for a low-mass progenitor ( 150 ) appears sufficiently bright to be detected at large distances (Kasen et al., 2011; Kozyreva et al., 2014a). Hence we presume that observationally the number of PISNe is higher than proposed ratio 1:1000.
The main property of high mass PISN explosions is a very broad light curve (Kasen et al., 2011; Dessart et al., 2013; Kozyreva et al., 2014a), because during the explosion the entire progenitor is expelled into the surrounding space. The massive ejecta, up to 200 , cause a very long diffusion time. Therefore, the rise to the peak lasts up to 200 days. The shallow decline follows the nickel radioactive decay. In contrast to this, many SLSNe have faster light curve evolution.
If radioactive material is ejected into the upper envelope, then the rise time to the maximum shortens. As a consequence, the ejecta is more compact at peak epoch, and hence colour temperature111Colour temperature is a temperature of a black body spectrum which is close to the spectral density distribution, i.e. continuum spectrum. is higher. Besides that, nickel additionally heats the layers in which it is distributed (see e.g., Shigeyama & Nomoto, 1990; Young, 2004; Bersten et al., 2013). In any case, ejecting freshly produced nickel from the innermost region is challenging and difficult to model in one-dimensional stellar evolution codes.
The present successful multi-dimensional simulations of PISN explosions do not reveal extended mixing (Joggerst & Whalen, 2011; Chen et al., 2014b). However, the observed spectra reveal a presence of metals (including iron) in the spectra of SLSNe (Gal-Yam et al., 2009; Nicholl et al., 2013, 2014) soon after maximum (30 – 50 days later). This motivates a toy experiment assuming different amounts of mixing for our original high-mass PISN model, as explained below. Additionally, we analyse the dependence of the final light curve shape on different degree of the envelope stripping.
It is well-known that the famous SN 1987A light curve requires an extensive mixing of radioactive nickel into the helium-hydrogen atmosphere (Shigeyama & Nomoto, 1990; Utrobin, 1993). Nevertheless, computer simulations hardly reproduce mixing of nickel in SN 1987A (see e.g., Joggerst et al., 2009, and references therein). To explain the high nickel velocities observed in SN 1987A many studies suggest clumping and ejection of the innermost hot matter into the overlying shells (Arnett et al., 1989; Haas et al., 1990; Basko, 1994, see e.g.,). Colgate (1989) suggests that low-density bubbles could arise as a result of the high-entropy interplay. Simulation by Nagasawa et al. (1988) and Fryxell et al. (1991) show the naturally emerging fragmentation occurring on the early stages of a supernova explosion.
Microscopic diffusive chemical mixing occurs in core-collapse supernovae (hereafter, CCSNe) basically due to the Richtmyer–Meshkov instability, which is similar to the Rayleigh–Taylor instability left behind the passage of the shock wave (Joggerst et al., 2009). A number of studies reveal also that high velocity macroscopic blobs of metal-rich material could appear during neutrino-induced CCSNe (see e.g., Kifonidis et al., 2006; Hammer et al., 2010, and references therein). The reasons for macro-mixing in CCSNe are: (1) proto-neutron star convection, (2) neutrino-driven convection, and (3) magneto-rotational instability (see for discussion Nakamura et al., 2014, and references therein). The preferred direction for buoyant-bubble growth lies towards the equatorial plane.
Even though the physics of PISN differs from that of CCSNe. We propose that there is some possibility that entropy perturbations occur during PISN explosion. The interplay between high-entropy bubbles arising from the explosive site and cooler overlying layers is principal feasible in PISNe, because the pair creation and subsequent explosive burning occur at sufficiently high entropy. Explosive oxygen and subsequently silicon burning provides further increase in entropy. The alpha-disintegration occurring at the very centre lowers entropy causing heterogeneous features in isentropic structure. Hence, macro-mixing or strong anisotropy might take place in PISN ejecta instead of micro-mixing. However, we note that bulk motion of massive macroscopic blobs (10–20 ) is hard to realise in the explosive time-scale.
2 Input models and light curves modelling
Our original stellar evolution model is taken from (Kozyreva et al., 2014b). The particular interest in the scope of this study lies in the high-mass PISN model (with initial mass 250 ). A high-mass PISN produces a very large amount of radioactive nickel (Heger & Woosley, 2002) which powers the supernova light curve. The resulting supernova appears superluminous reaching maximum luminosity up to several erg s (absolute magnitude up to – 22 mag). Our 250 PISN generates 19.3 of nickel and radiates erg s at peak luminosity.
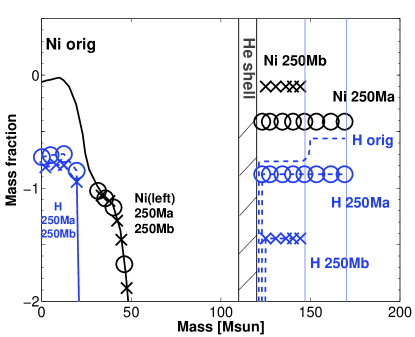
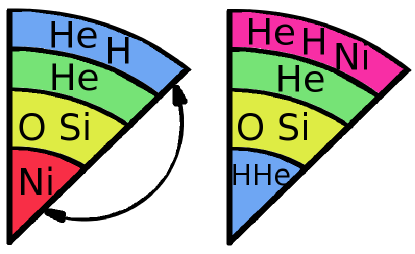
Bottom: Illustration explaining redistribution of chemical elements in the mixed toy models. In the mixed models we replaced nickel from the centre into the outer H/He atmosphere.
Note, that our PISN model evolves in a self-consistent way from the zero-age main sequence, follows the pair-creation phase, undergoes explosive oxygen and silicon burning, and eventually explodes. The calculations were carried out with the stellar evolution code BEC with the extended nuclear network (Langer et al., 2007; Yoon et al., 2006; Kozyreva, 2014). We address the reader to our earlier paper (Kozyreva et al., 2014b) for all details about the evolution and explosion of the PISNe.
Metallicity of our model is 0.001 which is lower than those of hosts of SLSNe 2007bi and PTF12dam (Young et al., 2010; Chen et al., 2015). Slightly higher metallicity leads to higher mass loss and absence of hydrogen in the outer atmosphere of the final PISN progenitor (Yusof et al., 2013). The uncertainty of mass-loss rate allows us to predict the evolutionary model of a very massive star retaining hydrogen atmosphere. Nevertheless, we emphasise that our study is qualitative and demonstrate what kind of observational properties a high-mass hydrogen-rich PISN may have and how the properties change if the model is modified. On top of that, we suspect that metallicity is not the same for the entire galaxy and might be different for the supernova site compared to the averaged value.
2.1 Effect of stripping
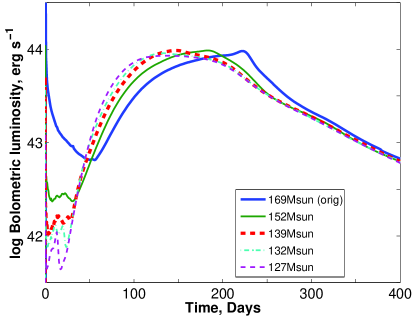
As an initial attempt we ran a number of supernova models for our 250M PISN, in which we subsequently strip the hydrogen-helium envelope. Hence we have a sequence of the following stripped models: 152 , 139 , 132 , and 127 . Note, that our original model 250M contains 169 at the moment of pair-instability explosion. The sequence 152, 139, 132 roughly corresponds to the mass of truncated outermost shell — 20 , 30 , 40 . In the model 127 , the edge lies just above the helium shell, so this model closely corresponds to the 130 helium model (Kasen et al., 2011).
We do not change the chemical composition in these models. We append a tiny stratified atmosphere to satisfy the outer boundary condition (vanishing pressure). The composition of the atmosphere is the same as in the upper layer, at which we truncate the model.
2.2 Effect of mixing
We inspect different kinds of hypothetical “mixing”. We emphasise here that we do not assume microscopic convective mixing operating through the diffusive processes. The pair-instability explosion develops on a dynamical timescale, which is considerably shorter than the convective time.
Based on the multi-dimensional numerical simulations, convective time in the carbon-burning convective shell during core oxygen burning in a massive star model is about 100 s (Viallet et al., 2013). The convective oxygen core roughly has the same convective timescale. Quantitatively, convective time could be estimated as (Woosley et al., 2002). This gives an approximate value about 10 seconds in the core. The convective timescale gradually increases up to s above the oxygen core. However, mentioned timescale is related to regular convection connected to hydrostatic carbon/oxygen burning. It is not excluded that convection might be accelerated on the on-going core-collapse and subsequent explosion. Dynamical time corresponds to a free-fall time . Hence dynamical time is less than second in the core of our PISN model and getting comparable to convective time in the envelope.
To conclude, we exclude the relevance of microscopic mixing taking place during pair-instability explosion. Everywhere in the present study we refer to macroscopic displacement of stellar matter as “mixing” without meaning microscopic convective mixing. Below we detail our selected attempts.
2.2.1 Intermediate mixing
In view of the results of recent studies (Joggerst & Whalen, 2011; Chen et al., 2014b), we calculated a couple of explosions with intermediate mixing. Under “intermediate” we mean the mixing happens in the intermediate oxygen layers. Joggerst & Whalen (2011) and Chen et al. (2014b) claim that possible mixing can occur at the oxygen-helium interface of extended red supergiants. We ran explosions for models in which we mixed material contained in the mass layers between (1) 60 and 130 , and (2) 80 and 150 along Lagrangian mass coordinate 222As Chen et al. (2014b) say, the model 225 manifests “complete destruction of the helium and oxygen layer and partly silicon shell”.. The case (1) implies uniform mixing of the oxygen and helium shells. In the case (2), we propose mixing between half of the oxygen layer ( ), the complete helium shell ( ) and part of the hydrogen-helium atmosphere ( ).
However, we show in Section 3.1 that none of the models with intermediate mixing produce light curves very different from the original unmixed PISN model. This happens because the hydrogen and nickel distribution is not modified, although hydrogen and nickel remain the most crucial in formation of the light curve (Utrobin, 1993).
2.2.2 Uniform mixing
Next, we present a few toy models that were computed assuming (1) an overall uniform mixing of the entire star, (2) an uniform distribution of nickel through the inner regions of the star inside 120 , i.e. up to the upper edge of the oxygen layer, and (3) an uniform distribution of nickel in 30 at the upper boundary of oxygen shell. In the later model we additionally depleted the hydrogen-helium atmosphere by 10 . As we show in Section 3.1, even though these models produce light curves which significantly differ from the original model supernova evolution, they poorly match SLSN properties.
2.2.3 Extreme nickel mixing
Finally, we calculate an extraordinary toy experiment motivated thus. The main properties of some SLSNe are fast rise time, high colour temperature and high photospheric velocity. These properties are hardly reproduced by massive PISN models. It is well-known that faster rise to the peak luminosity can be achieved by putting radioactive material into the upper layers (Shigeyama & Nomoto, 1990; Piro & Nakar, 2014). Another consequence of this relocation is increase in photospheric temperature.
For extreme mixing we relocated almost all of the radioactive nickel from the innermost 20 region to the hydrogen-helium envelope. To fulfil total mass conservation we displaced outermost 20 of hydrogen-helium into the centre. This is done only because of simplification for realisation of our toy model. Otherwise, outer 20 of hydrogen and helium might be decayed amongst intermediate layers. However, the light curve will be strongly affected by hydrogen recombination in this case (Shigeyama & Nomoto, 1990; Utrobin, 1993). Such extreme chemical displacement sounds difficult to realise, but provides light curve evolution suitable for explaining properties of SLSNe.
Our modified chemical structures are shown in Figure 1 (see the bottom panel of Figure 1 for illustration). In the model 250Ma, almost all radioactive nickel was replaced into the outer hydrogen-helium layer. Vice versa, the same amount of hydrogen and helium (with the original proportion of mass fraction 20:80) was replaced into the centre. In the model 250Mb, firstly we artificially removed 20 of the outer hydrogen-helium atmosphere, and then displace nickel and hydrogen/helium (similarly to the model 250Ma).
The calculations of the explosion evolution is carried out with the one-dimensional multigroup radiation Lagrangian implicit hydrodynamics code STELLA (see Blinnikov et al. 2006, Kozyreva et al. 2014a for details and references therein).
It is clear that a one-dimensional code treats the proposed “mixing” as uniform. An uniform mixing might be a result of micro-mixing processes. However, diffusive microscopic mixing of 20 or 100 of stellar matter operates on the timescale much longer than dynamical timescale on which the explosion occurs. At the same time matter can be ejected in the form of macroscopic clumps or blobs without a requirement of mixing with the ambient stellar matter. Nevertheless, this is difficult to model with a one-dimensional code. We discuss this point in the following sections.
3 Results
3.1 Halfway results
In Figure 2, we show resulting light curves for the truncated models. Shrinking of the hydrogen-helium envelope does not lead to significant changes in the light curve width333Diffusion time mainly depends on the ejecta mass () (Falk & Arnett, 1977; Kasen & Woosley, 2009). Hence, decrease in mass by 40 reduces the overall diffusion time by less than 25%.. The shape of the photospheric phase slightly changes: rise to maximum becomes sharper, and the nickel-powered photospheric phase becomes more symmetric (dome-like).
Noticeable difference is related to the phase between shock breakout and the rise to maximum. The model 250M has the longest shock-cooling phase, because the model contains the largest envelope in the sense of radius. Once the tenuous part of the envelope is depleted, the outermost layer relaxes very quickly after the shock breakout event. At the same time stripping of the envelope causes the plateau-like phase between shock breakout and re-brightening to the nickel-powered maximum. This phase is governed by recombination in the helium shell, so that the light curve is a result of recession of recombination front combined with a overall expansion of the ejecta. In model 127 the light curve even has a prominent local maximum during this intermediate phase.
We conclude that the main benefit of stripped models is the decrease in the rise time. Light curves of these models rise slightly faster to maximum than initial model, keeping the overall duration long enough. Generally speaking, evolutionary models of very massive stars with inclusion of higher mass-loss rates and/or rotation might result in PISN progenitors lacking the massive hydrogen-helium atmosphere and part of helium shell (Yusof et al., 2013; Chatzopoulos et al., 2015). Therefore, we think that future evolutionary calculations of rotating very massive stars might be relevant for SLSNe. Nevertheless, we emphasise that truncation of the hydrogen-helium envelope in our original model 250M does not lead to desirable changes in observational signatures of PISNe and does not provide sufficiently successful results in explaining SLSNe. We expect more significant changes for mixed models, which we describe in the following paragraphs.
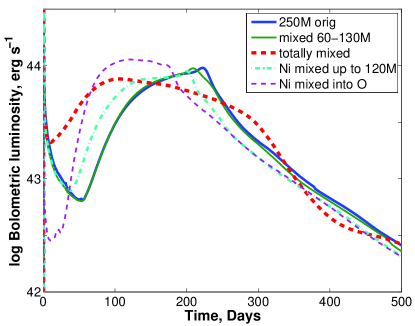
In Figure 3, we demonstrate light curves for intermediately and uniformly mixed models. The light curve for the original PISN model 250M is labelled “250M orig” and appears as a blue line.
Uniform intermediate mixing of oxygen and helium shells (between 60 and 130 along mass coordinate) does not provide big a difference from the original light curve. This is mostly because the modified model (green line labelled “mixed 60-130M”) has no changes in hydrogen and nickel distribution compared to the model 250M. Both hydrogen and nickel are the principal species that govern dynamics of electron-scattering photosphere.
Totally mixed model is presented by the red line (labelled “totally mixed”). Since nickel is distributed up to the edge of the star, it starts powering the resulting light curve earlier than model 250M. Therefore, nickel-powered maximum occurs at day 100, while it happens at day 220 in the original model 250M. Hydrogen being throughout the ejecta prevents photosphere from recession and makes the light curve very broad, even broader than the original one. Because hydrogen retains in the outer layer, the slope of rise to the peak luminosity is similar to model 250M.
Smearing nickel throughout the inner regions allows re-brightening to occur earlier (model labelled “Ni mixed up to 120M”). However, since overall chemical structure (except nickel) is the same as model 250M, there is no other difference between the light curves.
Displacement of all nickel with 30 at the upper boundary of oxygen shell significantly modifies the shape of the original light curve. It sharply rises to “maximum plateau” (shown in magenta, labelled “Ni mixed into O”). Such short rise time is explained by distribution of nickel in a narrow shell far from the centre. The explanation for the plateau-like shape is the following. The high energy photons from nickel decay heat the overlying layer and keep the hydrogen ionised, preventing recession of the electron-scattering photosphere. The width of the light curve is slightly less than model 250M, because 10 of the outer atmosphere were depleted.
To conclude the halfway results, we suggest the following. To force the light curve to rise faster, nickel has to appear close to the edge of the ejecta and be distributed locally in the mass coordinate. To reduce the light curve width, the hydrogen mass fraction in the ejecta ideally should be reduced.
3.2 Main results
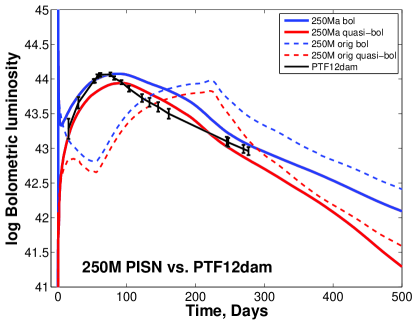
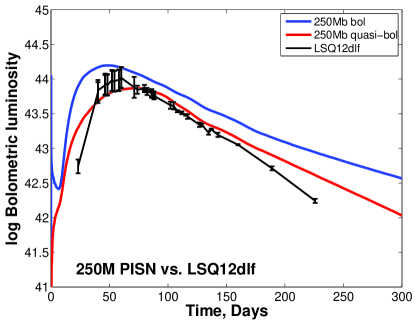
Figures 4 and 5 show bolometric and quasi-bolometric444For the quasi-bolometric light curve we integrate the flux between 3250Å and 8900Å. light curves for the original unmixed PISN model 250M (Kozyreva et al., 2014a), and mixed PISN models 250Ma and 250Mb. The observed quasi-bolometric light curves of SLSNe PTF12dam and LSQ12dlf are also superposed 555We chose these two particular supernovae because among other SLSNe they have relatively broad light curves, so that PISN models are able to match them. In addition, complete observational data for these supernovae were available during the time of the present numerical experiment. (Nicholl et al., 2013, 2014). The observed curves are shifted, so that the computed light curves roughly follow the observations during rise, maximum and post-maximum epochs. PTF12dam data are shifted on 80 days for luminosity, colour temperature and photospheric velocity plots, and LSQ12dlf data are shifted on 60 days.
We see that the original light curve is very broad and indeed encounters difficulty to match observed narrower light curves. Luminosity rises to the peak value during 200 days, while the observed luminosity increases during 50 days and less for PTF12dam and LSQ12dlf, respectively. However, redistribution of radioactive material strongly modifies the radiative properties of the PISN explosion, so that the PISN models 250Ma and 250Mb could explain the observational appearance of SLSNe. We note, however, that other SLSNe have even narrower light curves with very short rise time and sharp decay after maximum. The magnetar nature or circumstellar interaction is probably the best for explaining these events (Kasen & Bildsten, 2010; Woosley, 2010; Dessart et al., 2012b; Chatzopoulos et al., 2013; Nicholl et al., 2015).
It is known that many SLSNe have blue spectra soon after their discovery and hence high colour temperatures (Benetti et al., 2014; Nicholl et al., 2013, 2014). All PISN models in Dessart et al. (2013) have cool photospheres and low temperatures. As Kozyreva et al. (2014a) show, colour temperature of our original PISN model 250M is higher during maximum phase than hydrogen recombination temperature. This is because maximum luminosity happens when the photosphere already leaves the hydrogen-rich layer. Nevertheless, the colour temperature of model 250M hardly explains majority of blue SLSNe.
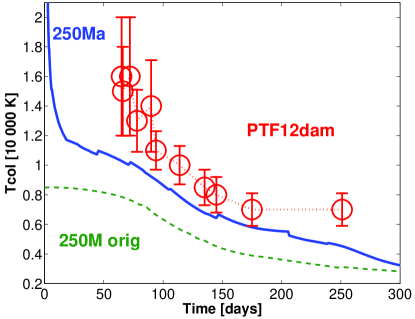
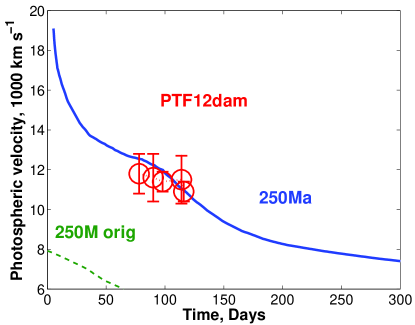
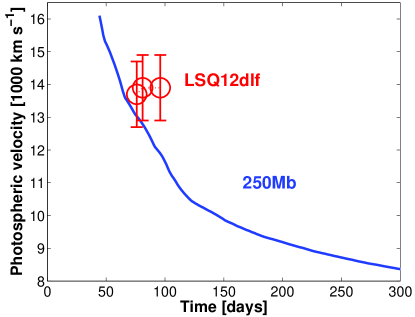
We find out that extended mixing strongly enhances colour temperature666We estimate colour temperature based on the least-square method using the spectral range from 1Å to 50 000Å. around supernova maximum. We show the results and comparison to observations in Figure 6. The ejecta is more compact and hotter for models 250Ma and 250Mb at the time of supernova maximum, because it occurs significantly earlier compared to the unmixed model. In Figures 6 and 7 (top), the theoretical curves of the original model 250M is shown with a shift –130 days. PTF12dam temperature and velocity data are shifted on 80 days, similarly to the light curve comparison. LSQ12dlf data are equally shifted on 60 days for luminosity, temperature and velocity comparison in corresponding figures. As Figure 6 shows, the observed temperature of SLSN PTF12dam is still slightly higher than those of model 250Ma. However, we presume that the observed temperature estimate might contain a significant uncertainty.
Similarly to photospheric temperature many SLSNe demonstrate high photospheric velocities (Nicholl et al., 2014). This property makes them resemble supernovae Type Ic. On the contrary, Kozyreva et al. (2014a) and Dessart et al. (2013) show that massive PISN ejecta provide relatively low velocities, about 5000 km s. We find that radioactive material appearing in the upper layers effectively changes the photospheric velocity evolution (see Figure 7). Ejecting radioactive material into the outer layers provides an earlier maximum, therefore, the photosphere is located in the faster layers at earlier time. Note, that many SLSNe have featureless spectra at early epochs, which encounters difficulties in estimating accurate photospheric velocities.
Even though our PISN model is hydrogen-helium rich, the maximum occurs when the receding electron-scattering photosphere already left the massive hydrogen-helium envelope and moves along a thick oxygen shell. Therefore, if the supernova is discovered at maximum, it might look like a SN Ic, but the presence of observable H/He signatures can not be ruled out.
4 Discussion
Through our simulations we show that a PISN model with abundance inversion might explain two particular SLSNe: PTF12dam and LSQ12dlf. Our qualitative fits are shown in Figures 4, 5, 6, and 7.
Model 250Ma traces the general behaviour of PTF12dam’s light curve, with a relatively sharp 50 day rise and post-maximum decline. Model 250Ma has colour temperature about 13000 K at the time of luminosity maximum. The 250Ma temperature curve lies very close to the observed points. Photospheric velocity at luminosity maximum is 12 000 km s (Figure 7) and suitable in matching the high photospheric velocity of PTF12dam. In principle, if our 250 PISN model possesses sufficient amount of nickel in the outer layers, then it might reproduce observational appearance of SLSN PTF12dam.
An alternative model is considered by Baklanov et al. (2015). It is based on supernova shock interaction with circumstellar matter. The modelled light curves look suitable for PTF12dam. However, the model requires unrealistic input parameters, 5 helium ejecta colliding with the 100 carbon–oxygen shell. More realistic ejecta–circumstellar interaction model was suggested by Nicholl et al. (2014) with physically reasonable parameters (26 ejecta and 13 shell).
Another semi-analytic magnetar-driven models for PTF12dam are available in the literature (Nicholl et al., 2013, 2014; Chen et al., 2015). The authors however think that the magnetar-powered supernova models encounter certain difficulties in explaining the high luminosity events (Badjin et al., 2015). In more detailed consideration, magnetar rotational energy is not capable to be directly converted into thermal radiation. Thermal photon field causes high pair-creation opacity for gamma-photons in magnetar vicinity, and hence prevent them to enter the expanding shell. The spin-down energy is converted into relativistic plasma pressure, and in turn into the kinetic energy of the inner shell. As a consequence, the resulting light curve does not reach luminosities required by SLSNe.
We attempt to fit the narrower light curve of LSQ12dlf with the model 250Mb, in which we also shrink the hydrogen-helium atmosphere. In general, our model 250Mb fits the luminosity behaviour. We suppose that, if the ejecta retain even lower hydrogen-helium mass, then the fit would be better. However, through the present simulations we qualitatively demonstrate the opportunity for massive PISNe to explain fast SLSNe. Modelled colour temperature and photospheric velocity of 250Mb match those of LSQ12dlf.
Below we discuss a few weak points which might arise for our “macro-mixed” PISN models.
4.1 Hydrogen, helium and iron in SLSN spectra
Many SLSNe are classified as supernovae Type Ic, because of the absence of hydrogen and helium in their early spectra.
The absence or presence of helium in the spectra can be a clue point for macroscopic mixing. Similar ideas were discussed for SN Ib and SN Ic explosions (see e.g., Clocchiatti et al., 1997; Branch et al., 2002; Branch, 2003; Dessart et al., 2012a). As proposed, both SNe Ib and SNe Ic may have similar helium mass. The difference between these two SN types arises from different amount of radioactive material mixed into the outer helium layers of the ejecta.
Helium being mixed with radioactive material should be excited and emerge in the spectra. The minimum mass fraction of radioactive material is 0.01 as stated by Dessart et al. (2012a). It is very difficult to hide hydrogen and helium if these species are microscopically mixed with nickel, especially, if hydrogen-helium mass is very high, as PISN progenitors have (Hachinger et al., 2012). If nickel is distributed in the form of macroscopic blobs without direct mixing with hydrogen and helium, then it is likely that there is no significant excitation by positrons from –decay at least at the earlier phase (S. Hachinger, private communication). Later on, the blobs decay, and hydrogen/helium excitation might happen.
Numerous studies focusing both on observations and theoretical simulations suggest that there are asymmetries in SN explosions (see e.g., Clocchiatti et al., 1997; Höflich et al., 1999; Maeda et al., 2006; Dessart et al., 2012a, and references therein). Asymmetric chemical distribution or clumping helps to avoid direct mixing of radioactive material with hydrogen and helium, which prevents non-thermal excitation and ionisation, and in turn avoids signatures of hydrogen/helium in the spectra.
In our mixed models, nickel is located in the outer layer. During the maximum phase this layer has temperature around 10000 K and 15000 K (models 250Ma and 250Mb respectively). At such a high temperature iron (created from nickel and cobalt) is ionised (Fe III, Fe IV) and contributes only to far-UV, but not to visual light.
Overall, it remains controversial whether such a huge amount of hydrogen and helium (20–50 ) might be hidden or appear in the PISN spectra.
4.2 The nature of mixing
As we mention above, the displacement of chemical elements, if it happens, takes place simultaneously along with the pair-instability explosion. Macroscopic movement of stellar matter should proceed on the timescale of the explosion, i.e. dynamical time (fraction of second). Convection operates on the longer characteristic time, governed by thermal Kelvin-Helmholtz scale, which is probably accelerated by the explosion in the central regions. The nickel-“core” covers up to 60 % in radius of the entire exploding oxygen core, so that initialisation of chemical displacement could happen. However, we conclude that such macroscopic movement can more readily emerge from global anisotropy.
Ignoring the great difference in the mass, the thermonuclear pair-instability explosion resembles thermonuclear explosion of a white dwarf, which, as widely believed, results in SN Ia. Both observations of SN Ia (see e.g., Goobar et al., 2014; Piro & Nakar, 2014) and theoretical simulations of white dwarf explosions (Gamezo et al., 2003) discover that during explosion of a white dwarf fast moving blobs from the innermost region penetrate the entire ejecta and emerge on the surface front. Similarly, macroscopic replacement of stellar matter might occur in the pair-instability explosion inside the exploding oxygen core. However, as we show in Section 3.1, there are no suitable changes happening for the light curve evolution under this condition. If suddenly nickel is swept into the helium shell, and, for instance, the progenitor lost all hydrogen, then the situation might result in a very different light curve.
So far, all existing PISN evolutionary models are one-dimensional (Heger & Woosley, 2002; Umeda & Nomoto, 2002; Yusof et al., 2013; Kozyreva et al., 2014b; Chatzopoulos et al., 2015; Smidt et al., 2015, and others). Even though some of these models are mapped into the multi-dimensional code for following up the explosion, this could not produce any strong anisotropy and macroscopic movement of ejecta matter (e.g., Chen et al., 2014a, b). Assuming strong perturbations in the entropy (or velocity) field during the earliest explosion phase might result in high entropy plumes which in turn drives radioactive material from the innermost region into the upper layers. Future numerical simulations will shed light on this question.
To summarise, until further studies determine if such strong mixing occurs, the relevance of PISN models to SLSNe, especially rapidly rising examples, remains unclear.
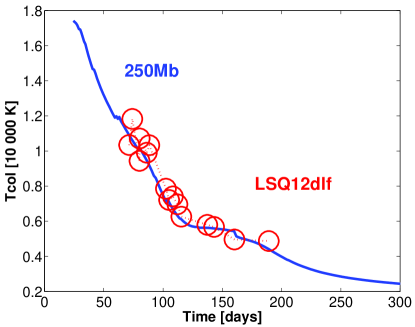
Right: Colour temperature of the mixed model 250Mb (solid thick line) and observed SLSN LSQ12dlf (red circles, shifted on 60 days, Nicholl et al. (2014)). See explanation in the text.
The recent results discover though that some very massive rotating stars at relatively high metallicity (0.001–0.002) lose all hydrogen and part of helium layers (Yusof et al., 2013; Whalen et al., 2014; Chatzopoulos et al., 2015). During the pair-instability explosion some of the most massive and the most energetic models produce up to 40 of nickel, which is very naturally, without any artificial modification, distributed up to the edge of the oxygen core. The closeness of radioactive material to the surface allows nickel to power the light curve very soon after the shock-breakout event. This makes PISNe more suitable for SLSNe like PTF12dam. The new results will be described in a forthcoming paper.
5 Conclusions
In the present study we computed post-explosion photospheric evolution of pair instability supernovae. Our input models are based on the evolutionary model 250M (Kozyreva et al., 2014b). The original broad light curve resulting from the explosion of a very massive PISN progenitor makes PISNe difficult to interpret fast evolving SLSNe with relatively short rise and rapid decline in light curves. Nevertheless, Kozyreva et al. (2014a) show that at least some of SLSNe (2007bi and PTF10nmn) might be easily explained by our 250 PISN model.
Strong mixing with extreme redistribution of metals along the ejecta significantly modifies the observational appearance of PISN explosion. We made numerous attempts with different kinds of redistribution of species in the original chemical structure of the 250 PISN model. In particular, two toy models, 250Ma and 250Mb, appear the most suitable for SLSN photospheric evolution. In these models almost all radioactive nickel was relocated into the hydrogen-helium envelope. The resulting light curves have faster evolution than the original unmixed 250 PISN model. The radioactive material in the upper layers provides the earlier maximum, shorter and steeper rise, and higher colour temperatures and higher photospheric velocities around peak epoch. Other attempts involve mixing of nickel inside the oxygen core and totally mixed model. These attempts do not result in a desirable modification of the photospheric supernova evolution.
We compare our results to two SLSNe PTF12dam and LSQ12dlf. The models 250Ma and 250Mb partly match their observed properties. Hence, macro-scale clumping in the PISN ejecta or strong anisotropy might help PISN to be a good candidate for SLSNe. Mixing of 20 of nickel (even in blobs) with 25–50 of hydrogen and helium would likely provide spectral signatures by non-thermal excitation mechanism. However, it is not clear how strong might be the effect of excitation. On top of that, realisation of such an extreme chemical redistribution is problematic. Therefore, we emphasise that our hydrogen-helium rich massive PISN model are not relevant for explaining main features of hydrogen-helium poor rapidly rising SLSNe.
Looking differently, our results might mean that PISN ejecta need to be “mixed” to explain SLSN observations. In addition, the observed nebular spectra of SLSN 2007bi and some other SLSNe also may require some mixing in the SN ejecta (Jerkstrand & Smartt, 2015). In particular, oxygen lines are narrow and iron lines are broad (see e.g., Gal-Yam et al., 2009; Nicholl et al., 2014), which, in turn, means that at least some amount of oxygen is located close to the centre, and iron is located far from the central region.
To conclude, we stress that PISN originating from the explosion of very massive star is not the best candidate for majority of SLSNe. Nevertheless, rotating PISN models might be more suitable at least for some slowly-rising SLSNe. Future stellar evolutionary calculations, multi-dimensional simulations of the pair-instability explosion and supernova simulations will shed light on this question.
Acknowledgements
AK acknowledges support from EU-FP7-ERC-2012-St Grant 306901. AK highly appreciates all comments and ideas emerged during extensive discussions with Takashi Moriya, Norbert Langer, Debashis Sanyal, Anders Jerkstrand, Matt Nicholl, Steven Smartt, Mikhail Basko, Ken’ichi Nomoto, Avishay Gal-Yam, and Stephan Hachinger. SB is supported by a grant from the Russian Science Foundation (project number 14-12-00203).
References
- Arnett et al. (1989) Arnett W. D., Bahcall J. N., Kirshner R. P., Woosley S. E., 1989, ARA&A, 27, 629
- Badjin et al. (2015) Badjin D. A., Barkov M. V., Khangulyan D., Blinnikov S. I., 2015, in prep.
- Baklanov et al. (2015) Baklanov P. V., Sorokina E. I., Blinnikov S. I., 2015, Astronomy Letters, 41, 95
- Barkat et al. (1967) Barkat Z., Rakavy G., Sack N., 1967, Physical Review Letters, 18, 379
- Basko (1994) Basko M., 1994, ApJ, 425, 264
- Benetti et al. (2014) Benetti S., et al., 2014, MNRAS, 441, 289
- Bersten et al. (2013) Bersten M. C., Tanaka M., Tominaga N., Benvenuto O. G., Nomoto K., 2013, ApJ, 767, 143
- Bisnovatyi-Kogan & Kazhdan (1967) Bisnovatyi-Kogan G. S., Kazhdan Y. M., 1967, Soviet Ast., 10, 604
- Blinnikov et al. (2006) Blinnikov S. I., Röpke F. K., Sorokina E. I., Gieseler M., Reinecke M., Travaglio C., Hillebrandt W., Stritzinger M., 2006, A&A, 453, 229
- Branch (2003) Branch D., 2003, in van der Hucht K., Herrero A., Esteban C., eds, IAU Symposium Vol. 212, A Massive Star Odyssey: From Main Sequence to Supernova. p. 346 (arXiv:astro-ph/0207197)
- Branch et al. (2002) Branch D., et al., 2002, ApJ, 566, 1005
- Chatzopoulos & Wheeler (2012) Chatzopoulos E., Wheeler J. C., 2012, ApJ, 760, 154
- Chatzopoulos et al. (2013) Chatzopoulos E., Wheeler J. C., Vinko J., Horvath Z. L., Nagy A., 2013, ApJ, 773, 76
- Chatzopoulos et al. (2015) Chatzopoulos E., van Rossum D. R., Craig W. J., Whalen D. J., Smidt J., Wiggins B., 2015, ApJ, 799, 18
- Chen et al. (2014a) Chen K.-J., Heger A., Woosley S., Almgren A., Whalen D., 2014a, preprint, p. 1407.7550 (arXiv:1407.7550)
- Chen et al. (2014b) Chen K.-J., Heger A., Woosley S., Almgren A., Whalen D. J., 2014b, ApJ, 792, 44
- Chen et al. (2015) Chen T.-W., et al., 2015, MNRAS, 452, 1567
- Chevalier & Irwin (2011) Chevalier R. A., Irwin C. M., 2011, ApJ, 729, L6
- Clocchiatti et al. (1997) Clocchiatti A., et al., 1997, ApJ, 483, 675
- Colgate (1989) Colgate S. A., 1989, Nature, 341, 489
- Cooke et al. (2012) Cooke J., et al., 2012, Nature, 491, 228
- Crowther et al. (2010) Crowther P. A., Schnurr O., Hirschi R., Yusof N., Parker R. J., Goodwin S. P., Kassim H. A., 2010, MNRAS, 408, 731
- Dessart et al. (2012a) Dessart L., Hillier D. J., Li C., Woosley S., 2012a, MNRAS, 424, 2139
- Dessart et al. (2012b) Dessart L., Hillier D. J., Waldman R., Livne E., Blondin S., 2012b, MNRAS, 426, L76
- Dessart et al. (2013) Dessart L., Waldman R., Livne E., Hillier D. J., Blondin S., 2013, MNRAS, 428, 3227
- Dexter & Kasen (2013) Dexter J., Kasen D., 2013, ApJ, 772, 30
- El Eid & Langer (1986) El Eid M. F., Langer N., 1986, A&A, 167, 274
- Falk & Arnett (1977) Falk S. W., Arnett W. D., 1977, ApJS, 33, 515
- Fowler & Hoyle (1964) Fowler W. A., Hoyle F., 1964, ApJS, 9, 201
- Fraley (1968) Fraley G. S., 1968, Ap&SS, 2, 96
- Fryxell et al. (1991) Fryxell B., Arnett D., Mueller E., 1991, ApJ, 367, 619
- Gal-Yam (2012) Gal-Yam A., 2012, Science, 337, 927
- Gal-Yam et al. (2009) Gal-Yam A., et al., 2009, Nature, 462, 624
- Gamezo et al. (2003) Gamezo V. N., Khokhlov A. M., Oran E. S., Chtchelkanova A. Y., Rosenberg R. O., 2003, Science, 299, 77
- Ginzburg & Balberg (2012) Ginzburg S., Balberg S., 2012, ApJ, 757, 178
- Goobar et al. (2014) Goobar A., et al., 2014, ApJ, 784, L12
- Haas et al. (1990) Haas M. R., Erickson E. F., Lord S. D., Hollenbach D. J., Colgan S. W. J., Burton M. G., 1990, ApJ, 360, 257
- Hachinger et al. (2012) Hachinger S., Mazzali P. A., Taubenberger S., Hillebrandt W., Nomoto K., Sauer D. N., 2012, MNRAS, 422, 70
- Hammer et al. (2010) Hammer N. J., Janka H.-T., Müller E., 2010, ApJ, 714, 1371
- Heger & Woosley (2002) Heger A., Woosley S. E., 2002, ApJ, 567, 532
- Höflich et al. (1999) Höflich P., Wheeler J. C., Wang L., 1999, ApJ, 521, 179
- Jerkstrand & Smartt (2015) Jerkstrand A., Smartt S., 2015, in prep.
- Joggerst & Whalen (2011) Joggerst C. C., Whalen D. J., 2011, ApJ, 728, 129
- Joggerst et al. (2009) Joggerst C. C., Woosley S. E., Heger A., 2009, ApJ, 693, 1780
- Kasen & Bildsten (2010) Kasen D., Bildsten L., 2010, ApJ, 717, 245
- Kasen & Woosley (2009) Kasen D., Woosley S. E., 2009, ApJ, 703, 2205
- Kasen et al. (2011) Kasen D., Woosley S. E., Heger A., 2011, ApJ, 734, 102
- Kifonidis et al. (2006) Kifonidis K., Plewa T., Scheck L., Janka H.-T., Müller E., 2006, A&A, 453, 661
- Kozyreva (2014) Kozyreva A., 2014, PhD thesis, University of Bonn, 162 pp.
- Kozyreva et al. (2014a) Kozyreva A., Blinnikov S., Langer N., Yoon S.-C., 2014a, A&A, 565, A70
- Kozyreva et al. (2014b) Kozyreva A., Yoon S.-C., Langer N., 2014b, A&A, 566, A146
- Langer et al. (2007) Langer N., Norman C. A., de Koter A., Vink J. S., Cantiello M., Yoon S.-C., 2007, A&A, 475, L19
- Maeda et al. (2006) Maeda K., Mazzali P. A., Nomoto K., 2006, ApJ, 645, 1331
- Mazzali et al. (2006) Mazzali P. A., et al., 2006, Nature, 442, 1018
- McCrum et al. (2014) McCrum M., et al., 2014, MNRAS, 437, 656
- Moriya et al. (2010) Moriya T., Tominaga N., Tanaka M., Maeda K., Nomoto K., 2010, ApJ, 717, L83
- Moriya et al. (2013) Moriya T. J., Blinnikov S. I., Baklanov P. V., Sorokina E. I., Dolgov A. D., 2013, MNRAS, 430, 1402
- Nagasawa et al. (1988) Nagasawa M., Nakamura T., Miyama S. M., 1988, PASJ, 40, 691
- Nakamura et al. (2014) Nakamura K., Kuroda T., Takiwaki T., Kotake K., 2014, ApJ, 793, 45
- Nicholl et al. (2013) Nicholl M., et al., 2013, Nature, 502, 346
- Nicholl et al. (2014) Nicholl M., et al., 2014, MNRAS, 444, 2096
- Nicholl et al. (2015) Nicholl M., et al., 2015, MNRAS, 452, 3869
- Piro & Nakar (2014) Piro A. L., Nakar E., 2014, ApJ, 784, 85
- Quimby et al. (2011) Quimby R. M., et al., 2011, Nature, 474, 487
- Rakavy & Shaviv (1967) Rakavy G., Shaviv G., 1967, ApJ, 148, 803
- Schneider et al. (2014) Schneider F. R. N., et al., 2014, ApJ, 780, 117
- Schnurr et al. (2008) Schnurr O., Casoli J., Chené A.-N., Moffat A. F. J., St-Louis N., 2008, MNRAS, 389, L38
- Shigeyama & Nomoto (1990) Shigeyama T., Nomoto K., 1990, ApJ, 360, 242
- Smidt et al. (2015) Smidt J., Whalen D. J., Chatzopoulos E., Wiggins B., Chen K.-J., Kozyreva A., Even W., 2015, ApJ, 805, 44
- Umeda & Nomoto (2002) Umeda H., Nomoto K., 2002, ApJ, 565, 385
- Utrobin (1993) Utrobin V., 1993, A&A, 270, 249
- Viallet et al. (2013) Viallet M., Meakin C., Arnett D., Mocák M., 2013, ApJ, 769, 1
- Whalen et al. (2014) Whalen D. J., et al., 2014, ApJ, 797, 9
- Woosley (2010) Woosley S. E., 2010, ApJ, 719, L204
- Woosley et al. (2002) Woosley S. E., Heger A., Weaver T. A., 2002, Reviews of Modern Physics, 74, 1015
- Yoon et al. (2006) Yoon S.-C., Langer N., Norman C., 2006, A&A, 460, 199
- Young (2004) Young T. R., 2004, ApJ, 617, 1233
- Young et al. (2008) Young D. R., Smartt S. J., Mattila S., Tanvir N. R., Bersier D., Chambers K. C., Kaiser N., Tonry J. L., 2008, A&A, 489, 359
- Young et al. (2010) Young D. R., et al., 2010, A&A, 512, A70
- Yusof et al. (2013) Yusof N., et al., 2013, MNRAS, 433, 1114