Temperature evolution of correlation strength in the superconducting state of high- cuprates
Abstract
We have performed an angle-resolved photoemission study of the nodal quasi-particle spectra of the high- cuprate tri-layer Bi2Sr2Ca2Cu3O10+δ ( 110 K). The spectral weight of the nodal quasi-particle increases with decreasing temperature across the . Such a temperature dependence is qualitatively similar to that of the coherence peak intensity in the anti-nodal region of various high- cuprates although the nodal spectral weight remains finite and large above . We attribute this observation to the reduction of electron correlation strength in going from the normal metallic state to the superconducting state, a characteristic behavior of a superconductor with strong electron correlation.
The strength of electron correlation in a metal is represented by the renormalization factor , where is the annihilation operator of electron on the Fermi surface, is the ground state, and is the lowest energy state with a quasi-particle (QP) of momentum . gives the weight of the QP peak in the single-particle spectral function at and at the Fermi level (), which can be measured by angle-resolved photoemission spectroscopy (ARPES)Hufner . According to BCS theory, which describes superconductivity in metals with weak electron correlation, the QP is fully coherent ( =1) all over the Fermi surfaces and, in a -wave BCS superconductor, the QP spectrum on the nodal point of the Fermi surface remains unchanged without gap opening and with =1. One subtle change that has been noticed so far is the sharpening of the QP width below (ref. Yamasaki, ). If superconductivity occurs in the presence of strong electron correlation, on the other hand, the nodal spectral weight increases in going from the normal state to the superconducting state as theoretically predicted by Chou, Lee and Ho Chou . In the theory, the correlated normal state is represented by a projected Fermi-liquid and the correlated superconducting state by a resonating valence-bond (RVB) or a projected BCS state. The increase of the QP spectral weight reflects the partial recovery of the coherence from the highly incoherent projected Fermi-liquid state to in the projected BCS state.
So far, the temperature dependence of the Drude weight in optical conductivity has been investigated for various cuprates Carbone ; Ortolani ; Hwang ; Bontemps . In those studies, the low energy electron number defined by the integration of optical conductivity below a certain cut-off frequency gradually increases with decreasing temperature. Such a behavior is also observed in normal metals such as gold, but the change in the cuprates, e. g., La2-xSrxCuO4 (LSCO), is more than one order of magnitude as large as that in gold. The optical conductivity can be expressed by a two-particle Green’s function, and the QP spectral weight which is derived from the one-particle Green function is also expected to show a similar temperature dependence. However, direct test of the temperature dependence of the QP spectral weight has not been investigated in a systematic way. In the present work, we have performed an ARPES study of the tri-layer cuprates superconductor Bi2Sr2Ca2Cu3O10+δ (Bi2223) in a wide temperature range and investigated changes in the spectral weight of the nodal QP with temperature. The results indeed show a dramatic increase of the QP spectral weight with decreasing temperature.
Single crystals of Bi2223 ( = 110 K) were grown by the traveling solvent floating-zone (TSFZ) method. ARPES measurements were carried out at BL-9A of Hiroshima Synchrotron Radiation Center (HiSOR). Incident photons have an energy of = 7.56 eV, and measurements were made at = 11, 90, 120, and 160 K. A SCIENTA SES-R4000 analyzer was used in the angle mode with the total energy and momentum resolution of 5 meV and 0.3∘, respectively. All the samples were cleaved in situ under an ultrahigh vacuum of 10-11 Torr. The position of the was calibrated with gold spectra.
The single-particle spectral function measured by ARPES is the imaginary part of the single-particle Green’s function :
| (1) | |||||
where is the bare band electron energy with momentum and is the self-energy. is chosen at . The pole of , is determined by the equation and the residue of the pole
| (2) |
gives the spectral weight of QP. In the vicinity of , one can expand as,
| (3) | |||||
In the vicinity of , , where is taken perpendicular to the Fermi surface and is the Fermi velocity. Then, the momentum distribution curve (MDC) at is given by
| (4) |
This MDC is a Lorentzian, if the self-energy is not strongly dependent on perpendicular to the Fermi surface. The QP weight is, therefore, given by
| (5) |
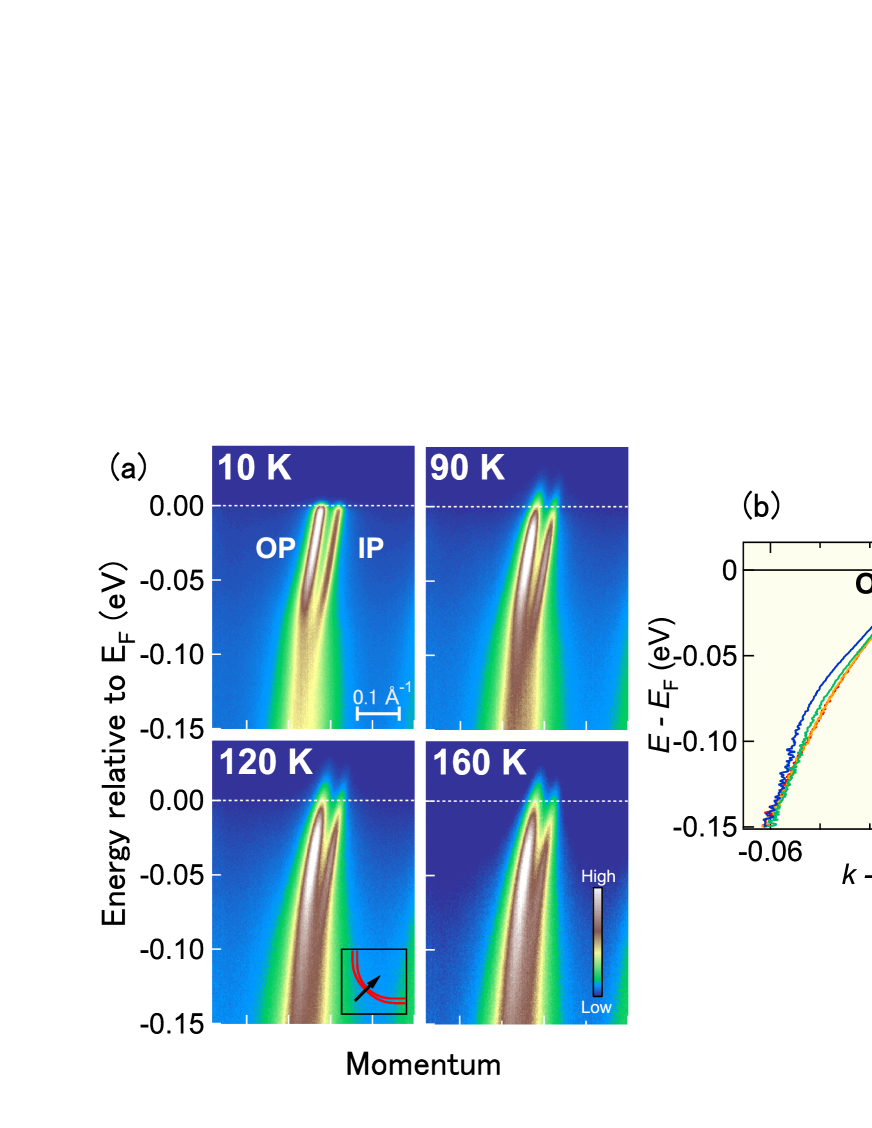
Figure 1(a) shows plots of spectral intensities along the nodal cut. There are two bands corresponding to the inner CuO2 plane (IP) and outer CuO2 plane (OP) of the tri-layer cuprate Ideta .
In panel (b), the QP dispersions are traced by the peak positions of the MDC’s. One can clearly see kinks in the QP dispersions which show temperature dependences. From these spectra, we shall deduce the temperature dependence of the QP spectral weight in the nodal direction.
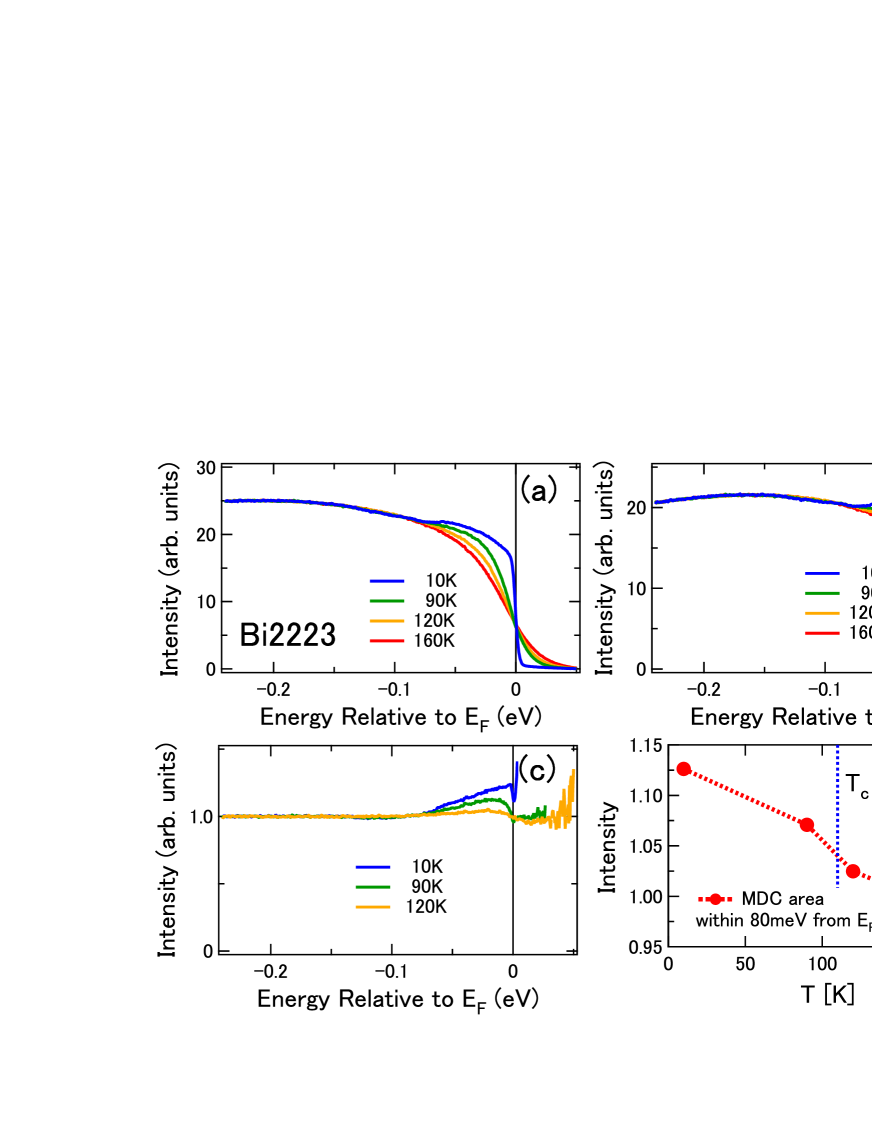
First, we look into the temperature dependence of the MDC area, namely, the momentum-integrated ARPES spectra along the nodal direction as shown in Fig. 2(a). Here, the intensity has been normalized to the intensity at high binding energies 0.2 eV. Figure 2 (b) shows the same data divided by the Fermi-Dirac (FD) function (The gap opens in the 10 K data because the cut was slightly off nodal due to small misalignment). In order to emphasize changes induced by superconductivity, the spectra in panel (b) have been divided by the 160 K spectrum and are shown in panel (c). Thus obtained spectra clearly indicate that the intensity within 80 meV of increases with decreasing temperature. The integrated intensities within 80meV are plotted as a function of temperature in panel (d). Note that the integrated spectral intensities include signals from both the IP and OP bands.
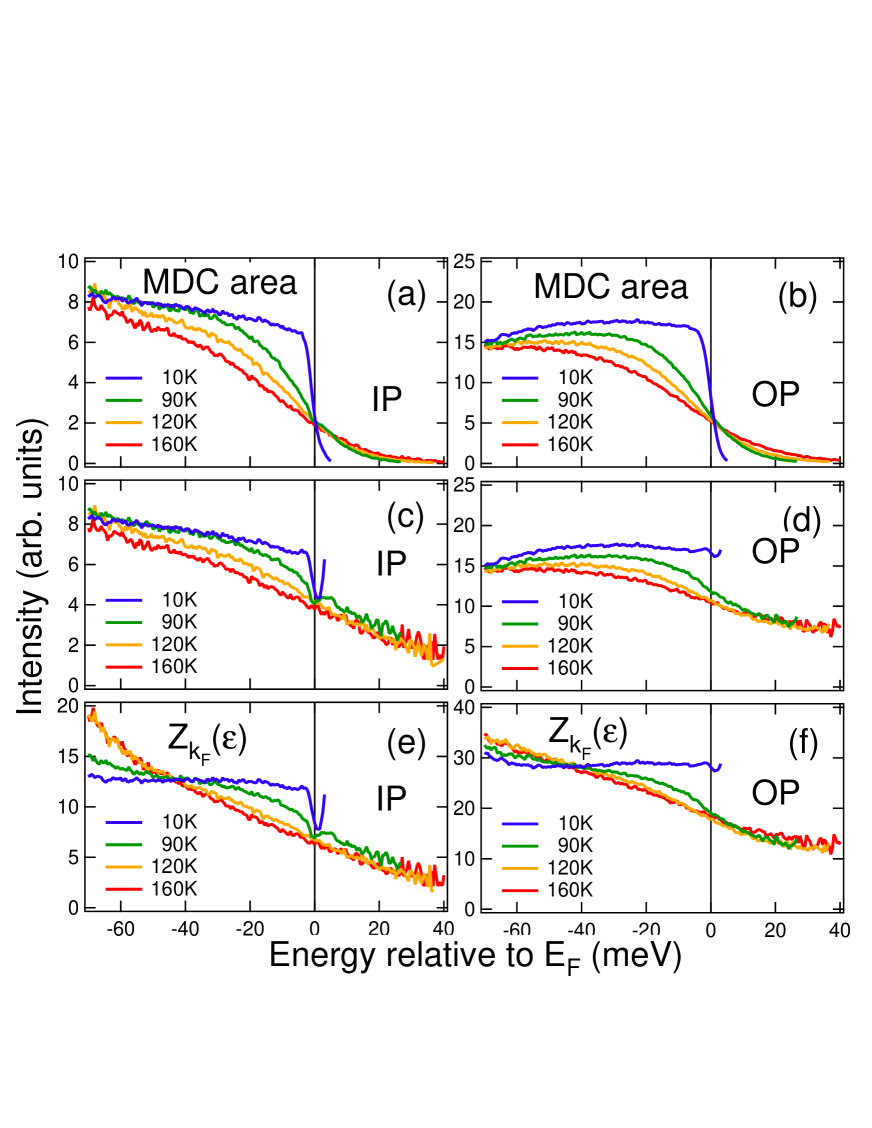
In order to estimate the QP spectral weight at using Eq. (5), signals from the IP and OP bands have to be separated. For that purpose, the MDC at each energy has been fitted to two Lorentzians. The Fermi velocity at , , has been obtained from the slope of the QP dispersion shown in Fig.1(b). Here, we extend Eq. (5), which is defined at , to finite energies as: . The momentum-integrated spectrum for each of the IP and OP bands at various temperatures is plotted in Figs.3(a) and (b). Since the observed MDC area is , where is the FD distribution function, we have divided the spectra by the FD function as plotted in Figs.3(c) and (d). The spectra thus deduced using the finite energy version of Eq. (5) plotted in Figs. 3(e) and (f).
at =10 K is nearly constant in the displayed energy range near as expected for a Fermi liquid or a QP at the node of a -wave BCS superconductor, while at high temperatures (120 K and 160 K ) decrease towards and above it. Also, the value at itself decreases with increasing temperature. This indicates that the nodal spectrum is highly coherent well below , but gradually becomes incoherent with increasing temperature. The degree of deviation from constant or the loss of coherence is a little stronger for the IP band than the OP band, probably due to the smaller hole concentration and hence the stronger electron correlation in the IP bandIdeta .
Although less accurate, the spectral weight can also be derived from energy distribution curves (EDC’s), under the assumption that the normal state is a Fermi liquid (although the high- cuprates near optimum doping is considered to be a marginal Fermi liquid Varma ). For a Fermi liquid, can be expanded in the vicinity of as
| (6) |
From Eqs. (1) and (6), therefore, one obtains
| (7) | |||||
where . When is not on the Fermi surface (), in the vicinity of ,
| (8) |
and, therefore, there is no spectral weight at . As approaches the Fermi surface, the QP peak width becomes narrow, and when is on the Fermi surface (), the QP peak becomes a -function :
| (9) |
That is, the line shape of the EDC at is a -function superposed on top of a broad Lorentzian-like background both centered at Allen . Here, the -function is broadned into a Lorentzian due to impurity scattering. Experimentally, therefore, we expect to observe overlapping two Lorentians with narrow and broad widths.
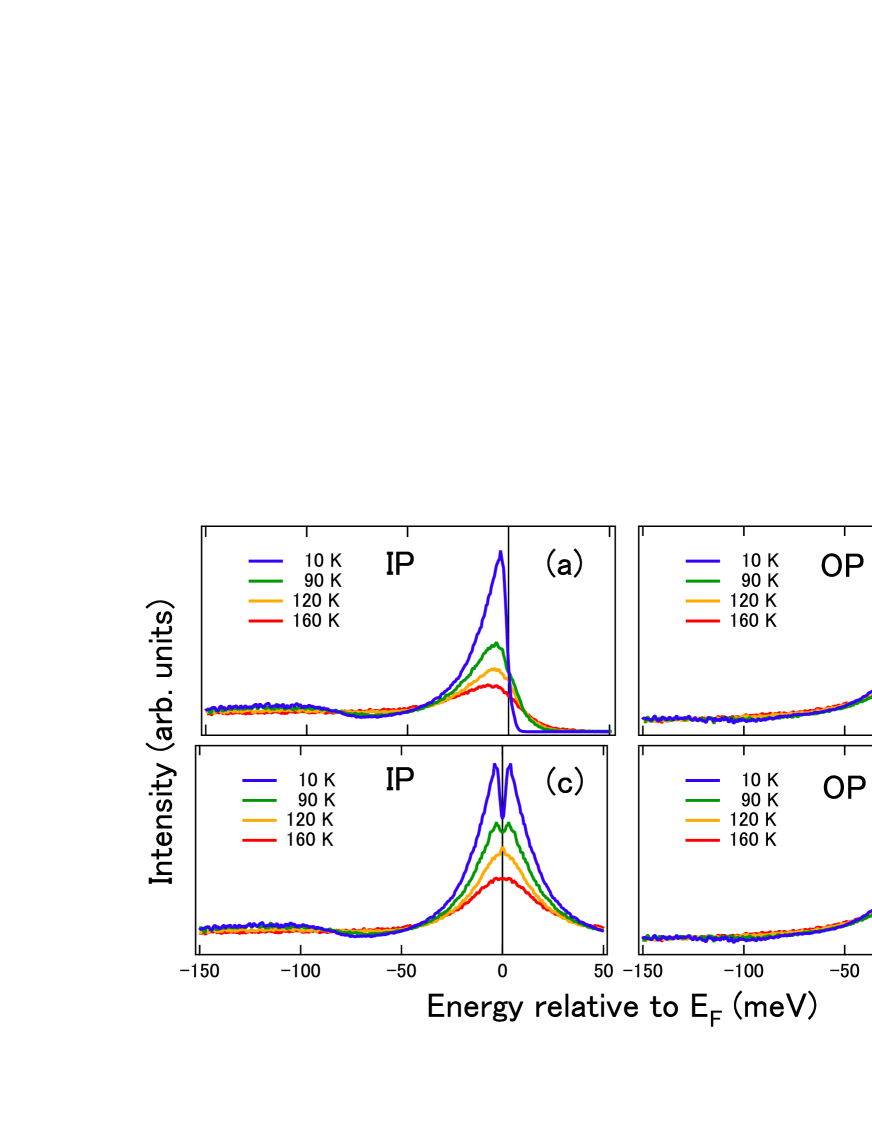
Figure 4 shows EDC’s at [(a),(b)] and their symmetrized spectra [(c),(d)]. As shown in panels (c) and (d) for the IP and OP bands, the line shape of each symmetrized spectrum shows a Lorentzian-like central peak. (The splitting of the symmetrized 10 K data at , particularly in the IP data, arises from small misalignment of the nodal direction.) Again the increase of the spectral weight of the central peak is seen with decreasing temperature. According to Eq. (12), a broad Lorenztian-like background is expected in addition to the relatively sharp Lorenzian QP peak of spectral weight . However, because such a background feature appears negligibly small, we have estimated from the area of the symmetrized EDC’s within 80 meV of .
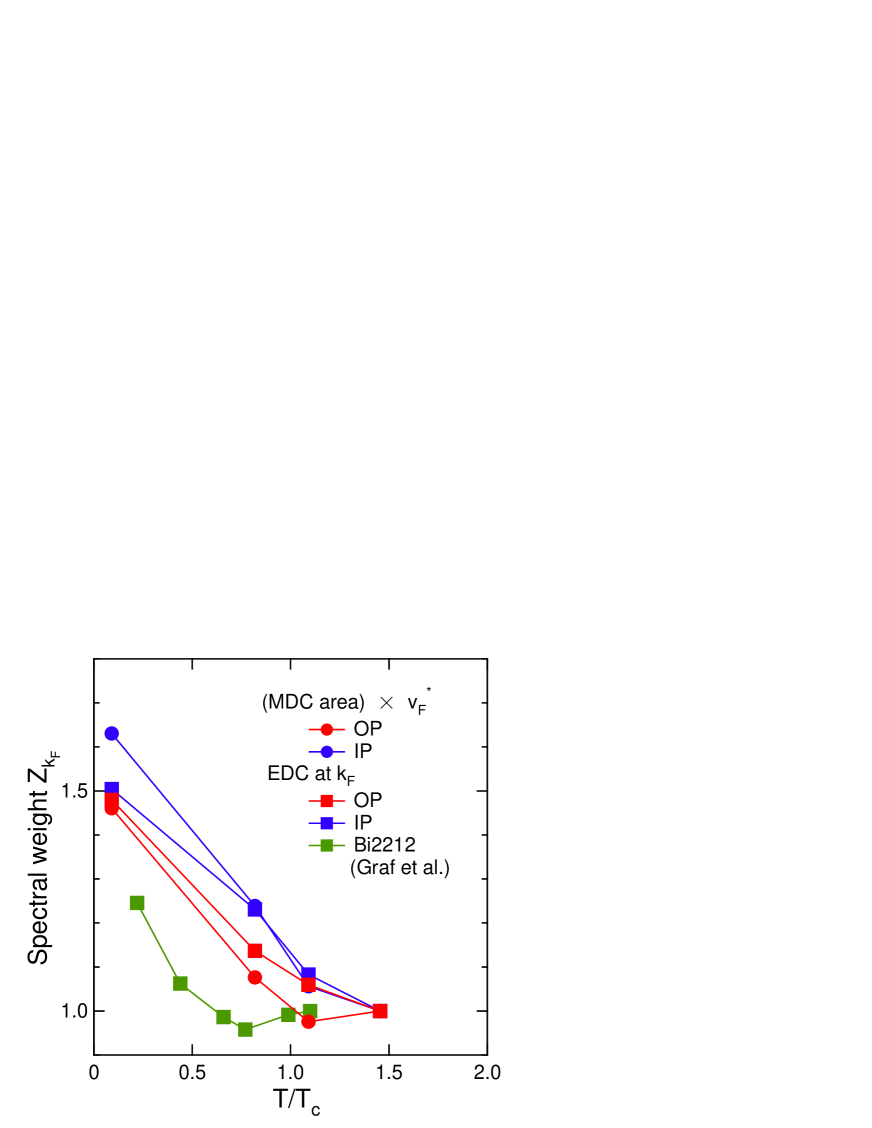
The temperature dependence of the nodal spectral weight for the IP and OP bands obtained from the MDC and EDC analysis are summarized in Fig. 5. The values of at various temperatures have been normalized to the values at 160 K. The temperature dependence of obtained by the MDS’s and EDC’s fall almost on the same curve. The results show a clear increase of by as much as 50% in going from 160 K to 10 K. The of the IP band increases a little more rapidly than that of the OP band with decreasing temperature. Because the IP and OP bands are underdoped and overdoped, respectively, the result indicates that the underdoped CuO2 plane loses coherence faster than the overdoped CuO2 plane with temperature. Here, we have also plotted the of Bi2212 in ref. Graf, . The Bi2212 data also show a similar temperature dependence to that of Bi2223. The smaller increase in the of Bi2212 with decreasing temperature than that in Bi2223 may reflect the smaller superconducting order parameter.
A similar increase of the low energy spectral weight has been observed in optical conductivity Carbone ; Bontemps ; Ortolani ; Hwang , indicating an increase of the coherence in the superconducting state compared to the normal state. In the underdoped region, the Drude weight of the high- cuprates shows a strong temperature dependence compared to that in the overdoped region, which can be interpreted as an electron correlation and/or pseudogap effects Santander ; Bontemps . Particularly in the underdoped region, the low energy spectral weight, i.e., the electron kinetic energy, strongly increases below Molegraaf . Since the contribution from the kinetic energy to the condensation energy is significant compared to the conventional superconductors, kinetic energy driven superconductivity has been proposed Maier ; Norman_T . The increase in the spectral weight below is up to 50%, which is much larger than the change in the Drude weight in various high- cuprates. Such a strong increase of the spectral weight, and hence the increase in the kinetic energy may be one of the reasons of the very high in the tri-layer cuprates.
As shown in Figs. 3(e) and 3(f), below shows a nearly energy-independent Fermi-liquid-like behavior, which is in contrast to strongly energy-dependent incoherent behavior above . Particularly, the of IP monotonically decrease with energy, indicating a strongly incoherent nature of the spectral weight. In the previous photoemission studies, the coherence temperature has been deduced from the line shape of the spectra Kaminski ; Hashimoto and has been found to increase monotonically with hole concentration, consistent with the prediction of the - model. In the present result, even though the nodal spectral weight is most coherent on the Fermi surface, the spectra become highly incoherent at high temperatures, also consistent with the RVB picture based on the - model.
In conclusion, we have performed a temperature-dependent angle-resolved photoemission spectroscopy study of the optimally doped tri-layer high- cuprates Bi2223 to investigate the temperature dependence of spectral weight in the nodal direction. In contrast to what is expected from BCS theory, all the results show an increase of spectral weight with decreasing temperature below , consistent with the theoretical prediction on correlated superconductors Chou and suggests a transition from the relatively incoherent metal to the relatively coherent superconductor across . The result indicates not only the change in the coherence at but also the rapid evolution of the coherence with decreasing temperature below .
We would like to thank fruitful and enlightening discussion with T.K. Lee, C.M. Ho, and C.P. Chou. ARPES experiments were carried out at HiSOR (Proposal No. 07-A-10, No. 08-A-35).
References
- (1) S. Hüfner, Photoelectron Spectroscopy, 3rd ed. (Springer, Berlin, 2003)
- (2) T. Yamasaki, K. Yamazaki, A. Ino, M. Arita, H. Namatame, M. Taniguchi, A. Fujimori, Z.-X. Shen, M. Ishikado, and S. Uchida, Phys. Rev. B 75, 140513 (2007)
- (3) C. P. Chou, T. Lee, and C. M. Ho, Physica C 69, 2993 (2008)
- (4) F. Carbone, A. B. Kuzmenko, H. J. A. Molegraaf, E. van Heumen, V. Lukovac, F. Marsiglio, D. van der Marel, K. Haule, G. Kotliar, H. Berger, S. Courjault, P. H. Kes, and M. Li, Phys. Rev. B 74, 064510 (2006)
- (5) M. Ortolani, P. Calvani, and S. Lupi, Phys. Rev. Lett. 94, 067002 (2005)
- (6) J. Hwang, J. Yang, T. Timusk, S. G. Sharapov, J. P. Carbotte, D. A. Bonn, R. Liang, and W. N. Hardy, Phys. Rev. B 73, 014508 (2006)
- (7) N. Bontemps, Physica C 460-462, 162 (2007)
- (8) S. Ideta, K. Takashima, M. Hashimoto, T. Yoshida, A. Fujimori, H. Anzai, T. Fujita, Y. Nakashima, A. Ino, M. Arita, H. Namatame, M. Taniguchi, K. Ono, M. Kubota, D. H. Lu, Z.-X. Shen, K. M. Kojima, and S. Uchida, Phys. Rev. Lett. 104, 227001 (2010)
- (9) C. M. Varma, P. B. Littlewood, S. Schmitt-Rink, E. Abrahams, and A. E. Ruckenstein, Phys. Rev. Lett. 63, 1996 (1989)
- (10) J. W. Allen, G.-H. Gweon, R. Claessen, and K. Matho, J. Phys. Chem. Solids 56, 1849 (1995)
- (11) J. Graf, C. Jozwiak, C. L. Smallwood, H. Eisaki, R. A. Kaindl, D.-H. Lee, and A. Lanzara, Nature Phys. 7, 805 (2011)
- (12) A. F. Santander-Syro, R. P. S. M. Lobo, N. Bontemps, W. Lopera, D. Giratá, Z. Konstantinovic, Z. Z. Li, and H. Raffy, Phys. Rev. B 70, 134504 (2004)
- (13) H. J. A. Molegraaf, C. Presura, D. van der Marel, P. H. Kes, and M. Li, Science 295, 2239 (2002)
- (14) T. A. Maier, M. Jarrell, A. Macridin, and C. Slezak, Phys. Rev. Lett. 92, 027005 (2004)
- (15) M. R. Norman, A. Kaminski, J. Mesot, and J. C. Campuzano, Phys. Rev. B 63, 140508 (2001)
- (16) A. Kaminski, S. Rosenkranz, H. M. Fretwell, Z. Z. Li, H. Raffy, M. Randeria, M. R. Norman, and J. C. Campuzano, Phys. Rev. Lett. 90, 207003 (2003)
- (17) M. Hashimoto, T. Yoshida, K. Tanaka, A. Fujimori, M. Okusawa, S. Wakimoto, K. Yamada, T. Kakeshita, H. Eisaki, and S. Uchida, Phys. Rev. B 79, 140502 (2009)