Millimeter-band variability of the radio-quiet nucleus of NGC 7469
Abstract
We report short-cadence monitoring of a radio-quiet (RQ) Active Galactic Nuclei (AGN), NGC 7469, at 95 GHz (3 mm) over a period of 70 days with the CARMA telescope. The AGN varies significantly ( from the mean) by a factor of two within 4-5 days. The intrinsic 95 GHz variability amplitude in excess of the measurement noise (10%) and relative to the mean flux is comparable to that in the X-rays, and much higher than at 8.4 GHz. The mm-band variability and its similarity to the X-ray variability adds to the evidence that the mm and X-ray emission have the same physical origin, and are associated with the accretion disk corona.
keywords:
Galaxies: active – Galaxies: nuclei – galaxies: jets – radio continuum: galaxies – X-rays: galaxies1 Introduction
Radio and mm-wave observations provide crucial information for our understating of accretion mechanisms and particle acceleration processes in Active Galactic Nuclei (AGN). The nature of accelerators in radio-loud (RL) AGN is known to be manifested by the collimated relativistic jets, launched from the innermost region close to the black hole accretion disk, and can extend up to Mpc scales. Conversely, for radio-quiet (RQ) AGN the origin of the radio emission is still unclear. In the past it was claimed that the presence or lack of relativistic jets is the reason for the RL/RQ dichotomy (e.g. Kellermann et al. 1994). The presence of pc-kpc scale extended radio emission in RQ AGN, which could be due to sub-relativistic velocities, complicates this distinction (e.g. Blundell et al. 1996; Nagar et al. 1999, 2000; Ulvestad et al. 2005). Whether there is a radio bimodality, or whether the radio luminosity distribution is continuous is still under debate (e.g. White et al. 2000).
Different origins have been proposed to account for the radio properties of RQ AGN: synchrotron radiation from down-scaled jets (Barvainis, Lonsdale & Antonucci, 1996; Gallimore et al., 2006; Orienti & Prieto, 2010); thermal emission/absorption from hot gas (Gallimore, Baum & O’Dea, 2004); synchrotron emission from an optically thick advection-dominated accretion flow (Doi et al., 2011); and coronal emission from magnetic activity above the accretion disk (Field & Rogers, 1993).
Laor & Behar (2008) investigated the origin of the radio emission in RQ AGN using the Palomar quasar sample. They demonstrated that their radio (at 5 GHz) and X-ray (0.2- 20 keV) luminosities are correlated and that they follow the well established correlation for coronally active cool stars (Guedel & Benz, 1993). This correlation over 20 orders of magnitude in luminosity suggests perhaps that the radio emission in RQ AGN is also related to coronal, magnetic activity similar to that of stars. In phenomena of magnetic reconnection, coronal mass ejections may be the origin for the extended radio emission in RQ AGN.
Radio monitoring of AGN in the cm band in the past decades mostly focused on RL AGN, and specifically on Blazars (e.g., Raiteri et al. 2008; Lister et al. 2009). Conversely, radio monitoring of RQ AGN is rare. Detected variability of RQ AGN is typically 50% at 5-15 GHz on a year time scale (Neff & de Bruyn, 1983; Wrobel, 2000; Mundell et al., 2009; Jones et al., 2011). Falcke et al. (2001) found that RQ AGN are more variable than RL AGN expect for Blazars, and that low-luminosity RQ AGN are among the most variable radio sources, likely due to the small black-hole mass/size.
The mm-band holds several advantages over the cm-band. First, mm-waves can probe a smaller region of emission due to the improving angular resolution with frequency for a given array. Moreover, synchrotron self absorption decreases with frequency. The size, therefore, of an opaque synchrotron source at 95 GHz is about 20 times smaller than at 5 GHz, and could vary 20 times faster. The rapid variability provides insight into the AGN core not accessible even to interferometric imaging. If the variability is related to the X-ray variability, it could indicate that the two emitting regions are spatially coincident.
The mm spectrum of AGN typically bridges the high radio frequency synchrotron emission from a jet/outflow and the low-frequency IR thermal dust emission. RQ AGN show either flat or inverted spectra at these high radio frequencies, suggesting optically-thick core emission (Doi et al., 2005, 2011). We recently found a 95 GHz excess of a factor of up to 7 with respect to the observed low-frequency steep spectra, for a sample of X-ray bright RQ AGN (Behar et al., 2015).
Little data are available on mm-band monitoring of RQ AGN. Worthy campaigns have been performed for the low-luminosity M 81 (Sakamoto et al., 2001; Schödel et al., 2007) and Centaurus A (Israel et al., 2008), which vary by a factor of a few on a day timescale. Sgr A∗ also features intraday variability of 40% in mm wavelengths (Miyazaki, Tsutsumi & Tsuboi, 2004; Lu et al., 2011; Dexter et al., 2014). Doi et al. (2011) found significant 3-mm variability within months of low-luminosity RQ AGN.
In this paper, we report results from a dedicated monitoring program of a RQ AGN with the CARMA telescope (the Combined Array for Research in Millimeter-wave Astronomy). We monitored NGC 7469 at 3-mm (95 GHz) over 70 days with periods of daily monitoring. As far as we know, this is the first time a RQ AGN was monitored so persistently at mm wavelengths. The paper is organized as follows. In Sect. 2 we describe the observations. In Sect. 3 we present the light curve and quantify the variability. In Sect. 4 we discuss the results and draw conclusions.
| Grade | Date | time | Flux calib | Fpeak | Ftot |
| Array C | |||||
| A- | 14MAR17 | 2.20 | Neptune | 3.110.30 | 7.73 |
| A- | 14MAR18 | 2.22 | MWC349 | 2.290.24 | 7.44 |
| A | 14MAR21 | 2.42 | MWC349 | 2.490.25 | 6.78 |
| B+ | 14MAR25 | 2.27 | Neptune | 2.880.28 | 7.89 |
| C+ | 14MAR27 | 2.40 | Neptune | 3.180.33 | 8.49 |
| A- | 14MAR28 | 2.38 | Neptune | 2.540.26 | 6.84 |
| C+ | 14MAR29 | 2.56 | Neptune | 2.430.27 | 8.54 |
| A- | 14MAR31 | 2.39 | Neptune | 3.110.30 | 7.73 |
| A- | 14APR01 | 2.19 | Neptune | 3.820.36 | 10.29 |
| C- | 14APR05 | 3.65 | Neptune | 2.740.32 | 7.96 |
| B+ | 14APR07 | 3.67 | Neptune | 3.420.28 | 8.43 |
| A- | 14APR11 | 2.42 | Neptune | 4.060.36 | 8.57 |
| C- | 14APR13 | 1.42 | Neptune | 3.310.44 | 10.69 |
| B+ | 14APR15 | 2.24 | MWC349 | 3.040.32 | 7.64 |
| A- | 14APR17 | 2.59 | Neptune | 3.080.35 | 8.20 |
| B | 14APR18 | 1.95 | Neptune | 3.050.41 | 7.18 |
| C+ | 14APR20 | 2.32 | Neptune | 2.170.33 | 7.64 |
| A- | 14APR21 | 2.35 | Neptune | 3.270.35 | 8.05 |
| Array D | |||||
| B+ | 14APR27 | 2.34 | Neptune | 6.440.85 | 13.01 |
| A- | 14APR28 | 2.37 | Neptune | 6.800.80 | 12.47 |
| B- | 14MAY06 | 2.86 | Neptune | 6.630.49 | 14.82 |
| B- | 14MAY20 | 2.83 | Neptune | 5.960.43 | 12.62 |
| A- | 14MAY25 | 1.39 | Neptune | 6.350.43 | 13.83 |
Column description: (1) dataset grade, (2) observation date, (3) total observation time on NGC 7469 in hours, (4) flux calibrator, (5) peak flux from the gaussian fit in mJy/beam for NGC 7469, (6) total integrated flux in mJy for the NGC 7469.
2 Observations
NGC 7469 ( Mpc) was drawn from a recent AGN sample selected based on the high X-ray brightness and documented variability (Behar et al., 2015). It was chosen for intense monitoring, because it is one of the brightest targets in the sample. Its 95 GHz flux density is in excess () over the steep spectrum at low-radio frequencies (see Behar et al., 2015). Pérez-Torres & et al. (2009) reported seven 8.4-GHz observations of NGC 7469 over 8 years and its radio core (05) flux density was consistently between 12-13 mJy, i.e., no significant variability.
We observed continuum emission in the 3 mm (95 GHz) window from the nucleus of NGC 7469 with the CARMA telescope. CARMA is a 15 element interferometer consisting of nine 6.1 meter antennas and six 10.4 meter antennas, located in California (USA). We monitored NGC 7469 over a period of 70 days with a cadence ranging from 1 day to a few days. We obtained a total of 38 flux measurements, 29 and 9, in the C- and D- array configuration respectively, reaching an angular resolution of 22, and 55, respectively.


Only observations with a weather grade of C or better (Table 1) are used, in order to ensure low noise in the final maps. Furthermore, some observations were not usable due to telescope internal failures, and to target pointing that was too short. Effectively, 23 observations (18+5 in the two configurations) of NGC 7469 are used in our analysis and listed in Table 1. Absolute flux calibrators were used at the beginning of each observation track, and are also listed in Table 1.
The MIRIAD software package (Sault, Teuben & Wright, 1995) was used to reduce the visibility data, including flagging data affected by shadowed antennas, poor weather or antenna malfunctions. The observing sequence was to integrate on a phase calibrator for 2 minutes and on the primary target for 15 minutes. This cycle was repeated 10-12 times for a total of 4 hours for each observation. The passband and gain calibrator was 3C 454.3. We also observed a secondary target, 2218-035, a RL quasar, for comparison to make sure the variability of NGC 7469 is genuine. We performed self-calibration of the data, which turned out to be unnecessary, as it changed the flux by not more than 7%. The amplitude solutions show a constant pattern across the baselines ranging between 0-110 kilo, which is a sign of the presence of a point-source. The phase solutions are stable in the range of independent of the baselines. The phase and amplitude solutions were applied to the targets using standard procedures. The maps were obtained by inverting and cleaning with a natural weight of the visibility data (robustness parameter = 2). Different robustness parameters (in the standard range of [-2,2]) produce final maps differing by not more than 5% in the point-source flux. Finally, using the MIRIAD imfit package we measured the flux using a point-source gaussian fit. The observation log and flux density measurements are given in Table 1.
3 RESULTS
The 95 GHz maps of NGC 7469 with 22 and 55 beams are shown in Fig. 1. There is a hint of a slight elongation of the AGN point source towards the NW, which is reminiscent of the radio extension observed also at 5 and 8.5 GHz on a scale of 10″ in the same direction (Condon, 1980; Ulvestad, Wilson & Sramek, 1981; Kukula et al., 1995). We perform a gaussian fit to the source and measure the peak flux, which corresponds to the point-source flux (mJy/beam), and then we measure the total integrated flux for the extended emission. The mean peak flux is 3.0 and 6.4 mJy, respectively for the C and D arrays. This is typically 1/3, and 1/2 of the total integrated flux, in the two arrays (Table 1). This means that part of the peak flux includes unresolved extended emission, which will dilute the genuine core variability.
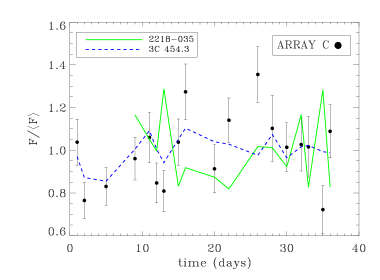
The 95 GHz light curve of NGC 7469 is shown in the left panel of Figure 2. The peak flux ranges between 24 mJy in the C-array, and between 67 mJy in D (Table 1), which correpsond to luminosity range, 39.0639.61 erg s-1. The factor of 2 difference in the two configuration fluxes is due to the different beam sizes. Hence, we hereafter treat the fluxes obtained with the two arrays separately. The right panel of Figure 2 shows the peak-flux light curve normalized to the average for the C array only. Variability of up to a factor of 2 (30% amplitude) is observed. The variability amplitude of the total flux (not shown) is only 20% that of the peak flux, as the core gets diluted by extended, steady emission. For the same reason, no variability can be detected in the D array.
In the right panel of Fig. 2, the blue dashed line represents the flux-to-mean ratio of the bandpass calibrator, 3C 454.3, which is a flat-spectrum radio quasar known to vary on year/month scale (Villata et al., 2009). Indeed, its fluctuations in Fig. 2 are only 10% those of NGC 7469. The green solid line represents the secondary target, 2218-035. The variability of 3C 454.3 and of 2218-035 is much less significant than that of NGC 7469, as quantified in the following section. More importantly, their trends are generally different from how NGC 7469 varies, which lends to the authenticity of the variability of NGC 7469.
Interestingly, the strongest peak flux variability by a factor of 2 occurs within 4-5 days. This suggests a 95-GHz source size of no more than 4-5 light days, or 0.004 pc, which is still 10 times larger than the minimal physical size estimated from the luminosity of a self absorbed synchrotron source (i.e., radio-sphere, Behar et al., 2015).

3.1 Statistical tests of variability
In order to quantify the 95-GHz variability pattern of NGC 7469 we performed several tests, all of which confirm the source is significantly variable.
3.1.1
We calculate the Fractional variability (e.g. Edelson & et al., 2002; Vaughan et al., 2003) of the 95 GHz light curve of NGC 7469. quantifies the intrinsic variability amplitude in excess of the measurement uncertainties, and relative to the mean source flux density:
| (1) |
where is the variance of the light curve, is the mean squared measurement uncertainty, and is the mean flux density (count rate is used in X-rays). The error on for flux measurements can be defined as
| (2) |
For the 18 data points in the C-array light curve measured over 36 days we obtain (95 GHz) = 2.5%. This is remarkably similar to (2-12 keV)= 16.0%0.4% measured in the X-rays for NGC 7469 over 36 days by Markowitz & Edelson (2004), using light curves from the RXTE telescope. On shorter time scales of 6 and 1 days, they measured (2-12 keV) = 12.3%0.4% and 7.5%1.0%, respectively. In all cases, these values are a few percent less (more), when measured separately for the soft (hard) X-ray band. We measure (95 GHz) over 6 days to be 6.3%, which is consistent with the X-ray value. This value (and error) is a weighted mean of five 6-day periods during our campaign that had at least 4 observations each. The small number of data points does not support calculating for the D-array.
The estimator is similar to the De-biased Variability Index DVI ( = , Akritas & Siebert, 1996). For the C-array observations . This is consistent with the DVI measured for most RQ quasars, i.e., DVI 10% at 8.5 GHz and DVI 30% at 15 GHz (Akritas & Siebert, 1996). We also measured (95 GHz) for the bandpass calibrator and the secondary target. Their values are consistent with 0%, taking into account the measurement uncertainties, which provides further evidence for the genuine variability of NGC 7469.
3.1.2 Fitting the u-v data
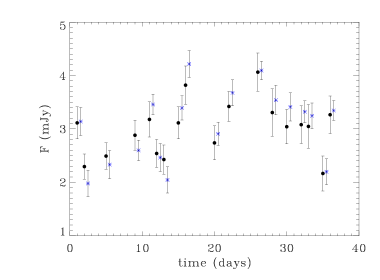
In order to double check the robustness of the flux measurements and variability we also fitted the visibility data in the C array for a gaussian point source directly in the u-v plane, by using the AIPS111The NRAO Astronomical Image Processing System (AIPS) is a package to support the reduction and analysis of data taken with radio telescopes. uvfit task. This fitting procedure tool finds a component, unresolved at 2″, located at the position of the core. The flux densities of this component are consistent with the values obtained from the cleaned maps (Table 1) within 15%. This consistency is demonstrated in Figure 3. When the flux increases/decreases in the clean images, it also increases/decreases in the u-v Gaussian fitting with similar amplitudes. Consequently, in the uv-fitted light curve, which is consistent with the value measured from the cleaned maps.
We carried out one final test for the validity of the variability, and its independence of the precise unresolved point-source structure. We repeated the uvfit gaussian fitting task, but now using only the baselines larger than 50 kilo, which is half of the available u-v range. Since the long baselines probe small angular scales, this procedure allows us to verify whether the emission is dominated by the unresolved core. The flux densities obtained are again consistent with those measured from the cleaned maps to within 15%. This confirms that the compact core of NGC 7469 dominates the fitted gaussian flux, and is the variable component. All these tests confirm the genuine variability of NGC 7469.
3.1.3
Another variability estimator commonly used for gamma- and X- ray variability (Paolillo et al., 2004; Young et al., 2012; Lanzuisi et al., 2014) is
| (3) |
where and are each flux density measurement and its associated uncertainty. and are as before. This value tests how significantly the light curve differs from a constant. For an intrinsically non-variable source, the value of is expected to be (i.e., ). The advantage of this estimator is that a probability can be associated with the light curve being variable, i.e., rejection of the null-hypothesis. is considered significance evidence for variability. The C-array light curve of Fig. 2 is variable at a confidence level of 99.9817%. Furthermore, we iteratively excluded each single data point and re-calculated to make sure the value is not affected by a single (bad) point. The confidence level for positive variability remains always , confirming that NGC 7469 is significantly variable at 95 GHz.
4 Summary and Conclusions
The nucleus of NGC 7469 has been detected with the CARMA telescope at 95 GHz in 23 epochs over a period of 70 days, which is the most intensive short-cadence monitoring of a RQ AGN to date. The 95 GHz light curve of NGC 7469 is variable with an amplitude of up to 30% (6 from the flux maximum to the minimum) from the mean. The source shows a rapid flux variation of a factor 2 in 4-5 days. If we consider the 95-GHz flux density of 5.00.2 mJy from Behar et al. (2015) observed with the same CARMA (C) array in November 2013, the source varied by a factor of 1.7 in four months. This variability amplitude of NGC 7469 at 95 GHz is larger and on shorter time scales than that reported at 8.4 GHz by Pérez-Torres & et al. (2009) for the same AGN with annual monitoring over 8 years. The 95-GHz fractional variability amplitude is consistent within the errors with the X-ray value and, moreover, the time scale for variability in the two bands is similar, i.e., of the order of 1 day. In conclusion, we statistically confirmed that NGC 7469 has a variable core at 95 GHz.
The variability and the radio-sphere size ( pc) are consistent with a compact core akin to the X-ray source. The 95-GHz to X-ray (2-10 keV) luminosity ratio ()222We use an X-ray (2-10 keV) luminosity LX = 1.51043 erg s-1 from Shu, Yaqoob & Wang (2010). is consistent with the Guedel & Benz relation for cool stars, but much lower than for RL AGN. These anlaogies point to the picture of a magnetically heated corona being responsible for the 95 GHz emission for our object. A model of a very hot ( K) magnetically confined corona over the accretion disk, similar to the observed structure of the solar corona was postulated by Galeev, Rosner & Vaiana (1979). Phenomena of magnetic reconnection in the corona would produce both X-ray and radio emission, as well as coronal mass ejections, like in active stars, and could produce the extended radio emission observed in RQ AGN. The base for these moderately accelerated and not well collimated outflows could be the accretion disk corona in X-ray binaries and AGN (Markoff, Nowak & Wilms, 2005; Liu et al., 2014).
The ultimate test of the coronal conjecture is simultaneous mm/X-ray monitoring. Clearly, the present study needs to be complemented and further expanded with the high-sensitivity and high-resolution radio telescopes, e.g. ALMA, IRAM, and later SKA. Temporal correlation between the X-ray and radio/mm light curves from RQ AGN, as the Neupert effect seen in coronally active stars (Neupert, 1968), would be the smoking gun of coronal radio emission.
Acknowledgments
This research is supported by the I-CORE program of the Planning and Budgeting Committee and the Israel Science Foundation (grant numbers 1937/12 and 1163/10), and by a grant from Israel’s Ministry of Science and Technology. RDB was supported at the Technion by a fellowship from the Lady Davis Foundation. RDB thanks the referee for the comments which help to confirm the genuine variability of the target. We also thank the helpful discussion with C. M. Raiteri, A. Capetti, and I. McHardy. E.B. received funding from the European Unions Horizon 2020 research and innovation programme under the Marie Sklodowska-Curie grant agreement No 655324.
This work was carried out with the CARMA telescope. construction was derived from the states of California, Illinois, and Maryland, the James S. McDonnell Foundation, the Gordon and Betty Moore Foundation, the Kenneth T. and Eileen L. Norris Foundation, the University of Chicago, the Associates of the California Institute of Technology, and the National Science Foundation.
References
- Akritas & Siebert (1996) Akritas M. G., Siebert J., 1996, MNRAS, 278, 919
- Barvainis, Lonsdale & Antonucci (1996) Barvainis R., Lonsdale C., Antonucci R., 1996, AJ, 111, 1431
- Behar et al. (2015) Behar E., Baldi R. D., Laor A., Horesh A., Stevens J., Tzioumis T., 2015, MNRAS, 451, 5036
- Blundell et al. (1996) Blundell K. M., Beasley A. J., Lacy M., Garrington S. T., 1996, ApJ, 468, L91
- Condon (1980) Condon J. J., 1980, ApJ, 242, 894
- Dexter et al. (2014) Dexter J., Kelly B., Bower G. C., Marrone D. P., Stone J., Plambeck R., 2014, MNRAS, 442, 2797
- Doi et al. (2005) Doi A., Kameno S., Kohno K., Nakanishi K., Inoue M., 2005, MNRAS, 363, 692
- Doi et al. (2011) Doi A., Nakanishi K., Nagai H., Kohno K., Kameno S., 2011, AJ, 142, 167
- Edelson & et al. (2002) Edelson R., et al., 2002, ApJ, 568, 610
- Falcke et al. (2001) Falcke H., Lehár J., Barvainis R., Nagar N. M., Wilson A. S., 2001, in Astronomical Society of the Pacific Conference Series, Vol. 224, Probing the Physics of Active Galactic Nuclei, p. 265
- Field & Rogers (1993) Field G. B., Rogers R. D., 1993, ApJ, 403, 94
- Galeev, Rosner & Vaiana (1979) Galeev A. A., Rosner R., Vaiana G. S., 1979, ApJ, 229, 318
- Gallimore et al. (2006) Gallimore J. F., Axon D. J., O’Dea C. P., Baum S. A., Pedlar A., 2006, AJ, 132, 546
- Gallimore, Baum & O’Dea (2004) Gallimore J. F., Baum S. A., O’Dea C. P., 2004, ApJ, 613, 794
- Guedel & Benz (1993) Guedel M., Benz A. O., 1993, ApJ, 405, L63
- Israel et al. (2008) Israel F. P., Raban D., Booth R. S., Rantakyrö F. T., 2008, A&A, 483, 741
- Jones et al. (2011) Jones S., McHardy I., Moss D., Seymour N., Breedt E., Uttley P., Körding E., Tudose V., 2011, MNRAS, 412, 2641
- Kellermann et al. (1994) Kellermann K. I., Sramek R. A., Schmidt M., Green R. F., Shaffer D. B., 1994, AJ, 108, 1163
- Kukula et al. (1995) Kukula M. J., Pedlar A., Baum S. A., O’Dea C. P., 1995, MNRAS, 276, 1262
- Lanzuisi et al. (2014) Lanzuisi G. et al., 2014, ApJ, 781, 105
- Laor & Behar (2008) Laor A., Behar E., 2008, MNRAS, 390, 847
- Lister et al. (2009) Lister M. L. et al., 2009, AJ, 137, 3718
- Liu et al. (2014) Liu T., Wang J.-X., Yang H., Zhu F.-F., Zhou Y.-Y., 2014, ApJ, 783, 106
- Lu et al. (2011) Lu R.-S. et al., 2011, A&A, 525, A76
- Markoff, Nowak & Wilms (2005) Markoff S., Nowak M. A., Wilms J., 2005, ApJ, 635, 1203
- Markowitz & Edelson (2004) Markowitz A., Edelson R., 2004, ApJ, 617, 939
- Miyazaki, Tsutsumi & Tsuboi (2004) Miyazaki A., Tsutsumi T., Tsuboi M., 2004, ApJ, 611, L97
- Mundell et al. (2009) Mundell C. G., Ferruit P., Nagar N., Wilson A. S., 2009, ApJ, 703, 802
- Nagar et al. (2000) Nagar N. M., Falcke H., Wilson A. S., Ho L. C., 2000, ApJ, 542, 186
- Nagar et al. (1999) Nagar N. M., Wilson A. S., Mulchaey J. S., Gallimore J. F., 1999, ApJS, 120, 209
- Neff & de Bruyn (1983) Neff S. G., de Bruyn A. G., 1983, A&A, 128, 318
- Neupert (1968) Neupert W. M., 1968, ApJ, 153, L59
- Orienti & Prieto (2010) Orienti M., Prieto M. A., 2010, MNRAS, 401, 2599
- Paolillo et al. (2004) Paolillo M., Schreier E. J., Giacconi R., Koekemoer A. M., Grogin N. A., 2004, ApJ, 611, 93
- Pérez-Torres & et al. (2009) Pérez-Torres M. A., et al., 2009, MNRAS, 399, 1641
- Raiteri et al. (2008) Raiteri C. M. et al., 2008, A&A, 480, 339
- Sakamoto et al. (2001) Sakamoto K., Fukuda H., Wada K., Habe A., 2001, AJ, 122, 1319
- Sault, Teuben & Wright (1995) Sault R. J., Teuben P. J., Wright M. C. H., 1995, in Astronomical Society of the Pacific Conference Series, Vol. 77, Astronomical Data Analysis Software and Systems IV, p. 433
- Schödel et al. (2007) Schödel R., Krips M., Markoff S., Neri R., Eckart A., 2007, A&A, 463, 551
- Shu, Yaqoob & Wang (2010) Shu X. W., Yaqoob T., Wang J. X., 2010, ApJS, 187, 581
- Ulvestad, Wilson & Sramek (1981) Ulvestad J. S., Wilson A. S., Sramek R. A., 1981, ApJ, 247, 419
- Ulvestad et al. (2005) Ulvestad J. S., Wong D. S., Taylor G. B., Gallimore J. F., Mundell C. G., 2005, AJ, 130, 936
- Vaughan et al. (2003) Vaughan S., Edelson R., Warwick R. S., Uttley P., 2003, MNRAS, 345, 1271
- Villata et al. (2009) Villata M. et al., 2009, A&A, 504, L9
- White et al. (2000) White R. L. et al., 2000, ApJS, 126, 133
- Wrobel (2000) Wrobel J. M., 2000, ApJ, 531, 716
- Young et al. (2012) Young M. et al., 2012, ApJ, 748, 124