Submillimeter Observations of CLASH 2882 and the Evolution of Dust in this Galaxy
Abstract
Two millimeter observations of the MACS J1149.6+2223 cluster have detected a source that was consistent with the location of the lensed MACS1149-JD galaxy at . A positive identification would have rendered this galaxy as the youngest dust forming galaxy in the universe. Follow up observation with the AzTEC 1.1 mm camera and the IRAM NOrthern Extended Millimeter Array (NOEMA) at 1.3 mm have not confirmed this association. In this paper we show that the NOEMA observations associate the 2 mm source with [PCB2012] 2882111111[PCB2012] 2882 is the NED-searchable name for this source., source number 2882 in the Hubble Space Telescope (HST) Cluster Lensing and Supernova (CLASH) catalog of MACS J1149.6+2223. This source, hereafter referred to as CLASH 2882, is a gravitationally lensed spiral galaxy at . We combine the GISMO 2 mm and NOEMA 1.3 mm fluxes with other (rest frame) UV to far-IR observations to construct the full spectral energy distribution (SED) of this galaxy, and derive its star formation history, and stellar and interstellar dust content. The current star formation rate of the galaxy is 54 yr-1, and its dust mass is about , where is the lensing magnification factor for this source, which has a mean value of 2.7. The inferred dust mass is higher than the maximum dust mass that can be produced by core collapse supernovae (CCSN) and evolved AGB stars. As with many other star forming galaxies, most of the dust mass in CLASH 2882 must have been accreted in the dense phases of the ISM.
Subject headings:
galaxies:general — galaxies: individual ([PCB2012] 2882) — dust, extinction — infrared: galaxies — submillimeter: galaxies1. INTRODUCTION
Deep 2 mm observations of the MACS J1149.6+2223 cluster field with the Goddard IRAM 2 Millimeter Observer (GISMO) revealed a 2 mm source (Staguhn et al., 2014) that was consistent with the position of the gravitationally lensed galaxy MACS1149-JD located at (Zheng et al., 2012). Assuming the validity of this association, Dwek et al. (2014) analyzed the dust formation and destruction rates that are unique to the very high redshift universe. An important general result of their study was that in high redshift galaxies with dust-to-gas mass ratios below a critical value of , and hence metallicities below , supernova are net producers of interstellar dust, so that the net rate of dust formation in such galaxies exceeds that in older, more metal-rich, objects.
However, imaging from the Herschel Lensing Survey (Egami et al., 2010) indicated that the FIR flux may instead originate from one of two galaxies at , also within the GISMO 17.5″ beam [see cautionary note Dwek et al. (2014)]. Follow up observations with the AzTEC 1.1 mm camera mounted on the Large Millimeter Telescope Alfonso Serrano, provided an image of the MACS1149-JD field with 8.5″ resolution Zavala et al. (2015). Their observations detected a 3.5 source consistent with the GISMO position, associated with a group of galaxies located 11″ away from MACS1149-JD source. Five sources with redshifts between 0.7-1.6, that were detected in CLASH survey of this field (Postman et al., 2012), are within the AzTEC beam, preventing the definitive association of the GISMO source with an individual galaxy.
In this paper we present a 1.3″ resolution image of the 33″ 33″ field centered around MACS1149-JD obtained at 1.3 mm with the NOEMA. The image shows a 4 source, located within the AzTEC beam, that is positively identified with CLASH 2882, a galaxy at a redshift of 0.99. We combine the GISMO 2 mm observations with the UV-optical (UVO) to far-infrared (IR) and submillimeter observations to construct the spectral energy distribution (SED) of the stellar and dust emission components of the galaxy.
This paper is organized as follows. The observations are presented in Section 2. The galaxy’s SED is used to derive its dust mass and possible composition, and its current star formation rate (SFR) and possible star formation history (SFH). The results are presented in Section 3. In Section 4 we discuss the maximum attainable dust mass from stellar sources alone, and compare it with the dust masses inferred from the observations. The origin of the dust and a brief summary of the paper are presented in Sections 5 and 6, respectively.
In all our calculations we adopt a Hubble constant of 70 km s-1 Mpc-1, and values of , and for the critical densities of dark matter and dark energy, respectively (Hinshaw et al., 2009). The age of CLASH 2882, taken to be at , is 6 Gyr, its distance is 6,750 Mpc, and its angular diameter distance, defined as the ratio between the galaxy’s transverse size to its angular size (in radians), is 1,700 Mpc.
2. Observations of CLASH 2882
Given the importance of identifying the counterpart to the 2 mm GISMO source, we targeted the field of MACS1149-JD using the NOEMA on December 30, 2014, and January 1, 2015 (program: W14FP, PI: Staguhn). The array operated in compact (7D) configuration. The tuning frequency (231.86 GHz) was chosen to encompass the [NII] 122m line in the redshift range . The pointing center was set on the coordinates of the NIR emission of MACS1149-JD (Zheng et al., 2012). At the observing frequency, the primary beam of NOEMA is 21.7″. The data processing was performed with the latest version of the GILDAS suite, in particular with CLIC for the calibration and flagging, and with MAPPING for the imaging. The final data cube consists of 8784 visibilities (7.32 hr of integration, 6-antennas equivalent). We reached a sensitivity of 1.05 mJy/beam per 50 km/s wide channel, or 103 Jy/beam in the collapsed continuum map (at 1-). The synthesized beam is 2.2″1.5″, PA=.
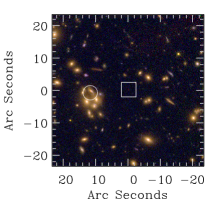
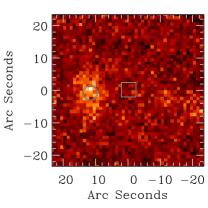
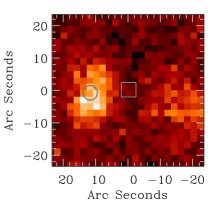
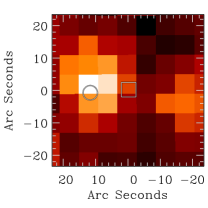
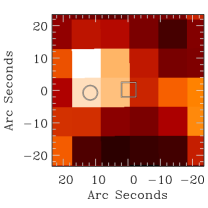
The image of the field, centered on the MACSJ1149-JD source, is presented in Figure 1a. MACSJ1149-JD is marked with a square. The most prominent source in the field (marked by a circle) is associated with CLASH 2882. Figure 1b is the HST image of the same field at 1.60, 1.05, and 0.555 m. Figures 1c-f, show the Herschel PACS and SPIRE images at 100, 160, 250, and 350 m, respectively, observed as part of the Herschel Lensing Survey (Egami et al., 2010) (Rawle 2015, in preparation).
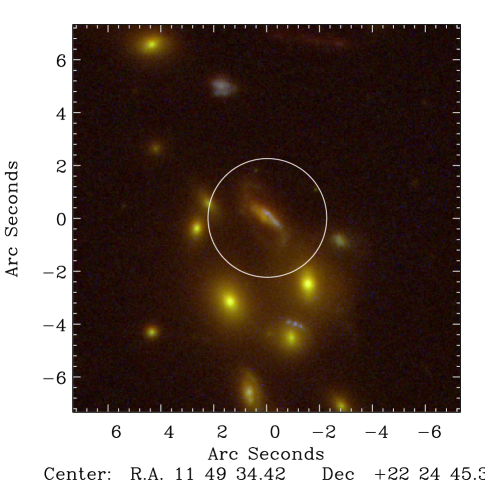
Figure 2 is a more detailed view of the HST image of CLASH 2882. The galaxy appears redder than the other sources in the group. The map also shows a population of blue stars at the south-western end of this galaxy, representing a region of unobscured star formation that may, or may not, be associated with CLASH 2882.
CLASH 2882 is lensed by the MACSJ1149.5+2223 cluster at . Using the Frontier Fields Lens Models121212https://archive.stsci.edu/prepds/frontier/lensmodels/ we find that the median lensing amplification factor ranges from 1.61 to 4.21, with a average value of .

3. The Dust and Stellar Contributions to the galaxy’s SED
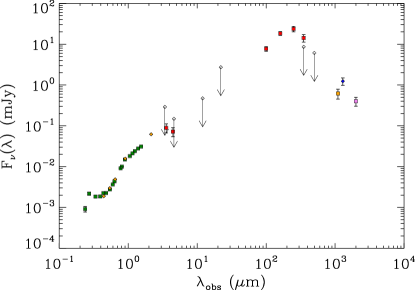
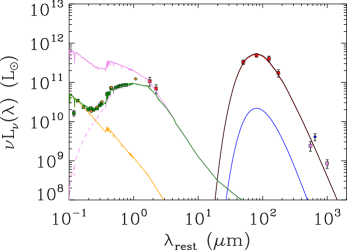
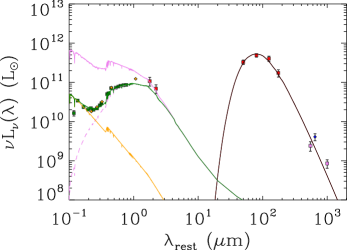
Figure 3 presents the observed flux densities from the source, which are tabulated and referenced in Table 1. The spectral energy distribution comprises of three distinct contributions: thermal emission from dust at wavelengths above m; an obscured stellar population from 0.4 to 2 m; and a population of unobscured young blue stars from to 0.4 m. The fits to the dust and stellar components of the SED are described in the following subsections.
3.1. The Dust Emission Component
We assumed that the mid-IR to submm emission arises from astronomical silicate and amorphous carbon (AC) grains, with optical constants given by Zubko et al. (2004). Model parameters were the silicate and AC dust masses, and , and their respective temperatures, and . We varied dust masses from to , and solved for the dust temperatures that gave the best fits to observed IR fluxes, ignoring upper limits.
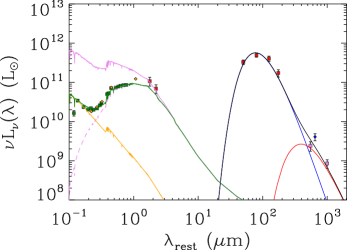
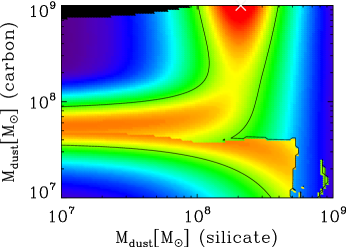
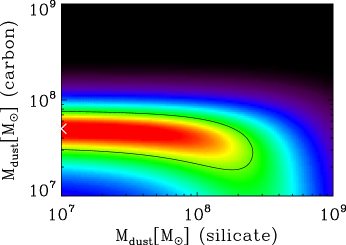
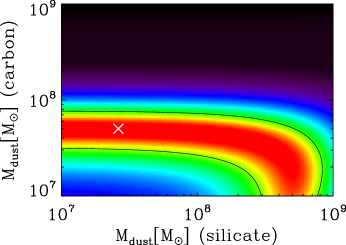
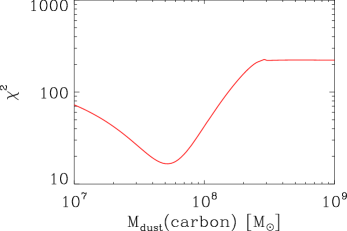
The results of the fit are given in Figure 4. The left column presents the fits to the SED, and the top left panel presents an unconstrained fit to the dust spectrum with silicate and AC dust masses and temperatures as free parameters. The mid– to far–IR spectra are readily fit with 30 K silicate dust, however the steep falloff in the silicate emissivity failed to fit the millimeter fluxes. These were fit with a very cold, K, AC dust component. We consider this fit to be physically unrealistic, because of the large of AC dust needed to fit the spectrum, and the large disparity between the silicate and AC dust temperatures. Exposed to a radiation field similar to that in the diffuse ISM of the Galaxy, AC dust will attain a somewhat higher temperature than that of the silicates, with a ratio of / (Zubko et al., 2004). We therefore calculated the best fits to the far–IR mm spectrum, constraining the AC-to-silicate dust temperature to be 1.3. To test the dependence of the derived dust masses and temperatures on this ratio, we also considered a dust model with a / ratio of 2.0. The resulting fits are shown in the left column of the second and third rows of the figure. The left panel in the last row presents the fit to the spectrum with a single AC dust component.
The right column in the figure shows the maps (figure) of as a function of dust masses (mass). When the temperatures of the different dust components are unconstrained (top row of the figure), the best fit is obtained with hot silicate and very cold AC dust, radiating close to the lower limit of K imposed by the cosmic microwave background at that redshift. When the relative dust temperatures are constrained to more realistic values (second and third rows), the maps show that the AC dust mass is well determined to be around , whereas the silicate mass can vary substantially without significantly affecting the goodness of the fit to the data. This is a direct result of the temperature constraints and the differences between the spectral behavior of the emissivity of the two dust components. Because of its higher temperature, the AC dust provides a good fit to the SED at the shortest IR wavelengths, and dominates the emission at all other wavelengths. Consequently its mass is well defined. The emission from the silicate dust component is only a secondary contributor to the observed SED, and its temperature decreases with increasing AC dust temperatures, in order to fit the long wavelength emission. The resulting 30% variation in silicate temperatures causes the mass of the silicate dust to vary by factors of 5. In contrast, there is very little variation in the AC dust temperature (%) resulting in less than a factor of 1.4 variation in their dust mass.
Overall, the minimum value of for all cases is around 16 with 3 degrees of freedom, which is formally a poor fit to the data. This is largely due to the fact that the 1.1 and 1.3 mm data points are inconsistent with a declining spectrum, and that the GISMO 2 mm flux may contain the contribution of other galaxies from within the large beam. Eliminating the 1.1 and 1.3 mm data points will reduce the value of to about 1.8 for 1 degree of freedom, which is a marginally acceptable fit to the data.
Dust masses, temperatures, and luminosities are presented in Table 2.
3.2. The Stellar Emission Component
To model the stellar emission component we adopted a star formation history (SFH) characterized by a delayed exponential function with a characteristic timescale of the form: which, normalized to a SFR of at time , can be written as:
| (1) |
where is the SFR at time Gyr, the age of CLASH 2882 at .
We used the population synthesis code PEGASÉ (Fioc & Rocca-Volmerange, 1997) with a Kroupa IMF (Kroupa, 2001) to calculate the intrinsic stellar spectrum, and adopted the Calzetti attenuation law (Calzetti et al., 2000) to calculate the stellar radiation that escapes the galaxy, and the radiation that is absorbed by the dust. The current SFR was determined from the total bolometric luminosity, and was found to be equal to yr-1. A good fit to the observed stellar component was obtained for values of Gyr, and . The values of the intrinsic stellar luminosity, , the escaping stellar luminosity, , and the stellar luminosity absorbed by the dust, , are listed in Table 3. The value of the absorbed stellar luminosity, , is somewhat larger than the calculated IR luminosity, which is about . The fractional difference of 18% is consistent with the missing luminosity from the mid–IR region, if CLASH 2882 had an Arp220–like SED. The warm dust that emits at mid–IR wavelengths makes a small contribution to the total IR luminosity, and a negligible one to the dust mass. The stellar emission component is therefore consistent with the dust emission component.
The rising stellar SED in the m region was modeled by a 100 Myr burst, with a SFR of 4 yr-1. The total burst luminosity and stellar mass are also listed in Table 3.
The specific SFR (sSFR), defined as , is equal to yr-1, or equivalently, the specific timescale for star formation, , defined as the inverse quantity, is equal to 2.3 Gyr. The value of the sSFR is larger than that expected from a galaxy with a stellar mass of (Bauer et al., 2005). Alternatively, the value of is much shorter than the age of the galaxy, suggesting that most stars formed in a recent episode of star formation.
4. The Equilibrium Dust Mass in Galaxies
The mass of dust in galaxies is determined by the rates of dust injection into the ISM by AGB stars and core collapse supernovae (CCSN), and by their destruction rate by supernova remnants (SNRs)in the interstellar medium (ISM), and can be calculated by detailed evolutionary models, such as those presented by Dwek (1998) and (Dwek & Cherchneff, 2011). If the SFR has been constant over the lifetime of the dust, , then the equilibrium dust mass dust mass is given by:
| (2) |
where is death rate of the dust producing sources {AGB,CCSN}, and is their average dust yield. The dust lifetime is given by (Dwek et al., 1980):
| (3) |
where is the total mass of ISM gas, is the effective mass of gas that is completely cleared of dust by a single SNR, and is the rate of core collapse and Type Ia SNe. The equilibrium dust mass can then be explicitly written as:
| (4) |
The ratios depend only on the stellar IMF so that given a dust yield in the different stellar sources, the equilibrium dust mass primarily depends on the available ISM mass, and the mass of gas cleared of dust by each SNR.
5. The Origin of the Dust in CLASH 2882
The ratio of Type Ia to CCSN in the solar neighborhood is about 0.20 (Tammann et al., 1994; Cappellaro, 1996) giving an / ratio of 0.8. For a Kroupa IMF, the death rate of low mass carbon stars is 6 times higher than the total SN rate, giving / .
For simplicity we will assume that all the silicate dust is produced in CCSN with average yields of 0.1 , based on observations of the Crab Nebula and Cas A (Temim & Dwek, 2013; Arendt et al., 2014). Carbon dust is made in the outflows from AGB stars in the 1.4 to 4.0 mass range, with average yields of (Ferrarotti & Gail, 2006; Zhukovska et al., 2008; Nanni et al., 2013).
The value of was recently calculated for a range of ISM densities, interstellar magnetic field intensities, and SN explosion energies, and found to be , depending on these values (Slavin et al., 2015).
So the equilibrium dust mass in galaxies is approximately given by:
| (5) |
If we use an ISM mass of for the Milky Way, then the equilibrium dust mass is only , considerably lower than the inferred from dust models (e.g. Zubko et al., 2004). This discrepancy reflects the fact we only considered stellar sources of interstellar dust, while detailed chemical evolution models suggest that most of the Galactic dust must have been reconstituted in the dense ISM (Dwek & Scalo, 1980; Dwek, 1998; Zhukovska & Gail, 2007; Calura et al., 2010).
The ISM mass in CLASH 2882 is unknown, but if we adopt the stellar mass of as an upper limit on the gas mass, then the upper limit on the equilibrium dust mass becomes , a factor of at least 5 times lower than that derived from fitting the far-IR emission, independent of the lensing magnification. The underlying reason for this discrepancy is that the dust production rates in stellar sources (CCSNe and AGB stars) are significantly lower than their destruction rates by SNR in the ISM. The situation in CLASH 2882 is therefore similar to that in the Milky Way, and the Magellanic Clouds and other external galaxies, in which the dust production rates are significantly lower than their destruction rates (Dwek, 1998; Dwek et al., 2007; Dwek & Cherchneff, 2011; Gall et al., 2011; Valiante et al., 2011; Michałowski et al., 2010; Slavin et al., 2015; Temim et al., 2015; Rowlands et al., 2014; Michałowski, 2015). A significantly lower destruction efficiency is required to balance the dust production and destruction rates in the ISM. Alternatively, grain growth by accretion onto the cores of surviving grains, as originally suggested for the Milky Way (Dwek & Scalo, 1980; Draine, 2009), may be an additional source of interstellar dust in CLASH 2882.
6. Summary
CLASH 2882 is a star forming galaxy at with a current SFR of 54 yr-1, a total stellar mass of , a sSFR of yr-1, and a total dust mass of , where the mean value of is 2.7. The inferred dust mass is higher than the upper limit on the equilibrium dust mass from stellar sources. Similarly to many other star forming galaxies, the dust mass in CLASH 2882 cannot be accounted for by formation in CCSN and AGB stars, requiring the need to grow most of the dust in the dense phases of the ISM.
| Wavelength (m) | Flux (mJy) | Reference |
|---|---|---|
| 0.237 | 0.00091 0.00014 | 0 |
| 0.271 | 0.00217 0.00015 | 0 |
| 0.336 | 0.00184 0.00012 | 0 |
| 0.392 | 0.00185 0.00007 | 0 |
| 0.436 | 0.00224 0.00008 | 0 |
| 0.442 | 0.00188 0.00001 | 1 |
| 0.478 | 0.00225 0.00007 | 0 |
| 0.540 | 0.00297 0.00001 | 1 |
| 0.541 | 0.00275 0.00005 | 0 |
| 0.596 | 0.00364 0.00005 | 0 |
| 0.632 | 0.00434 0.00008 | 0 |
| 0.647 | 0.00487 0.00002 | 1 |
| 0.776 | 0.00909 0.00010 | 0 |
| 0.810 | 0.01000 0.00004 | 0 |
| 0.895 | 0.01490 0.00013 | 0 |
| 0.905 | 0.01562 0.00004 | 1 |
| 1.055 | 0.01810 0.00007 | 0 |
| 1.153 | 0.02110 0.00006 | 0 |
| 1.249 | 0.02390 0.00008 | 0 |
| 1.392 | 0.02770 0.00007 | 0 |
| 1.537 | 0.03100 0.00007 | 0 |
| 2.150 | 0.06199 0.00032 | 1 |
| 3.553 | 0.08929 0.02232 | 2 |
| 4.449 | 0.07210 0.01803 | 2 |
| 100 | 7.7 1.0 | 2 |
| 160 | 18.4 1.9 | 2 |
| 250 | 23.7 3.7 | 2 |
| 350 | 14.2 3.0 | 2 |
| 500 | 6.1 3.9 | 2 |
| 102.259 | 9.04997 2.26249 | 2 |
| 163.842 | 19.22050 4.80513 | 2 |
| 252.780 | 22.01670 5.50417 | 2 |
| 356.183 | 17.35570 4.33893 | 2 |
| 1100.00 | 0.62 0.17 | 7 |
| 1293.880 | 1.232 0.255 | 5 |
| 2000.000 | 0.40000 0.09800 | 6 |
| constraint | none | 1.3 | 2.0 | AC dust |
|---|---|---|---|---|
| ( ) | 2.1 | 0.26 | ||
| (K) | 30.40.24 | 29.30.3 | 19.20.2 | |
| ( ) | 6.0 | 0.23 | 0.045 | |
| ( ) | 0.50 | 0.50 | 0.52 | |
| (K) | 7.30.5 | 38.1 | 38.3 | 38.0 |
| ( ) | 0.03 | 6.0 | 6.2 | 6.3 |
| ( ) | 2.1 | 0.50 | 0.76 | 0.52 |
| ( ) | 6.0 | 6.2 | 6.3 | 6.3 |
| Quantity | Value | |
|---|---|---|
| Continuous star formation | ||
| ( yr-1) | 54 | |
| (Gyr) | 6 | |
| 3.5 | ||
| 1.44 | ||
| () | ||
| sSFR | ||
| (Gyr) | 2.3 | |
| () | ||
| (esc) () | ||
| (abs) () | ||
| () | ||
| Burst of star formation | ||
| ( yr-1) | 4 | |
| () | ||
| () |
References
- Arendt et al. (2014) Arendt, R. G., Dwek, E., Kober, G., Rho, J., & Hwang, U. 2014, ApJ, 786, 55
- Bauer et al. (2005) Bauer, A. E., Drory, N., Hill, G. J., & Feulner, G. 2005, ApJ, 621, L89
- Calura et al. (2010) Calura, F., Recchi, S., Matteucci, F., & Kroupa, P. 2010, MNRAS, 406, 1985
- Calzetti et al. (2000) Calzetti, D., Armus, L., Bohlin, R. C., et al. 2000, ApJ, 533, 682
- Cappellaro (1996) Cappellaro, E. 1996, in IAU Symposium, Vol. 171, New Light on Galaxy Evolution, ed. R. Bender & R. L. Davies, 81
- Draine (2009) Draine, B. T. 2009, in Astronomical Society of the Pacific Conference Series, Vol. 414, Cosmic Dust - Near and Far, ed. T. Henning, E. Grün, & J. Steinacker, 453
- Dwek (1998) Dwek, E. 1998, ApJ, 501, 643
- Dwek & Cherchneff (2011) Dwek, E. & Cherchneff, I. 2011, ApJ, 727, 63
- Dwek et al. (2007) Dwek, E., Galliano, F., & Jones, A. P. 2007, ApJ, 662, 927
- Dwek & Scalo (1980) Dwek, E. & Scalo, J. M. 1980, ApJ, 239, 193
- Dwek et al. (1980) Dwek, E., Sellgren, K., Soifer, B. T., & Werner, M. W. 1980, ApJ, 238, 140
- Dwek et al. (2014) Dwek, E., Staguhn, J., Arendt, R. G., et al. 2014, ApJ, 788, L30
- Egami et al. (2010) Egami, E., Rex, M., Rawle, T. D., et al. 2010, A&A, 518, L12
- Ferrarotti & Gail (2006) Ferrarotti, A. S. & Gail, H.-P. 2006, A&A, 447, 553
- Fioc & Rocca-Volmerange (1997) Fioc, M. & Rocca-Volmerange, B. 1997, A&A, 326, 950
- Gall et al. (2011) Gall, C., Hjorth, J., & Andersen, A. C. 2011, A&A Rev., 19, 43
- Hinshaw et al. (2009) Hinshaw, G., Weiland, J. L., Hill, R. S., et al. 2009, ApJS, 180, 225
- Kroupa (2001) Kroupa, P. 2001, MNRAS, 322, 231
- Michałowski (2015) Michałowski, M. J. 2015, A&A, 577, A80
- Michałowski et al. (2010) Michałowski, M. J., Watson, D., & Hjorth, J. 2010, ApJ, 712, 942
- Nanni et al. (2013) Nanni, A., Bressan, A., Marigo, P., & Girardi, L. 2013, MNRAS, 434, 2390
- Postman et al. (2012) Postman, M., Coe, D., Benítez, N., et al. 2012, ApJS, 199, 25
- Rowlands et al. (2014) Rowlands, K., Gomez, H. L., Dunne, L., et al. 2014, MNRAS, 441, 1040
- Slavin et al. (2015) Slavin, J. D., Dwek, E., & Jones, A. P. 2015, ApJ, 803, 7
- Staguhn et al. (2014) Staguhn, J. G., Kovács, A., Arendt, R. G., et al. 2014, ApJ, 790, 77
- Tammann et al. (1994) Tammann, G. A., Loeffler, W., & Schroeder, A. 1994, ApJS, 92, 487
- Temim & Dwek (2013) Temim, T. & Dwek, E. 2013, ApJ, 774, 8
- Temim et al. (2015) Temim, T., Dwek, E., Tchernyshyov, K., et al. 2015, ApJ, 799, 158
- Valiante et al. (2011) Valiante, R., Schneider, R., Salvadori, S., & Bianchi, S. 2011, MNRAS, 416, 1916
- Zavala et al. (2015) Zavala, J. A., Michalowski, M. J., Aretxaga, I., et al. 2015, ArXiv e-prints
- Zheng et al. (2012) Zheng, W., Postman, M., Zitrin, A., et al. 2012, Nature, 489, 406
- Zhukovska et al. (2008) Zhukovska, S., Gail, H., & Trieloff, M. 2008, A&A, 479, 453
- Zhukovska & Gail (2007) Zhukovska, S. & Gail, H.-P. 2007, in EAS Publications Series, Vol. 24, EAS Publications Series, ed. E. Emsellem, H. Wozniak, G. Massacrier, J.-F. Gonzalez, J. Devriendt, & N. Champavert, 299–300
- Zubko et al. (2004) Zubko, V., Dwek, E., & Arendt, R. G. 2004, ApJS, 152, 211