Atomistic Mechanisms of Intermittent Plasticity in Metals:
Dislocation Avalanches and Defect Cluster Pinning
Abstract
Intermittent plastic deformation in crystals with power-law behaviors has been reported in previous experimental studies. The power-law behavior is reminiscent of self-organized criticality, and mesoscopic models have been proposed that describe this behavior in crystals. In this letter, we show that intermittent plasticity in metals under tensile deformation can be observed in molecular dynamics models, using embedded atom method potentials for Ni, Cu, and Al. Power-law behaviors of stress drop and waiting time of plastic deformation events are observed. It is shown that power-law behavior is due to dislocation avalanche motions in Cu and Ni. A different mechanism of dislocation pinning is found in Al. These different stress relaxation mechanisms give different power-law exponents. We propose a probabilistic model to describe the novel dislocation motion in Al, and analytically deduce the power-law behavior.
pacs:
I Introduction
Many efforts have been devoted to understanding the plasticity of metals from both fundamental and industrial motivations, but the nature of plasticity has not been fully understood yet. Plastic deformation is a complex non-equilibrium process with metastable structures, such as dislocations, disclinations, grain boundaries, or other defect structures. Recent experimental and theoretical investigations into plastic deformation from the viewpoint of non-equilibrium physics demonstrated intermittent and power-law behaviors, , in plasticity of crystals Ananthakrishna et al. (1999); Ananthakrishna (2007); Miguel et al. (2001); Richeton et al. (2006); Dimiduk et al. (2006); Csikor et al. (2007); Weiss et al. (2007); Friedman et al. (2012), where is event size and is a constant specifying the character of the system, called a power-law exponent Jensen (1998); Aschwanden (2011).
Discontinuous deformation motions producing power-law behaviors in metallic alloys have been investigated experimentally by Ananthakrishna and his coworkers Ananthakrishna et al. (1999); Ananthakrishna (2007). Measurements of acoustic emission (AE) during creep of ice and hexagonal-close-packed (hcp) single crystals having single-slip systems showed acoustic energy bursts with power-law distributions Miguel et al. (2001); Richeton et al. (2006). (Similar behaviors in AE measurements of metals had also been reported in 1970s, the early years of AE techniques Nakasa et al. (1976); Nakasa (1994).) In multi-slip crystals, such as face-centered-cubic (fcc) metals, the same behavior was also observed in experiments and simulations Dimiduk et al. (2006); Csikor et al. (2007); Weiss et al. (2007); Friedman et al. (2012), and it was pointed out that the existence of intermittency raises problems for plastic forming of materials at micrometer scale Csikor et al. (2007). Studies of polycrystals suggested the connection between the intermittency and mechanical properties of polycrystals (Hall-Petch’s law) Richeton et al. (2005); Louchet et al. (2006). In addition, similar intermittent behaviors were observed in experiments and simulations of deformation in amorphous solids Bailey et al. (2007); Ng et al. (2009); Sun et al. (2010); Budrikis and Zapperi (2013); Salerno et al. (2012); Antonaglia et al. (2014a, b). These studies indicate that such intermittent behaviors are a common property of plasticity, and understanding of such behaviors is crucial for revealing the nature of plasticity in crystalline materials, especially in metals.
The appearance of the power-law distribution suggests the manifestation of self-organized criticality (SOC), tuned criticality, or other non-equilibrium critical phenomena Bak et al. (1987); Jensen (1998). SOC is known as a ubiquitous phenomenon in non-equilibrium systems, and has been studied in many fields, including physics, geology, economics, and biology Jensen (1998); Aschwanden (2011). However, it is not yet completely clear that the power-law behavior in plasticity is related to SOC, tuned criticality, or other non-equilibrium critical phenomena.
There are some tentative explanations for the emergence of intermittency and power-law behaviors in plasticity. The dislocation avalanches description as one of the explanations for the intermittency was suggested by discrete dislocation dynamics (DDD) simulations; the intermittency arises from the self-organization of metastable jammed dislocation configurations resulting from the long-range elastic interaction between dislocations and avalanche-like motion of dislocations caused by destruction of such metastable configurations Miguel et al. (2001); Csikor et al. (2007). Elastic manifold depinning transition was also proposed as an explanation for intermittency Zaiser (2006). Thus, the mechanism of intermittency of crystalline plasticity is still a controversial topic Ispánovity et al. (2014).
The dislocation avalanches were confirmed in not only single-slip crystals but also multi-slip crystals, such as fcc metals, by three-dimensional DDD simulations Csikor et al. (2007). However, unlike single-slip systems whose slips are dominated by only the elastic interaction between dislocations, dislocation crossing (entanglements of lineal dislocations), dislocation cross-slips, or other multi slip dynamics might play an important role in multi-slip systems. For instance, dislocation crossing can produce defect structures based on material properties, such as vacancy formation energy. Such defect structures might play a key role in intermittent plasticity due to the interaction between the defects and dislocation motion. For complete treatment of such atomistic scale defect evolution in multi-slip crystals, atomic scale models are indispensable.
While many numerical simulations for intermittent crystalline plasticity using mesoscopic scale models such as a phase-field model, lattice spring models, cellular automaton models, discrete dislocation models, a mean-field model, and continuous models, etc. have been executed so far Koslowski et al. (2004); Salman and Truskinovsky (2012); Budrikis and Zapperi (2013); Csikor et al. (2007); Miguel et al. (2001); Richeton et al. (2005); Dahmen et al. (2009); Papanikolaou et al. (2012); Ispánovity et al. (2014), realistic atomic scale simulations, i.e., molecular dynamics (MD) simulations, reproducing the power-law behavior have never been performed.
A numerical investigation similar to MD simulations has been performed by Moretti and his coworkers, who showed that simulations employing two-dimensional overdamped dynamics for small (colloidal) crystals with a simple pairwise interparticle interaction reproduce power-law behaviors Moretti et al. (2011). Nevertheless, in order to study inherent features originating from atomic scale mechanical properties of individual materials, more extensive simulations, such as three dimensional MD simulations employing realistic many-body interatomic potentials, are necessary.
In this article, we report that intermittent-plasticity with power-law behavior is exhibited in realistic three-dimensional atomic scale models of fcc metals with embedded atom method potentials Mishin et al. (1999); Mendelev et al. (2008, 2012). Specifically, MD simulation results are presented for nickel and copper that are consistent with power-law behaviors observed experimentally Dimiduk et al. (2006); Weiss et al. (2007). Results are also presented for aluminum whose vacancy formation energy and width of extended dislocations depending on the stacking fault energy are relatively smaller than those of Cu and Ni. The simulation results show that the power-law behavior of Al is different from that of Cu and Ni. Based on these results we show how the material parameters affect the non-equilibrium critical behaviors.
II Model and Numerical method
For the initial configuration of our MDs, the perfect lattice configurations under periodic boundary conditions described as follows were used. At first, let us consider an fcc lattice with the lattice constant, , whose -, - and -axis are along the , , and directions, respectively. Next, we tilted the lattice around the -axis with the angle degree, where , , and . This choice of orientation of the lattice is to reduce slip planes for the sake of easiness of analysis (the present orientation contains only two primary slip systems, because these have the largest Schmid factor in this orientation Shimokawa (2010)). To fill a periodic boundary simulation cell with this tilted lattice completely, we chose the cell dimension . This cell is filled with atoms and will be a cubic shape whose length, , is nearly nm after 50 percent tensile deformation along the -axis if the cell volume remains constant. In addition, we also employed a larger cell with the dimension consisting of atoms, which corresponds to a cubic dimension with nm after the deformation.
After relaxing the above configuration by the steepest descent method, we added random initial velocities to all atoms. Next, we added uniaxial tensile deformation to the model along the -axis at the constant strain rate 1/sec during picoseconds (ps). This strain rate is very much higher than that employed in experiments but it allows us to observe phenomena in the limited time period that can be simulated with MD simulations. Essential features of plasticity can be picked up even under such a strain rate, because the rate is sufficiently slow compared to the velocity of dislocation motions during the MD simulations. (The dislocation velocity in our MDs is comparable with the sound speed of crystals under the stress level.) This means that the external deformation works as a slow driving force necessary for emergence of non-equilibrium critical behaviors, especially SOC Jensen (1998). Moreover, it is known that some MD simulations with extremely high strain rate conditions exhibit typical mechanical properties, such as grain-boundary diffusion creep, Hall-Petch relation and reverse Hall-Petch effect, which agree with experimental results Keblinski et al. (1998); Schiøtz and Jacobsen (2003); Wolf et al. (2005).
To suppress the thermal fluctuation concealing the stress drops due to plastic deformation, we controlled the temperature at K by velocity scaling. The pressures along and directions were controlled at zero by the Parinello-Rahman method without shear deformation Parrinello and Rahman (1980). The MD simulations were realized by the velocity form of the Verlet algorithm for integrating Newton’s equation of motion, with an integration time step femtoseconds. Simulations were performed times with different initial velocities of atoms.
III Results and Discussion
Typical examples of the resultant stress-time curves, , which were averaged over ps interval to remove thermal fluctuations, are depicted in Fig. 1(a). After the first largest drops of the stress all the materials show serrated curves. The noteworthy feature is that one can see self-similarity reminiscent of scale-free structure in the magnified serration curve [Figs. 1(b) and (c)]. This trend suggests that power-low behaviors occur in the deformation.
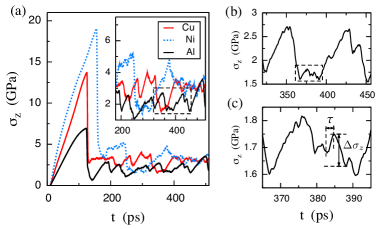
To examine statistics of these stress serrations, we focused on stress drops originating from plastic deformation events Ananthakrishna (2007); Ananthakrishna et al. (1999); Sun et al. (2010). Here we regard a time region when the stress monotonically decreases as the region of a plastic deformation event. Thus, the value of stress drop is defined by the stress released during one deformation event [Fig. 1(c)]: , where and are duration and occurrence time of the event, respectively. Waiting time of each event is defined by , where and are the previous occurrence time and duration, respectively. We calculated the stress drops and waiting times from all the stress-time curves obtained from our MDs, excluding the first stress drop events.
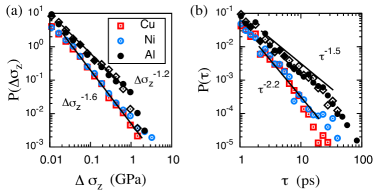
The plots of probability distributions of stress drop and waiting time in Fig. 2 shows that all the distributions clearly follow power-laws with exponents - for stress drop and - for waiting time, where the distributions of Al are shifted along the vertical axis to facilitate visualization. These results suggest that the plastic deformation of the present study has strong intermittency and scale invariance for both time and event size. The exponent is consistent with the previous studies Miguel et al. (2001); Dimiduk et al. (2006); Csikor et al. (2007); Weiss et al. (2007); Ananthakrishna et al. (1999), although precise evaluation of the exponents requires more extensive studies because the values depend on the number of samples, averaging time interval and event-detection techniques Aschwanden (2011). Note that we confirmed that the exponents of the stress drop distribution remain in the range from one to two even if the averaging interval is made shorter.
Let us focus now on the apparent differences between the values of the power-law exponents for Al compared to those of Cu and Ni. It is well-known that the exponents reflect, in general, the universality class to which the phenomenon belongs, and the values depend on the universality class. The intermittent plastic deformation of crystals is believed to be in a certain common universality class Miguel et al. (2001); Csikor et al. (2007); Tsekenis et al. (2013). If this is true, one expects to obtain the same exponent values for intermittent plastic deformation even if the material is different. However, the distributions of Al have smaller exponents, (, ), than those of Cu and Ni, (, ) [Fig. 2]. (We also confirmed that this magnitude relation between the exponents of Al and Cu/Ni is independent of the average interval.) This difference in the exponent values suggests that the deformation mechanism in Al is different to that of Cu and Ni, even though they are all fcc metals.
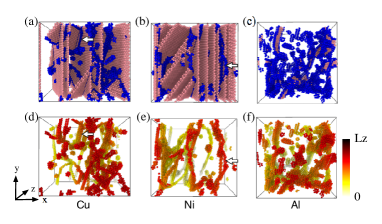
To clarify the deformation mechanisms in Cu, Ni, and Al, we investigated the dynamics of defect atoms during the deformation process by employing common neighbor analysis which can distinguish defect atoms constructing dislocations, stacking faults, vacancies, and other defects from lattice-structured atoms Jonsson and Andersen (1988); Clarke and Jónsson (1993). Typical snapshots of defect atoms in the present simulations, obtained with an open visualization tool (OVITO) Stukowski (2010), are shown in Fig. 3 (for movies, see supplementary material supplyMovies ). Figures 3(a) and (b) for Cu and Ni crystals shows the formation of some stacking faults (colored pink or light gray), which span the periodic cell, and interfacial dislocations on the stacking faults. These dislocations have obviously a linear shape [Fig. 3(d) and (e)], and showed intermittent collective behavior due to the elastic interaction between them supplyMovies . This picture is consistent with dislocation avalanches Miguel et al. (2001). In contrast with these results for Cu and Ni, the results for Al showed that, instead of stacking faults, a number of defect or disordered structures (colored blue or dark gray) were created by nucleation, annihilation and crossing of dislocations [Fig. 3(c) and (f)] (for movies, see also supplementary material supplyMovies ).
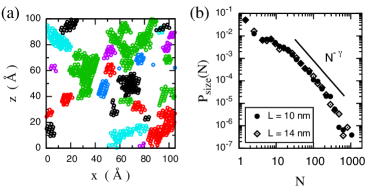
The constituent atoms of these defect structures in Al multiplied and formed dozens of clusters during the tensile deformation. We show a typical configuration of defect atoms in Al at ps on a sliced section diagonal to the simulation cell in Fig. 4(a), where the section has nm thickness. The size of these defect clusters has a wide range and, the distribution seems to have a power-law tail as shown in Fig. 4(b):
| (1) |
where is the number of atoms constituting one defect cluster. While the precise estimation of the exponent is difficult due to the curvature of the distribution originating from its cut-off, one can roughly estimate to be around .
The MD results for Al show the behavior that dislocations are often pinned by the clusters and then abruptly depinned, similar to the dislocation motion in crystals containing precipitates. During the process, defect clusters spontaneously and slowly increase and decrease in size. This implies that defect clusters act as quenched disorders for dislocation motion. It is expected that this difference between the dislocation behavior of Al and that of the dislocation avalanche picture is the reason why different power-law exponents are obtained for Cu/Ni and Al.
These clear differences between Cu/Ni and Al are ascribable to material parameters such as stacking fault energy and defect formation energy. The lower stacking fault energy of Cu and Ni supports the development of stacking faults in these materials. The development of defect clusters which effectively change the relaxation dynamics is attributed to relatively low vacancy formation energy of Al. In other words, the values of material parameters such as vacancy formation energy can affect the critical behavior in crystalline plastic deformation.
The exponent of Cu and Ni, in which domains are divided by twin boundaries, is larger than the exponent of Al which is without twin boundaries. This trend might be related to extremely high strength and ductility in copper with high density nano twins Lu et al. (2004), because the larger exponent means suppression of large scale deformation events. Therefore, the investigation of power-law behaviors in the intermittent plasticity may give us insights for designing nanostructure materials with excellent mechanical properties.
IV Defect cluster pinning picture
In order to explain that pinning and depinning motion in Al can produce power-law behaviors, we propose a basic model describing this type of dislocation motion and prove that the model shows power-law behaviors.
As described above, a defect cluster in Al works as an obstacle to dislocation motion. The pinned dislocation would cut through the cluster by an increased external shear stress originating from tensile deformation, and then would be released from the pinning. After that, the dislocation moves until being trapped by another cluster. This movement corresponding to an individual deformation event relaxes the external stress and produces a stress drop .
Here we propose a simple description of the above behavior in Al as a one dimensional probabilistic model by employing the following assumptions. First, we exclude the formation and development of the defect clusters from this model, and assume that the clusters already exist. We assume that (i) there is only one straight dislocation which collides with the clusters one at a time. (ii) Migration of the dislocation from one cluster to the next causes plastic deformation and decreases the external stress by a constant value . (iii) We here consider that a defect cluster serves as a precipitate in crystals. It is well-known that the critical resolved shear stress of a precipitate is, in most cases, proportional to some power of the size of the precipitate (e.g., see the section 5.6 in the reference Courtney (2000)). Thus, the resistance, , of the cluster can be described as a function of its size : , where is a constant. (In general the resistance of a precipitate is represented by a function of its diameter. However, introducing an atomic volume one can easily transform the diameter to the number of atoms composing the precipitate.) Using the size distribution of a defect cluster [Eq. (1)], the resistance is also determined by the power-law:
| (2) |
where and are a normalizing constant and power-law exponent, respectively. The exponent can be evaluated as by transforming the random variables in Eq. (1). Introducing the lower limit to avoid the divergence of integration, one can obtain . (iv) If the external stress is less than the resistance of an encountered cluster (), the dislocation is trapped by the cluster and the present deformation event is finished. Subsequently, increases due to the external tensile deformation, then the trapped dislocation will be depinned when the increased exceeds of the cluster. On the contrary, (v) if , the dislocation passes the cluster without being trapped and migrates to the next cluster. This assumption allows the dislocation to pass multiple clusters before being trapped and to produce a large stress drop. When the dislocation passes clusters and is trapped by the -th cluster the stress drop will be .
From the above theoretical model, we analytically deduce the probability that one deformation event releases stress . To evaluate we consider the cumulative probability distribution , that the stress drop exceeds , corresponding to the probability that a dislocation passes more than clusters without being trapped. Here the probability that a dislocation passes a cluster under the external stress , i.e. the probability that an encountered cluster has resistance less than , is calculated by the following:
| (3) |
If a dislocation was pinned by a cluster with resistance at first, will be when the dislocation is depinned from the cluster. Therefore, the probability that the dislocation passes more than clusters after depinning from the cluster is denoted by . Averaging this conditional probability over leads to the cumulative probability:
| (4) |
where the lower limit is introduced because of the condition, , for the positivity of .
This integral is complicated so we adopt the following approximations. Firstly, the term can be considered small because of the smallness of . From this can be approximated to only first order terms: Secondly, noticing the smallness of , one can expand and ignore the higher order terms; This approximation makes the summation computable, so the integrand is rewritten in an integrable form at last:
| (5) |
Now we can easily execute the integral. If we consider only the lowest term of the result, one can obtain a power-law cumulative distribution: . This result corresponds to the formula for the non-cumulative probability distribution, , where Sims et al. (2007). This means that the present one-dimensional model has a power-law behavior with the exponent .
Recalling the exponent, , obtained from Fig. 4(b), we can now calculate the theoretical exponent of stress drop as . Assuming , one can obtain the value which agrees with the value estimated in the MDs [Fig. 2(a)]. This assumption lacks corroborative evidence, but remains around unity unless is considerably smaller than unity. This robustness suggests the essential correctness of the present model.
The present one-dimensional picture has some problematic assumptions: Actually, a dislocation can come into contact with multiple defect clusters simultaneously. Thus, our assumption that a dislocation encounters clusters sequentially might be too simplified. For the quantitative agreement of theoretical and numerical results, an effective resistance distribution including the two-dimensional interaction between a dislocation and multiple defect clusters is required. Deducing the actual distribution from numerical or theoretical approaches is a subject for the future. Also, the proportional relation between the resistance and size of the defective clusters should be established in future research, which might require some additional numerical simulations. The most important aspect, however, is that the difference between the theoretical and numerical exponents is only small. This agreement implies the adequacy of the present theoretical model for depicting the intermittent plasticity in Al.
One might consider the present model has some analogy to the model for domain-wall dynamics in ferromagnetic materials, and the mean-field model which provides predictions that agree with some experimental results of intermittent plasticity Alessandro et al. (1990); Dahmen et al. (2009); Friedman et al. (2012). However, the former is a continuous model and the latter is a cellular automaton model. In contrast, our model is a probabilistic process. The mean-field model and our suggested model have obvious differences in the treatment of dislocation motion: the present model describes the motion of dislocation itself, as explained above. Another significant difference between them is the distribution of threshold and arrest stress: a polar function is employed in the mean-field model whereas the power-law distribution is used in our model. This difference might explain the different values of the power-law exponents originating from dislocation avalanches and defect cluster pinning.
It is known that the power-law exponent of the avalanche distribution of the domain-wall model for ferromagnetic materials depends on the rate of the external field Alessandro et al. (1990). Thus, from the similarity between the domain-wall model and our theoretical model, one might suppose that the power-law exponent of the stress drop in Al also depends on strain rate of tensile deformation. However, the exponent is not expected to be as sensitive to the rate as in the domain-wall model. The reason is that experiments which employed strain rates more than ten orders of magnitude slower than in our simulations have obtained similar exponent values to the values obtained from our MD simulations Dimiduk et al. (2006); Richeton et al. (2006); Friedman et al. (2012). The clarification of the rate-dependence is an issue for future study with more extensive MD simulations.
The approximations used in the above to reduce Eq. (5) are equivalent to ignoring the term in Eq. (4). This means that the distribution of resistance supposed from the size distribution of defect clusters, , is the primary origin of power-law behaviors. Thus, in this model the scale invariant feature of self-organized defect clusters produces the intermittent plasticity in Al.
V Conclusion
In order to investigate the intermittent crystalline plasticity and influence of material characteristics upon the criticality of the plasticity, we have performed molecular dynamics simulations for uniaxial tensile deformation of Ni, Cu, and Al under the constant strain rate, temperature and pressure conditions by using the embedded atom method potentials. The simulations successfully reproduced power-law behaviors of stress drop and waiting time of deformation events. However, the power-law exponents for Cu/Ni and Al were found to be different. Moreover, the dominant mechanism producing the power-law behavior seem to be different in the case of Al.
Larger exponents () are obtained from the power-law tails of the stress drop distributions of Cu and Ni, and a smaller exponent () is obtained from the distribution of Al. Dislocation avalanche like behaviors were observed in Cu and Ni, whereas Al showed depinning motion of dislocations from self-organized defect clusters.
To describe how the latter behavior produces a power-law distribution we proposed a simple one-dimensional model and analytically deduced the power-law distribution from the model. This model indicates that scale invariance of defect clusters produces the power-law features of the intermittent plasticity in Al. The results indicate that differences in materials can affect the universality of the critical behavior in intermittent plasticity of crystals. In order to confirm this, it is necessary to accurately determine the critical exponent values. On the other hand, the difference of the power-law exponents in Al and Cu/Ni might be an artifact depending on measurement method or conditions, such as system size, boundary condition, strain rate, temperature, inertia etc. To elucidate the above points more extensive studies employing molecular dynamics simulations are required.
Acknowledgements.
We would like to thank K. Dahmen and P. Liaw for useful discussions and comments. This research was supported by the Ministry of Education, Culture, Sports, Science and Technology (MEXT) KAKENHI Grant Number 22102007 and the Japan Science and Technology Agency (JST) under Collaborative Research Based on Industrial Demand “Heterogeneous Structure Control: Towards Innovative Development of Metallic Structural Materials”.References
- Ananthakrishna et al. (1999) G. Ananthakrishna, S. J. Noronha, C. Fressengeas, and L. P. Kubin, Phys. Rev. E 60, 5455 (1999).
- Ananthakrishna (2007) G. Ananthakrishna, Physics Reports 440, 113 (2007).
- Miguel et al. (2001) M. C. Miguel, A. Vespignani, S. Zapperi, J. Weiss, and J.-R. Grasso, Nature 410, 667 (2001).
- Richeton et al. (2006) T. Richeton, P. Dobron, F. Chmelik, J. Weiss, and F. Louchet, Mater. Sci. Eng.: A 424, 190 (2006).
- Dimiduk et al. (2006) D. M. Dimiduk, C. Woodward, R. LeSar, and M. D. Uchic, Science 312, 1188 (2006).
- Csikor et al. (2007) F. F. Csikor, C. Motz, D. Weygand, M. Zaiser, and S. Zapperi, Science 318, 251 (2007).
- Weiss et al. (2007) J. Weiss, T. Richeton, F. Louchet, F. Chmelik, P. Dobron, D. Entemeyer, M. Lebyodkin, T. Lebedkina, C. Fressengeas, and R. J. McDonald, Phys. Rev. B 76, 224110 (2007).
- Friedman et al. (2012) N. Friedman, A. T. Jennings, G. Tsekenis, J.-Y. Kim, M. Tao, J. T. Uhl, J. R. Greer, and K. A. Dahmen, Phys. Rev. Lett. 109, 095507 (2012).
- Jensen (1998) H. J. Jensen, Self-Organized Criticality: Emergent Complex Behavior in Physical and Biological Systems (Cambridge Lecture Notes in Physics) (Cambridge University Press, 1998).
- Aschwanden (2011) M. Aschwanden, Self-organized criticality in astrophysics: The statistics of nonlinear processes in the universe (Springer, 2011).
- Nakasa et al. (1976) H. Nakasa, H. Kusanagi, and H. Kimura, in The 3rd Acoustic Emission Symposium (1976).
- Nakasa (1994) H. Nakasa, Theoretical bases and practical applications of acoustic emission (Chijin Shokan, 1994).
- Richeton et al. (2005) T. Richeton, J. Weiss, and F. Louchet, Nat. Mater. 4, 465 (2005).
- Louchet et al. (2006) F. Louchet, J. Weiss, and T. Richeton, Phys. Rev. Lett. 97, 075504 (2006).
- Bailey et al. (2007) N. P. Bailey, J. Schiøtz, A. Lemaitre, and K. W. Jacobsen, Phys. Rev. Lett. 98, 095501 (2007).
- Ng et al. (2009) K. Ng, L. Zuo, and A. Ngan, Scripta Mater. 61, 955 (2009).
- Sun et al. (2010) B. A. Sun, H. B. Yu, W. Jiao, H. Y. Bai, D. Q. Zhao, and W. H. Wang, Phys. Rev. Lett. 105, 035501 (2010).
- Budrikis and Zapperi (2013) Z. Budrikis and S. Zapperi, Phys. Rev. E 88, 062403 (2013).
- Salerno et al. (2012) K. M. Salerno, C. E. Maloney, and M. O. Robbins, Phys. Rev. Lett. 109, 105703 (2012).
- Antonaglia et al. (2014a) J. Antonaglia, X. Xie, G. Schwarz, M. Wraith, J. Qiao, Y. Zhang, P. K. Liaw, J. T. Uhl, and K. A. Dahmen, Sci. Rep. 4 (2014a).
- Antonaglia et al. (2014b) J. Antonaglia, W. J. Wright, X. Gu, R. R. Byer, T. C. Hufnagel, M. LeBlanc, J. T. Uhl, and K. A. Dahmen, Phys. Rev. Lett. 112, 155501 (2014b).
- Bak et al. (1987) P. Bak, C. Tang, and K. Wiesenfeld, Phys. Rev. Lett. 59, 381 (1987).
- Zaiser (2006) M. Zaiser, Adv. Phys. 55, 185 (2006).
- Ispánovity et al. (2014) P. D. Ispánovity, L. Laurson, M. Zaiser, I. Groma, S. Zapperi, and M. J. Alava, Phys. Rev. Lett. 112, 235501 (2014).
- Koslowski et al. (2004) M. Koslowski, R. LeSar, and R. Thomson, Phys. Rev. Lett. 93, 125502 (2004).
- Salman and Truskinovsky (2012) O. Salman and L. Truskinovsky, Int. J. Eng. Sci. 59, 219 (2012).
- Dahmen et al. (2009) K. A. Dahmen, Y. Ben-Zion, and J. T. Uhl, Phys. Rev. Lett. 102, 175501 (2009).
- Papanikolaou et al. (2012) S. Papanikolaou, D. M. Dimiduk, W. Choi, J. P. Sethna, M. D. Uchic, C. F. Woodward, and S. Zapperi, Nature 490, 517 (2012).
- Moretti et al. (2011) P. Moretti, B. Cerruti, and M.-C. Miguel, PloS one 6, e20418 (2011).
- Mishin et al. (1999) Y. Mishin, D. Farkas, M. J. Mehl, and D. A. Papaconstantopoulos, Phys. Rev. B 59, 3393 (1999).
- Mendelev et al. (2008) M. Mendelev, M. Kramer, C. Becker, and M. Asta, Philos. Mag. 88, 1723 (2008).
- Mendelev et al. (2012) M. Mendelev, M. Kramer, S. Hao, K. Ho, and C. Wang, Philos. Mag. 92, 4454 (2012).
- Shimokawa (2010) T. Shimokawa, Phys. Rev. B 82, 174122 (2010).
- Keblinski et al. (1998) P. Keblinski, D. Wolf, and H. Gleiter, Interface Sci. 6, 205 (1998).
- Schiøtz and Jacobsen (2003) J. Schiøtz and K. W. Jacobsen, Science 301, 1357 (2003).
- Wolf et al. (2005) D. Wolf, V. Yamakov, S. Phillpot, A. Mukherjee, and H. Gleiter, Acta Mater. 53, 1 (2005).
- Parrinello and Rahman (1980) M. Parrinello and A. Rahman, Phys. Rev. Lett. 45, 1196 (1980).
- Tsekenis et al. (2013) G. Tsekenis, J. T. Uhl, N. Goldenfeld, and K. A. Dahmen, EPL (Europhysics Letters) 101, 36003 (2013).
- Jonsson and Andersen (1988) H. Jonsson and H. C. Andersen, Phys. Rev. Lett. 60, 2295 (1988).
- Clarke and Jónsson (1993) A. S. Clarke and H. Jónsson, Phys. Rev. E 47, 3975 (1993).
- Stukowski (2010) A. Stukowski, Modell. Simul. Mater. Sci. Eng. 18, 015012 (2010).
- (42) See supplementary material at http://link.aps.org/supplemental/10.1103/PhysRevE.91.022401 for movies illustrating the evolution of defect atoms.
- Lu et al. (2004) L. Lu, Y. Shen, X. Chen, L. Qian, and K. Lu, Science 304, 422 (2004).
- Courtney (2000) T. H. Courtney, Mechanical behavior of materials, 2nd ed. (McGraw-Hill, 2000).
- Sims et al. (2007) D. W. Sims, D. Righton, and J. W. Pitchford, J. Anim. Ecol. 76, 222 (2007).
- Alessandro et al. (1990) B. Alessandro, C. Beatrice, G. Bertotti, and A. Montorsi, J. Appl. Phys. 68, 2901 (1990).