High-velocity gas towards the LMC resides in the Milky Way halo ††thanks: Based on observations obtained with the NASA/ESA Hubble Space Telescope, which is operated by the Space Telescope Science Institute (STScI) for the Association of Universities for Research in Astronomy, Inc., under NASA contract NAS5D26555.
Abstract
Aims. To explore the origin of high-velocity gas in the direction of the Large Magellanic Cloud (LMC) we analyze absorption lines in the ultraviolet spectrum of a Galactic halo star that is located in front of the LMC at kpc distance.
Methods. We study the velocity-component structure of low and intermediate metal ions (C ii, Si ii, Si iii) in the spectrum of RX J0439.86809, as obtained with the Cosmic Origins Spectrograph (COS) onboard the Hubble Space Telescope (HST), and measure equivalent widths and column densities for these ions. We supplement our COS data with a Far-Ultraviolet Spectroscopic Explorer (FUSE) spectrum of the nearby LMC star Sk 69 59 and with H i 21 cm data from the Leiden-Argentina-Bonn (LAB) survey.
Results. Metal absorption towards RX J0439.86809 is unambiguously detected in three different velocity components near , , and km s-1. The presence of absorption proves that all three gas components are situated in front of the star, thus being located in the disk and inner halo of the Milky Way. For the high-velocity cloud (HVC) at km s-1 we derive an oxygen abundance of [O/H ( solar) from the neighbouring Sk 69 59 sightline, in accordance with previous abundance measurements for this HVC. From the observed kinematics we infer that the HVC hardly participates in the Galactic rotation.
Conclusions. Our study shows that the HVC towards the LMC represents a Milky Way halo cloud that traces low-column density gas with relatively low metallicity. It rules out scenarios in which the HVC represents material close to the LMC that stems from a LMC outflow.
Key Words.:
Galaxy: halo – Galaxy: evolution – ISM: abundances – ISM: structure1 Introduction
The Milky Way is surrounded by large amounts of neutral and ionized gas that can be observed in absorption against bright extragalactic background sources or in emission (e.g., in H i 21cm). This gas is manifold in origin and chemical composition, reflecting the various processes that determine the gas distribution around Milky-Way type galaxies as part of cosmological structure formation and galaxy evolution (e.g., gas infall, supernova-driven outflows, tidal interactions).
Extraplanar gas features in the Galactic halo manifest themselves in absorption and emission features at high radial velocities that are incompatible with those expected from Galactic rotation models. Coherent gas streams with radial velocities km s-1 are usually referred to as ”high-velocity clouds” (HVCs), while those with somewhat lower velocities ( km s-1) are called ”intermediate-velocity clouds” (IVCs; see Wakker & van Woerden 1998; Richter 2006; Putman et al. 2012 for recent reviews).
Previous studies have demonstrated that the majority of the large IVCs and HVCs are located in the inner Galactic halo at distances kpc (e.g., Wakker et al. 2007, 2008; Thom et al. 2006, 2008). A prominent exception is the so-called Magellanic Stream, which represents a massive structure ( ) of neutral and ionized gas at kpc that originates from the interaction of the two Magellanic Clouds orbiting the Milky Way (e.g., Wannier & Wrixon 1972; Fox et al. 2010, 2013, 2014; Richter et al. 2013).
Among the various HVCs, the high-velocity cloud near km s-1 in front of the LMC (hereafter referred to as HVCtwLMC) belongs to the best studied, owing to the fact that there are many bright LMC stars in the background that can be used to study the HVC with the method of absorption spectroscopy. Previous observations indicate that HVCtwLMC is a relatively metal-poor ( abundance: solar; Lehner et al. 2009, hereafter referred to as L09), multi-phase gas cloud that is predominantly ionized, but that consists of considerable small-scale structure, denser sub-clumps, and dust (Richter et al. 1999; Welty et al. 2001; Smoker et al. 2015). Earlier studies of HVCtwLMC have favoured a Galactic origin (e.g., Savage & de Boer 1981; de Boer, Morras & Bajaja 1990; Richter et al. 1999), some later studies proposed that HVCtwLMC is located close to the LMC, representing metal-enriched gaseous material that stems from an outflow caused by the enhanced star-formation activity in the Magellanic Clouds (Stavely-Smith et al. 2003; L09).
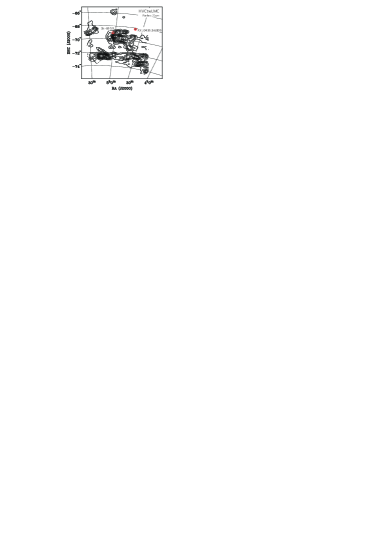
In this paper we demonstrate that HVCtwLMC is located in front of the star RX J0439.86809 (Fig. 1) at a distance of kpc (Werner & Rauch 2015), thus proving that the gas resides within the inner halo of the Milky Way, but is not related to a supposed LMC outflow. The paper is organized as follows. In Sect. 2 we briefly describe the observations and the data analysis. In Sect. 3 we present the results from the spectral analysis. In Sect. 4 we explore the space motion of HVCtwLMC, discuss its chemical composition, and indicate possible origins of the gas. We conclude or study in Sect. 5.
2 Observations and data handling
For our experiment we make use of archival ultraviolet (UV) spectral data of the extremely hot white dwarf (WD) RX J0439.86809. Since its discovery in 1994 as ROSAT supersoft X-ray source, RX J0439.86809 was regarded as a WD located in the LMC (Greiner et al. 1994). A recent spectral analysis of RX J0439.86809 by Werner & Rauch (2015) based on COS data reveals, however, that the star has a spectroscopic distance of just , thus being located within the Milky Way halo kpc below the Galactic disk. The distance and the position (at , ) in front of the LMC make RX J0439.86809 the ideal target to constrain the distance of intermediate- and high-velocity gas in the direction of the Magellanic Clouds.
We here use the same COS data set as presented in Werner & Rauch (2015). RX J0439.86809 was observed with HST/COS using the G130M grating that covers the wavlength range between Å at a spectral resolution of ( km s-1) FWHM. The total exposure time was 14 080 s. We retrieved the original x1d fits files (processed with the CALCOSpipeline v2.17.3) from the MAST archive and coadded the individual sciences exposures following the procedure described in Richter et al. (2015). The signal-to-noise (S/N) in the final coadded spectrum is per resolution element at Å.
We supplement our COS data with a FUSE Far-UV spectrum of the LMC Wolf-Rayet star Sk 69 59 (at , , degrees away from RX J0439.86809) to provide a reference spectrum that contains all relevant absorption components along the line of sight towards (and through) the LMC. Also the FUSE data were retrieved from the MAST archive and were reduced in a way similar as described in Richter et al. (2013).
The sky positions of RX J0439.86809 and Sk 69 59 are plotted in Fig. 1 together with an H i 21cm map of the HVCtwLMC (from Staveley-Smith et al. 2003). For the spectral analysis of the COS and FUSE data we used the custom-written span software package, that is based on ESO-MIDAS and its fitlyman spectral library (Fontana & Ballester 1995). Equivalent widths and column densities were derived from a direct pixel integration of the absorption profiles using the apparent-optical depth (AOD) method (Savage & Sembach 1991). Atomic data have been adopted from the compilation by Morton (2003).
To derive the H i column densities (or limits) in the direction of the two background sources we consider publicly available 21 cm spectral data from the LAB survey (Kalberla et al. 2005) and the relation H i.
| Ion | [Å] | Instrument | [mÅ] | log |
| RX J0439.86809; km s-1 | ||||
| C ii | COS | |||
| Si iii | COS | |||
| Si ii | COS | |||
| Si ii | COS | |||
| Si ii | COS | |||
| H i | 21 cm | LAB | ||
| Sk 69 59; km s-1 | ||||
| O i | FUSE | |||
| N i | FUSE | |||
| N ii | FUSE | |||
| Fe ii | FUSE | |||
| P ii | FUSE | |||
| H i | 21 cm | LAB | ||
3 Results from the spectral analysis
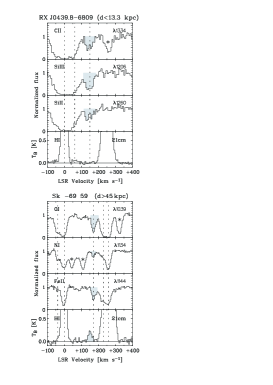
In the upper panel of Fig. 2 we show the (interstellar) absorption profiles of C ii , Si iii , and Si ii in the COS spectrum of RX J0439.86809 plotted on a Local Standard of Rest (LSR) velocity scale together with the LAB 21 cm emission profile. Absorption in these sight lines is detected in three main absorption components centered at and km s-1 (dotted lines). The intermediate-velocity component at km s-1 blends with the very strong local disk absorption at zero velocities, as observed along many LMC sightlines (see Danforth et al. 2002). The high-velocity gas at km s-1 is well separated from the other velocity components. H i 21 cm emission (lower panel) is seen only near zero velocities (Galactic disk) and near km s-1, the latter component coming from neutral gas in the LMC behind RX J0439.86809, gas not present in absorption.
In the lower panel of Fig. 2 we show the absorption profiles of O i , N i , and Fe ii in the FUSE spectrum of Sk 69 59. Here, the high-velocity component is shifted towards km s-1, while no intermediate-velocity component is present. Absorption at to km s-1 stems from gas within the LMC. In contrast to RX J0439.86809, weak 21 cm emission is detected in the HVC component towards Sk 69 59. but the emission is slightly shifted to velocities near km s-1. We attribute the velocity shift to beam-smearing effects in the LAB 21cm data that have a spatial resolution of .
For the HVCtwLMC gas we have derived ion equivalent widths and column densities from the COS, FUSE, and LAB data. The results are summarized in Table 1.
4 Properties of the high-velocity cloud
4.1 Location and kinematics
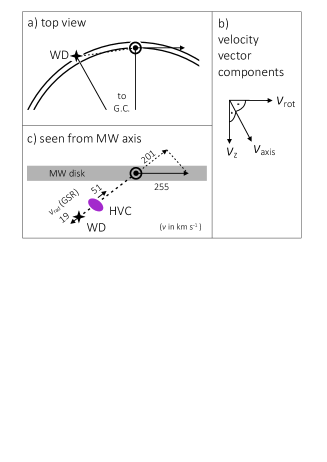
With , and kpc, the HVC’s vertical distance to the disk is limited to kpc. The observed radial velocity, however, does not constrain the space velocity of the gas. To evaluate the space motion of HVCtwLMC we use the geometry of the sight line to RX J0439.86809 as given in Fig. 3. First, we will consider velocities in the Galactic Standard of Rest (GSR), i.e., velocities with respect to the location of the Sun without the Galactic rotation. Assuming that the circular orbit speed of the Sun is km s-1 (Reid et al. 2014), the component of the velocity of the Sun on the line of sight to the star is sin cos km s-1 (see Fig. 3, panel c). The observed radial velocity of HVCtwLMC is +150 km s-1, so this gas has km s-1 in the GSR system in this direction (Fig. 3, panel c).
Another decomposition of the HVC space velocity vector is helpful. We decompose it into three orthogonal components (see Kaelble, de Boer & Grewing 1985): , , and (see Fig. 3, panel b). The geometry of the Sun with WD is fortuitous in that, even if HVCtwLMC would have a considerable , hardly any of that will show up in the observed . Therefore the of +51 km s-1 can be understood by just having km s-1 or by having km s-1. In fact, the velocity components and of HVCtwLMC in the discussed geometry would have to combine to result in km s-1 (note has a negative sign for gas falling toward the disk). Since essentially all neutral HVC gas in the halo is considered to be moving towards the MW disk, we conclude that most likely is less than 64 km s-1, implying that HVCtwLMC is hardly participating in the Galactic rotation. Because is, as said, undefined, only these limits to the space motion of HVCtwLMC can be inferred. See de Boer & Savage (1983,1984) for more details on this type of HVC velocity decomposition.
4.2 Metallicity and ionization conditions
The simultaneous presence of Si ii and Si iii towards RX J0439.86809 provides strong evidence for the presence of ionized gas in HVCtwLMC. As discussed in Richter et al. (2015), it is likely that in diffuse circumgalactic environments these two ionization stages of Si trace predominantly complementary gas phases. The similar column densities of Si ii and Si iii (Table 1) then indicate that there is at least as much ionized hydrogen in HVCtwLMC towards RX J0439.86809 as neutral hydrogen. The column density of Si ii suggests that the amount of neutral hydrogen is clearly below the upper limit as derived from H i 21 cm. Alternatively, if the gas would have solar composition, Si is depleted, but by at most 1 dex.
For other abundance ratios we refer to data from the nearby sight line to Sk 69 59 (separated by degrees), because for the sightline towards RX J0439.86809 no H i 21 cm emission is detected in the LAB data and O i absorption in the COS spectrum is contaminated by strong airglow lines. The most useful ion ratio to determine the overall metallicity of the gas is the O i/H i ratio. Neutral oxygen and neutral hydrogen have almost identical ionization potentials and in neutral gas regions both species are coupled through a strong charge-exchange reaction. In addition, the element oxygen is not significantly depleted into dust grains (e.g., Savage & Sembach 1996). We use H i 21 cm and O i towards Sk 69 59 (see Fig. 2) to derive the metallicity of HVCtwLMC. With the column densities given in Table 1 and solar reference abundances from Asplund et al. (2009) we determine a metallicity/alpha abundance of [O/H] ( solar), in good agreement with previous [O/H] estimates for the HVC in this direction (L09).
Another valuable indicator for the enrichment history of gas is the nitrogen abundance. From the N i column density we infer [N/H], which is substantially lower than [O/H]. One reason for a low N/O ratio may be SN type II-dominated enrichment, such as observed in other prominent HVCs (e.g., Richter et al. 2001; 2013) and in many extragalactic absorption systems (e.g., Pettini et al. 2008). However, an alternative (and similarly plausible) explanation is that the low N i column density is a result of ionization effects that become important for neutral nitrogen in low-density environments (e.g., Fox et al. 2013, their Fig. 10). The latter conclusion is supported by the shape of the N ii line, which exhibits strong absorption at km s-1. Because of line saturation, we can only give a lower limit of log (N ii) which does not help to further pinpoint the intrinsic N/O ratio in HVCtwLMC without knowing the exact ionization conditions. Similar arguments hold for iron, for which we determine an apparent abundance of [Fe/H], thus being close to the derived [O/H] ratio. In predominantly neutral gas environments such a small difference between [O/H] and [Fe/H] would indicate very little dust depletion in the HVC in this direction. In HVCtwLMC, however, the observed Fe ii/H i ratio more likely reflects a considerable amount of H ii that coexists with singly-ionized iron in mostly ionized gas regions (see also L09), so that an intrinsically lower [Fe/H] due to dust depletion or nucleosynthetic effects cannot be excluded.
Summarizing, the analysis of [N/O] and [Fe/H] remains inconclusive with respect to the enrichment history and dust properties of the gas because of the unknown ionization conditions. The relatively low oxygen abundance of HVCtwLMC is in line with an extragalactic origin of the gas, similar as for other HVCs such as Complex C and Complex A (Wakker et al. 1999; Richter et al. 2001). The gas could also have originated in the Galactic halo, being gas shed by metal-poor halo stars during their red-giant phase (de Boer 2004), or from metal-poor gas in the outer Milky Way disk. That the gas would be some form of outflow from the LMC is no longer tenable because of the above derived distance limit.
4.3 Total mass
To provide an approximate mass limit of the HVCtwLMC we use the absorption statistics of O i presented in L09 and, assuming that the distance of the cloud is kpc and the angular size deg2, the angular size of the LMC. With these numbers, the physical size of the cloud is only 0.76 kpc2 and the neutral gas mass is small, . Note that, depending on the ionization fraction of the gas and the spatial extent of the HVC beyond the LMC boundaries, the total gas mass might be substantially higher than this estimate. Additional absorption-line observations of QSOs that are located around the LMC would be very helpful to better constrain the size and mass of the HVCtwLMC.
5 Conclusions
Our observations demonstrate that the HVC in the direction of the LMC (as well as all other absorption components) are located in front of the star RX J0439.86809 at kpc distance. They all are part of the Galaxy and do not belong to some LMC outflow. HVCtwLMC thus is in line with other prominent HVCs for which reliable distance estimates exist and which are located within kpc distance, such as Complex A, Complex C, the Cohen Stream, and the Smith Cloud (van Woerden et al. 1999; Wakker et al. 2007, 2008; Thom et al. 2006,2008). The derived oxygen abundance of HVCtwLMC ( solar) does not allow us to draw firm conclusions about its origin; both scenarios, a Galactic and an extragalactic origin, are in line with the observations.
The results presented here once again underline the importance of distance determinations of HVCs for our understanding of the spatial distribution of gas in the Milky Way halo.
Acknowledgements.
T. Rauch was supported by the German Aerospace Center (DLR) under grant 05 OR 1402. Some of the data presented in this paper were obtained from the Mikulski Archive for Space Telescope (MAST).References
Asplund, M., Grevesse, N., Jacques Sauval, A., & Scott, P. 2009, ARA&A, 47, 481
Danforth, C.W., Howk, J.C., Fullerton, A.W., Blair, W.P., & Sembach, K.R. 2002,
ApJS, 139, 81
de Boer, K.S., & Savage, B.D. 1983, A&A, 265, 210
de Boer, K.S., & Savage, B.D. 1984, A&A, 136, L7
de Boer, K.S., Morras, R., & Bajaja, E. 1990, A&A, 233, 523
de Boer, K.S. 2004, A&A, 419, 527
Fontana, A., & Ballester, P. 1995, ESO Messenger, 80, 37
Fox, A.J., Wakker, B.P., Smoker, J.V., et al. 2010, ApJ, 718, 1046
Fox, A.J., Richter, P., Wakker, B.P., et al. 2013, ApJ, 772, 110
Fox, A.J., Wakker, B.P., Barger, A., et al. 2014, ApJ, 787, 147
Greiner, J., Hasinger, G., & Thomas, H.-C., A&A, 281, L61
Kaelble, A.,de Boer, K.S., & Grewing, M. 1985, A&A, 143, 408
Kalberla, P. M. W., Burton, W. B., Hartmann, D., et al. 2005, A&A, 440, 775
Lehner, N., Staveley-Smith, L., & Howk, J. C. 2009, ApJ, 702, 940
Morton, D.C. 2003, ApJS, 149, 205
Pettini, M., Zych., B.J., Steidel, C.C., & Chaffee, F.H. 2008, MNRAS, 385, 2011
Putman, M.E., Peek, J.E.G., & Joung, M.R. 2012, ARA&A, 50, 491
Reid, M.J., Menten, K.M., Brunthaler, A., et al. 2014, ApJ, 783, 130
Richter, P., de Boer, K.S., Bomans, D.J., et al. 1999, Nature, 402, 386
Richter, P., Sembach,K.R., Wakker, B.P., et al. 2001, ApJ, 559, 318
Richter, P. 2006, Reviews in Modern Astronomy 19, 31
Richter, P., Charlton, J.C., Fangano, A.P.M., Ben Bekhti, N.,
& Masiero, J.R. 2009, ApJ,
695, 1631
Richter, P., Fox, A. J., Wakker, B. P., et al. 2013, ApJ, 772, 111
Richter, P., Wakker, B.P., Fechner, C., et al. 2015, A&A, submitted
Savage, B.D. & de Boer, K.S. 1981, ApJ, 243, 460
Savage, B.D.,& Sembach, K.R. 1996, ARA&A, 34, 279
Savage, B.D.,& Sembach, K.R. 1991, ApJ, 379, 245
Staveley-Smith, L., Kim, S., Calabretta, M.R., Haynes, R.F., &
Kesteven, M.J. 2003,
MNRAS, 339, 87
Smoker, J.V., Fox, A., & Keenan, F.P. 2015, MNRAS, 451, 4346
Thom, C., Putman, M. E., Gibson, B. K., et al. 2006, ApJ, 638, L97
Thom, C., Peek, J. E. G., Putman, M. E., et al. 2008, ApJ, 684, 364
Wakker, B.P. & van Woerden, H. 1998, ARA&A, 35, 217
Wakker, B. P., York, D. G., Howk, J. C., et al. 2007, ApJ, 670, L113
Wakker, B. P., York, D. G., Wilhelm, R., et al. 2008, ApJ, 672, 298
Wannier, P., & Wrixon, G. T. 1972, ApJL, 173, L119
Welty, D.E., Frisch, P.C., Sonneborn, G., & York, D.G 1999, ApJ, 512, 636
Werner, K., & Rauch, T. 2015, A&A, in press
van Woerden, H., Schwarz, U.J., Peletier, R.F., Wakker, B.P., &
Kalberla, P.M.W. 1999,
Nature, 400, 138